3696
Optimized Sampling Strategy For Big Data
Mining Through Stratified Sampling
Kamlesh Kumar Pandey, Diwakar ShuklaAbstract: The revolution of digital and communication technologies changes the nature and behavior of data to big data respect to volume, variety, and velocity. When applying any data mining techniques for these types of data, it suffers the various challenges with execution time. Divide and conquer, parallel execution, and sampling techniques give a platform for fast execution in the big data environment. This paper used data reduction techniques as sampling for fast execution and identifying which sampling technique is appropriate for big data mining based on existing research. From a practical examination, and theoretical, and existing research perspective, this paper describes big data and their characteristics, big data mining, sampling techniques, sampling for big data mining and design the optimized sampling strateg y algorithm through stratified sampling for big data mining. This optimized algorithm describes the new data mining technique based on stratified sampling. The optimized sampling Strategy is explained by using the partitioning based K-means clustering algorithm, which is known as the SSBKM.
Index Terms: Big Data, Big Data Dimension, Big Data Mining, Big Data Sampling, Sampling, Stratified Sampling, Data Reduction, Stratified Sampling based K-means (SSBKM).
—————————— ——————————
1.
INTRODUCTION
The revolution of digital and communication technology is given to an easier life of human and changed behaviors of data to big data in term of Volume, Velocity, and Variety. Nowadays various sources are available for big data such as social media, internet of things, smart grid, sensor network, cloud computing, medical applications, collective intelligence, data center, retail and enterprise management, and public sec-tor administration. Laney (2001) presents a common framework of big data through Volume, Variety, and Velocity. These three V’s describes the base dimensions of constricting the big data. After that IBM (2012) presents Veracity, SAS defined Variability and Oracle represents Value dimensions inside of Laney dimensions. The last V’s is Visualization is based on the user view expectation [1]. The rise of 7 V’s is defined what is big data and their popularity, difference between traditional data and big data, and limitation of relational database management system [2]. Figure 1 summarized an integrated view of big data dimensions. The Volume is first V’s of big data, which is represented to the huge quantity of data generated through sensors, machines and real-time applications such as social media, internet of things, cloud and mobile computing, and another's machine depend on the device. For example, a jet engine machine-generated 10 terabytes of the data in half an hour. The second V’s, Variety is showing a variety of data types and sources. Traditional databases captured only well-defined data formats such as structured, but the big data captured the heterogeneous data as structured, unstructured, and semi-structured data. These data types are not captured by homogenous sources, but it is captured by heterogeneous sources. The third V’s, velocity is showing the speed of data creation and mining. For example, the internet of things, and
social media generated a huge amount of structured, unstructured, and semi-structured data in very less time. The fourth V’s, Veracity has represented the uncertainty of data and definitions objectivity, truthfulness, unreliability, untrustworthiness, and credibility for improving the accuracy of the sources. The fifth V’s, Variability represents those data where meaning is continued changes due to time, machine and human interactions. For example, the share market data value is continuously changed due to time. The sixth V’s, the value is identifying the valuable data or defining constrained attribute during data mining and data analysis. The last V’s Visualization visualizes the mined result as user expectation such as a graph, figure, table and so on [2-4]. In general, big data are dealing with large volumes of structured or unstructured or semi-structured data with heterogeneous sources and high velocity. Big data researcher reduced big data challenges and tried to develop better to better techniques for capturing, processing, analyzing, and visualizing the huge amounts of data within a limited time span in various disciplines such as mathematics and statistics, data mining and machine learning, optimization, social network analysis, signal processing, and visualization [5-6]. Determining the patterns and extracting knowledge is one of the challenging issues inside of the big data [7]. Data sampling is one of the techniques that extract subsets of the entire data set for analyzed or mining [8] and data mining one of the techniques for big data analysis [9]. Data sampling is a good method for utilizing the memory and time, reducing the size of data for mining and analyzing fast processing, and it has capability increases performance with accuracy for any data mining or analyzed algorithms of the large dataset [10-11].
————————————————
Kamlesh Kumar Pandey, Research Scholar, Department of Computer Science and Applications, Dr. HariSingh Gour Vishwavidyalaya, Sagar, India.
3697
Figure 1: Integrated View of Big Data Dimensions
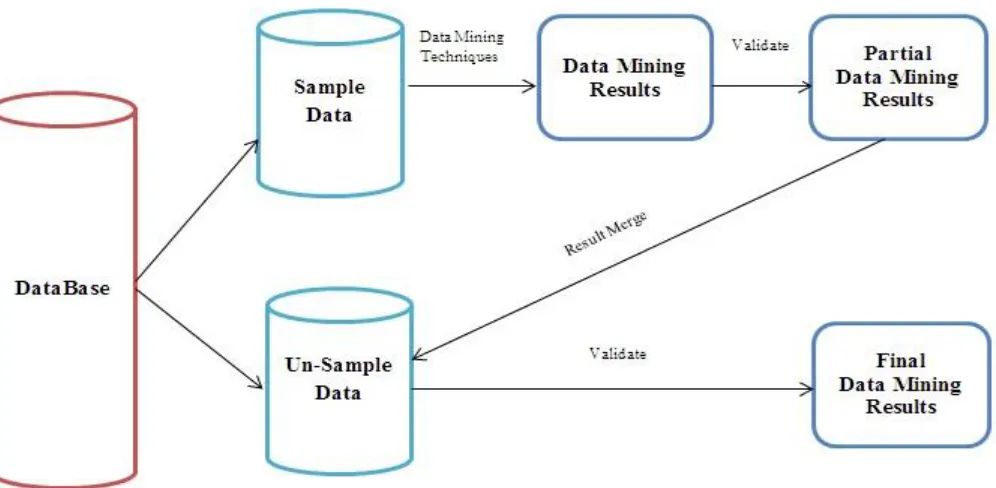
Figure 2: General Framework of Sampling
The main purpose of sampling is given data reduction
3698
dataset through the sampling techniques and after that applies data mining techniques in this sample and data mining result applies to the un-sample data. This concept applies to predict the better to better results through sample data [12]. The objective of this paper is identifying the scalable and suitable sampling techniques for big data mining such as clustering, classification, and associated mining and proposed new sampling model for big data mining.
2
RELATED
WORKS
Shirkhorshidi et al. distributed the big data clustering algorithms into two groups as a single machine clustering multiple machine clustering. Single machine-based clustering using sampling with dimension reduction and multiple machines clustering with the parallel and MapReduce approach [13]. Tsai et al. summarized the sampling method is very helpful for big data analytics respect to the reduction method for the computation time and volume [14]. Rezvanian et al. presented the weighted networks for real data points and proposed six networks based sampling algorithms and simulated these algorithms through real and synthetic weighted networks respect to a relative error, Pearson’s correlation coefficient, skew divergence, and Kolmogorov Smirnov statistic [15]. Rojas et al. reviewed the random sampling and showing the results the combined multiple sampling techniques for helping to the data scientists respect to filters out with and without uncertainty outliers, density and QBC sampling [16]. Hu et al. focuses on the sampling problem of the big data and gives efficient heuristic Cluster Sampling Arithmetic (CSA). CSA algorithms give the idea of clustering through a minimum sample set of big data by the random sampling method [17]. Kim et al. analyzed the selection of bias in the big data through two methods. The first methods describe various sampling techniques and the second method gave the framework for combining the big data sample [18]. Boicea et al. discussed Hash Mod, Random Sort, and Systematic, R, Z, and D sampling techniques and their evaluation due as execution time and accuracy, and test environment in the large set of structured data [7]. Liang et al. proposed stratified sampling for large-scale data with fuzzy clustering on the basis of three steps. The first step defines sensitive hashing technique for obtaining the number of samples from different strata, the second step partitioning the sample into various clusters through fuzzy c-means and third steps assigning the un-sample object in a closed cluster [12].
3
SAMPLING
STRATEGY
FOR
BIG
DATA
ENVIRONMENT
A good sampling strategy always reduces the data size and gives the guarantee sample of data must behold, all characteristics of the sample and gives high-quality mining results [17]. In order to achieve this goal, this section describes many sampling methods for the big data environment [7][10][19]
3.1 Uniform Random Sampling or Random Sampling
Random sampling is a sampling design which selected n distinct data points from the N data points in the large dataset and selection of every n distinct data points have the same probability of selection. This sampling technique works only when every data points are numbered between 1 to N so that easily find out probability πi = n/N of ith data points of the N dataset with the n sample [19]. Some random sampling based
clustering algorithms are CURE (Clustering Using REpresentatives), CLARANS (Clustering Large Applications based on Randomized Sampling), RSEFCM (Random Sampling plus Extension Fuzzy C-Means) [12].
3.2 Progressive Sampling
Progressive sampling starts from a small size sample for data analysis or other purpose and after calculating the efficiency and accuracy of result data. When selected sample size not given appropriate result as efficient and accurate than sample size continuous increases until desired efficiency and accuracy are not met. In Progressive sampling describe as schedule S = {n0,n1 ………..nk } where each nk describe the sample size which size is contiguous increases through an induction algorithm [20]. Some Progressive sampling based sampling algorithm is GOFCM (geometric progressive fuzzy c-means) [12].
3.3 Reservoir Sampling
Reservoir sampling is based on randomized algorithms and memory efficient, which are taking on sample huge dataset where the size is unknown. Reservoir sampling takes sample S >=n , where n is the size of a random sample. This sampling technique takes first n data for data analysis and the rest of the data takes sequentially [21]. Some Reservoir sampling techniques is R, Z, and D [7].
3.4 Stratified Sampling
Stratified sampling is working under two steps first is dividing a whole data in strata S0,S1,…..Sn group and the second step are doing random sampling in each S strata for the creation of the sample[12]. Inside of strata relative homogeneous data object are grouped together according to needed conditions and after that takes a sample for data analysis through random sampling [22].
4 PROPOSED
OPTIMIZED
SAMPLING
STRATEGY
FOR
BIG
DATA
MINING
3699
allocation.
4.1 Algorithm of Optimized Sampling Strategy
1. According to the research problem or research
condition whole dataset are divided into various groups or categories or L strata through stratified sampling.
2. Identify the sample size n on each group through eq.
3. If sample size n > N * MAX(Wl) then sample size n need to normalized according to n=⌈N* MAX(Wl)⌉ .
3. Identify the number of data objects from each strata l
through proportional allocation and optimal allocation. If the data mining techniques used various attributes for mining than proportional allocation is useful otherwise optimal allocation used. In generally optimal sample allocation technique used to create sample data Xs in each strata l.
4. Used to data mining techniques according to the research problem or re-search condition on these sample data Xs and get partial mine result and this data mining algorithm known as stratified sampling based data mining (algorithm name).
5. Measures and evaluated the partial mined data through sampling and data mining evaluate criteria such as accuracy, use case Set, error, variances, precision, relative recall, speedup ratio, statistical test, and other data mining algorithm related criteria.
6. When the partial mine result fulfills the evaluate
criteria, then this partial mine result is applied to un-sample data which is not selected through proportional allocation and optimal allocation and get final mine result.
7. Apply to again data mining evaluate criteria to final mine result if need.
4.2 Stratification
Stratified sampling manages two techniques for big data analysis such as stratification and sample allocation [12][18][19][24]. Stratification dividing heterogeneous data object in homogenous data object according to data analysis condition and sample allocation determine sample size and take data object from each stratum or needed stratum for big data mining. In this section, the paper describes the performance of the proposed optimized sampling Strategy. Any Experimental Analysis of any algorithms depends upon to Experiment environment (tools), dataset, existing algorithm, evaluation criteria, and results. Suppose dataset X is consists of N heterogeneous data object. According to stratification dataset X is dividing the total L strata and every stratum have N homogenous data object. The number of data objects in stratum 1 to L is denoted by N1, N2…… NL therefore total size
of dataset X is N1 + N2 + …… + NL. Let µ for dataset mean
which is defining averages of homogenous or heterogeneous data objects. µl says mean of the lth stratum which is express
by xil where ith data value in the lth stratum and let W
l for the
fraction of the dataset in the lth stratum where W
l =Nl /N.
µ = 1 𝑁⁄ ∑ ∑ 𝑥
= ∑ 𝑁 µ
= ∑ 𝑊 µ
(1)
After Stratification applies random sampling for each stratum
and takes nl sample size. The mean ͞Xl of the sample data object in lth stratum define as to where by Xil where ith sample
data value in the lth stratum.
̅ = ∑
(2)
4.3 Sample size
The size of the sample for big data mining is depending on data object selection. The size of the sample is formulated as eq3 .if the size of sample n is higher than 5% of the whole data set size N then n need to adjust. In this formula, σ2 is
denoted as the variance of whole data set X and σl are
denoted as the standard deviation of the data object of the stratum Sl.
𝑛 = (∑ )
∑
(3)
4.4 Sample allocation
Determining the sample size from each stratum is related to the variance of the sample object ̅ and variance of the sample object ̅ is always belongs to minimization. Variability is one of the dimensions of big data and variance is useful to measure the variability in the form of mean and average. In big data mining, every stratum are independent to each other in the samples taken time for reduce the error and easily calculated to variance and random sampling or stratum mean must be unbiased so stratified estimate of the sample object ̅ = µ. The variance 𝜎 of stratified estimate ̅ is express by var ( ̅ ) and minimize the variance of the sample object is solved by min var ( ̅ ).
𝑣𝑎𝑟( ̅̅̅) =∑ 𝑊 ( ) (1 −
) 𝜎
(4)
𝑚𝑖𝑛 𝑣𝑎𝑟( ̅̅̅) =∑
(5)
By using the Lagrangian method for the chosen optimal nl
sample size for under the optimal sample allocation strategy because High number of data objects inside of strata define heavily sample size with 𝑊𝜎 . A large 𝑊 define a large fraction of object and large 𝜎 define quite spread of data value inside of l stratum.
𝑛 =
∑
(6)
Optimal sample allocation scheme depend upon the individual variance of each stratum and big data have various attributes and mining techniques may depend upon the various attributes so it is very difficult to find out optimal sample allocation to each attribute. The solution of theses problem is used to proportional allocation. The formulation of the dataset mean based on proportional allocation is
̅ =∑ 𝑊 ̅
=∑ 𝑊 ∑
3700
(7)
Optimal sample allocation and Proportional allocation is also ignoring the fix sized dataset and it is useful for velocity (real time) dimensions of big data. The formulation of optimal sample allocation and proportional allocation under the velocity dimensions with Stratified sampling are as
𝑣𝑎𝑟( ̅̅̅ ) =
(∑ ) (8)
𝑣𝑎𝑟( ̅̅̅ ) = ∑ 𝑊𝜎
(9)
The differences between the variance of proportional allocation and optimal allocation under the velocity dimensions with Stratified sampling are as
𝑣𝑎𝑟( ̅̅̅ ) − 𝑣𝑎𝑟( ̅̅̅ ) = ∑ 𝑊(𝜎 − 𝜎̌)
(10)
Where 𝜎̌ = ∑ 𝑊𝜎
When applying uniform random sampling after Stratification process the variance is formulated as
𝑣𝑎𝑟( ̅) =
𝑣𝑎𝑟( ̅) = ∑ ∑ ( − µ)
𝑣𝑎𝑟( ̅) = ∑ 𝑊𝜎 + ∑ 𝑊(µ − µ)
(11)
The differences between the variance of the mean uniform random sampling and proportional allocation define as eq. 12 with velocity.
𝑣𝑎𝑟( ̅) − 𝑣𝑎𝑟( ̅̅̅ ) = ∑ 𝑊(µ − µ)
(12)
This paper observes according to the above formulation, the proportional allocation with stratified sampling every time provides smaller variance as compared to uniform random sampling. If the means of strata is quite variable then the proportional allocation with stratified sampling is highly acceptable as compare to uniform random sampling and if the standard deviations of strata are variable then the optimal allocation is better than proportional allocation under stratification.
5 EXPERIMENTAL
ANALYSIS
OF
OPTIMIZED
SAMPLING
STRATEGY
In this section, the paper describes the performance of the proposed optimized sampling Strategy. Any Experimental Analysis of any algorithms depends upon to Experiment environment (tools), dataset, existing algorithm, evaluation criteria, and results.
5.1 Experiment Environment (tools) and Dataset
The experiment environment of optimized sampling Strategy is used R computing environment and Anuran Calls (MFCCs) Data Set. The experiment environment is configured with an Intel I3 processor, 320 GB hard disk, 4 GB DDR3 RAM with windows 7 Operating System. Anuran Calls (MFCCs) data set consist of 22 dimensions with 7195 real data points [25].
5.2 Exiting Algorithm for Comparing
The paper [26] [27] describes K-means, BIRCH, CLARA, CURE, CLARANS, DBSCAN, and DENCLUE more satiable under the high dimensions, velocity, and volume data. This paper takes the partitioning based K-Means (KM) algorithm with Euclidean distance for cluster constructions using the optimized sampling strategy because K-Means data mining techniques is known as the top second algorithm [28].
5.3 Evaluation Criteria for Validation
Accuracy and running time is the external evaluation criteria of clustering based research for big data mining. This paper used to cluster algorithm for optimized sampling Strategy so that clustering accuracy is identified the correctly classified unlabeled data points and running time gives the total execution time of sampling based clustering and without sampling based clustering (traditional clustering algorithm). The formulation of the clustering algorithm shows in eq. 13. [12][29]
( ) =∑
1
(13)
In the formulation of CA, N is total data object, k (undefined class) and k` (pre-defined class) the total number of cluster and N(i,j) the common object.
5.4 Results
According to the algorithm of optimized sampling Strategy, this paper divide the Anuran Calls dataset into three strata based on categorical, numeric and char data type and used to optimal sample allocation scheme according to clustering data mining technique. Here K-Means algorithms used as a data mining technique which is known as Stratified Sampling based K-Means (SSBKM) under optimized sampling Strategy. The result of an optimized sampling Strategy is shows in Table 1 and Table 2 according to evaluation criteria. Table 1 shows the clustering accuracy in and Table 2 shows the average running time between SSBKM and KM.
TABLE1CLUSTERING ACCURACY OF SSBKM AND KM
Algorithms Clustering Accuracy (%)
KM 95.16 %
SSBKM (overall) 96.02 %
TABLE2AVERAGE RUNNING OF SSBKM AND KM
Algorithms Execution Time (Second)
KM 112
SSBKM (overall) 143
6
CONCLUSION
3701
such as uniform random sampling, progressive sampling, reservoir sampling, and stratified sampling. This section identifies uniform random sampling is suitable under the volume dimensions, progressive sampling suitable under the velocity and volume dimensions, reservoir sampling suitable under the velocity dimensions and stratified sampling suitable under the volume and variety through existing research perspective and related work section. The fourth section proposed the algorithm of optimized sampling strategy for big data mining through stratified sampling. This algorithm describes how to define Stratification, Sample size, sample allocation and how to validate sampling and data mining algorithms. The fifth section evaluates the proposed algorithms through the R computing environment, Anuran Calls data set, K-means clustering. This section proved the optimized sampling Strategy (SSBKM) clustering accuracy is higher as compared to the K-mean algorithm but SSBKM takes more time as compared to the K-mean algorithm.
ACKNOWLEDGMENT
I would like to express my very great appreciation to Prof. Diwakar Shukla, Department of Computer Science and Application, Dr. HariSingh Gour Vishwavidyalaya, Sagar for his valuable and constructive suggestions during the planning and development of this research work. His willingness to give his time so generously has been very much appreciated.
REFERENCES
[1] Lee, I. (2017). Big data: Dimensions, evolution, impacts, and challenges. Business Horizons, 60(3), 293-303. doi:10.1016/j.bushor.2017.01.004
[2] Grover, P., &Kar, A. K. (2017). Big Data Analytics: A Review on Theoretical Contributions and Tools Used in Literature. Global Journal of Flexible Systems Management,18(3), 203-229. doi:10.1007/s40171-017-0159-3
[3] Gandomi, A., &Haider, M. (2015). Beyond the hype: Big data concepts, methods, and analytics. International Journal of Information Management, 35(2), 137-144. doi:10.1016/j.ijinfomgt.2014.10.007
[4] Sivarajah, U., Kamal, M. M., Irani, Z., &Weerakkody, V. (2017). Critical analysis of Big Data challenges and analytical methods. Journal of Business Research, 70, 263-286. doi:10.1016/j.jbusres.2016.08.001
[5] Amado, A., Cortez, P., Rita, P., & Moro, S. (2018). Research trends on Big Data in Marketing: A text mining and topic modeling based literature analysis. European Research on Management and Business Economics,24(1), 1-7. doi:10.1016/j.iedeen.2017.06.002
[6] Chen, M., Mao, S., & Liu, Y. (2014). Big Data: A Survey. Mobile Networks and Applications, 19(2), 171-209. doi:10.1007/s11036-013-0489-0
[7] Boicea, A., Truică, C., Rădulescu, F., &Buşe, E. (2018). Sampling strategies for extracting information from large data sets. Data & Knowledge Engineering,115, 1-15. doi:10.1016/j.datak.2018.01.002
[8] Wu, X., Zhu, X., Wu, G., & Ding, W. (2014). Data mining with big data. IEEE Tran on Knowledge and Data Eng,26(1), 97-107. doi:10.1109/tkde.2013.109
[9] Rojas, J. A., Kery, M. B., Rosenthal, S., &Dey, A. (2017). Sampling techniques to improve big data exploration. 2017 IEEE 7th Symposium on Large Data Analysis and Visualization (LDAV). doi:10.1109/ldav.2017.8231848
[10] Tsai, C., Lai, C., Chao, H., & Vasilakos, A. V. (2016). Big Data
Analytics. Big Data Technologies and Applications,13-52. doi:10.1007/978-3-319-44550-2_2
[11] Chen, B., Haas, P., & Scheuermann, P. (2002). A new two-phase sampling based algorithm for discovering association rules. Proceedings of the 8th ACM SIGKDD ICKDDM - KDD 02. doi:10.1145/775047.775114
[12] Zhao, X., Liang, J., & Dang, C. (2019). A stratified sampling based clustering algorithm for large-scale data.
Knowledge-Based Systems,163, 416-428.
doi:10.1016/j.knosys.2018.09.007
[13] Shirkhorshidi, A. S., Aghabozorgi, S., Wah, T. Y., &Herawan, T. (2014). Big Data Clustering: A Review. Computational Science and Its Applications – ICCSA 2014 Lecture Notes in Computer Science,707-720. doi:10.1007/978-3-319-09156-3_49
[14] Tsai, C., Lai, C., Chao, H., &Vasilakos, A. V. (2015). Big data analytics: A survey. Journal of Big Data,2(1). doi:10.1186/s40537-015-0030-3
[15] Rezvanian, A., &Meybodi, M. R. (2016). Sampling algorithms for weighted networks. Social Network Analysis and Mining,6(1). doi:10.1007/s13278-016-0371-8
[16] Rojas, J. A., Kery, M. B., Rosenthal, S., &Dey, A. (2017). Sampling techniques to improve big data exploration. 2017 IEEE 7th Symposium on Large Data Analysis and Visualization (LDAV). doi:10.1109/ldav.2017.8231848
[17] Zhao, J., Sun, J., Zhai, Y., Ding, Y., Wu, C., & Hu, M. (2017). A Novel Clustering-Based Sampling Approach for Minimum Sample Set in Big Data Environment. International Journal of Pattern Recognition and Artificial Intelligence,32(02), 1850003. doi:10.1142/s0218001418500039
[18] Kim, Jae Kwang and Wang, Zhonglei, "Sampling techniques for big data analysis in finite population inference" (2018). Statistics Preprints. 136.
[19] Thompson, S. K. (2012). Sampling. Hoboken, NJ: Wiley. [20] Provost, F., Jensen, D., & Oates, T. (2001). Progressive
Sampling. Instance Selection and Construction for Data Mining,151-170. doi:10.1007/978-1-4757-3359-4_9
[21] Vitter, J. S. (1985). Random sampling with a reservoir. ACM Transactions on Mathematical Software,11(1), 37-57. doi:10.1145/3147.3165
[22] Jing, L., Tian, K., & Huang, J. Z. (2015). Stratified feature sampling method for ensemble clustering of high dimensional data. Pattern Recognition,48(11), 3688-3702. doi:10.1016/j.patcog.2015.05.006
[23] Franke, B., Plante, J., Roscher, R., Lee, E. A., Smyth, C., Hatefi, A., . . . Reid, N. (2016). Statistical Inference, Learning and Models in Big Data. International Statistical Review,84(3), 371-389. doi:10.1111/insr.12176
[24] Rice, J. (2015). Mathematical statistics and data analysis. Brantford, Ontario: W. Ross MacDonald School Resource Services Library.
[25] Dua, D. and KarraTaniskidou, E. (2017). UCI Machine Learning Repository [http://archive.ics.uci.edu/ml]. Irvine, CA: University of California, School of Information and Computer Science. [26] Pandove, D., &Goel, S. (2015). A comprehensive study on
clustering approaches for big data mining. In Proceedings of IEEE 2nd International Conference on Electronics and Communication Systems (pp. 1333-1338). IEEE Xplore Digital Library. doi:10.1109/ecs.2015.7124801
3702
[28] Dave, M., &Gianey, H. (2016). Different clustering algorithms for Big Data analytics: A review. In Proceedings of IEEE International Conference System Modeling & Advancement in Research Trends (pp. 328-333). IEEE Xplore Digital Library. doi:10.1109/sysmart.2016.7894544