Article 1
Estimation of Missing Streamflow Data Using Anfis
2Models and Determination of the Number of
3Datasets for Anfis: The Case of Ye
ş
il
ı
rmak River
4
Kemal Saplioglu 1,*, Tulay Sugra Kucukerdem 2 5
1 Suleyman Demirel University; [email protected]
6
2 Suleyman Demirel University; [email protected]
7
* Correspondence: [email protected] ; Tel.: +90-246-211-1213 8
9
Abstract: Good data analysis is required for the optimal design of water resources projects. 10
However, data are not regularly collected due to material or technical reasons, which results in 11
incomplete-data problems. Available data and data length are of great importance to solve those 12
problems. Various studies have been conducted on missing data treatment. This study used data 13
from the flow observation stations on Yeşilırmak River in Turkey. In the first part of the study, 14
models were generated and compared in order to complete missing data using ANFIS, multiple 15
regression and Normal Ratio Method. In the second part of the study, the minimum number of data 16
required for ANFIS models was determined using the optimum ANFIS model. Of all methods 17
compared in this study, ANFIS models yielded the most accurate results. A 10-year training set was 18
also found to be sufficient as a data set. 19
Keywords: anfis, missing data, multiple regression, normal ratio method, Yeşilırmak
20
.
21
1. Introduction 22
Both the growing population and the rapidly developing industrialization lead to an increased
23
demand for water. The limited availability of resources results in a number of problems in meeting
24
the demand. Exploitation of unused water resources or using existing water resources in an optimum
25
way can be a solution to these problems. Optimal utilization of available water resources, in
26
particular, requires a good analysis of data. Due to the small number of stations in project areas or
27
insufficient data length, some studies have been undertaken to generate new data using existing
28
measurement stations [1]. These hydrological studies have mainly focused on precipitation [2],
29
evaporation [3] and river flows [4].
30
Studies on missing data treatment generally address data correlation [5,6], back-propagation
31
(BP) neural network using Artificial Intelligence [7], ANFIS models [8,9] and models using artificial
32
neural networks (ANN) [10,11]. In addition, Fuzzy studies [12], in which modeling is based on pure
33
expert knowledge, are also important. Some studies on missing data treatment using ANFIS are the
34
completion of missing flow data of the Middle Euphrates basin [13], completion of missing
35
precipitation data in Serbia [14] and Malaysia [15], and completion of missing flow data and
36
modelling of sediment transport of Terengganu River, Malaysia [16] and Gediz River, Turkey [17].
37
This study investigated the monthly data of the stations of Yeşilirmak River in the North of
38
Turkey. In the first part of the study, multiple regression tests based on interstation correlations were
39
performed. In the second part of the study, an optimum data completion model was selected using
40
ANFIS. In the last part of the study, the number of data required for a correct prediction was searched
41
and the minimum number of data required for reliable estimates was discussed.
42 43 44
2. Materials and Methods 45
The first part of this section of the study will present information and statistics on Yeşilırmak
46
River and its stations. The second part will provide information on the classical method, multiple
47
regression method and ANFIS used in the study.
48 49
2.1. Yeşilırmak River and Stations 50
51
The Yeşilırmak basin, one of the 25 basins in Turkey, is located between latitudes 39° 30' and 41°
52
21' and longitudes 34° 40' and 39° 48' (Figure 1). The basin is named after Yeşılırmak River. The main
53
river channel of the basin is 519 km in length. The main tributaries of Yeşilırmak River are Kelkit,
54
Çekerek, Çorum, Çat and Tersakan streams. Estimated to be about 3,8 million ha, Yeşilırmak basin is
55
the third largest basin in Turkey [18,19].
56
57
Figure 1. Site location map of Yeşilırmak Basin 58
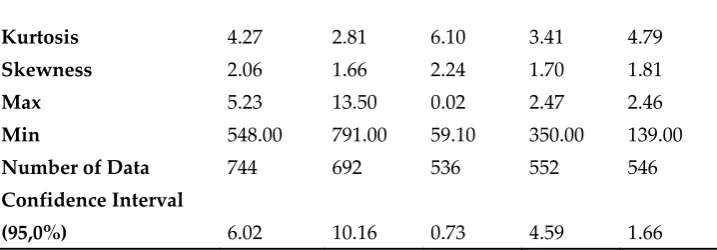
Stations No 1401, 1402, 1412, 1413 and 1414 of Yeşilırmak River were used in the study. Table 1
59
shows the statistics of the stations. Table 2 summarizes the correlation between the stations.
60
Table 1. Statistical analysis of data from stations 61
1401 1402 1412 1413 1414
Y-coordinate 40°28’42’’ 40°46’18’’ 40°27’06’’ 40°44’40’’ 40°26’03’’
X-coordinate 36°59’56’’ 36°30’45’’ 35°25’03’’ 36°06’43’’ 36°07’05’’
Precipitation Area
(km²) 10048.8 33904.0 3668.8 21667.2 5409.2
Altitude 375 190 530 301 510
Mean 71.96 150.01 7.35 63.88 25.68
Standard Error 3.07 5.17 0.37 2.34 0.84
Median 35.45 102.50 4.21 45.30 19.65
Kurtosis 4.27 2.81 6.10 3.41 4.79
Skewness 2.06 1.66 2.24 1.70 1.81
Max 5.23 13.50 0.02 2.47 2.46
Min 548.00 791.00 59.10 350.00 139.00
Number of Data 744 692 536 552 546
Confidence Interval
(95,0%) 6.02 10.16 0.73 4.59 1.66
62
Table 2. Correlation between data from stations 63
Stations 1401 1402 1412 1413 1414
1401 1
1402 0.909 1
1412 0.516 0.784 1
1413 0.702 0.926 0.885 1
1414 0.539 0.565 0.432 0.518 1
64
2.2.Missing Data Treatment Using Normal Ratio Method
65
In this method, each input data is divided by its annual average value, and these values are
66
multiplied by the average of the station (average of data) whose missing data are to be completed.
67
All input values obtained in the last stage of the calculation are summed, and divided by the number
68
of inputs so that the missing data are completed [16].
69
= ( ∗ ( )
( )+ ∗
( )
( )+ ⋯ + ∗
( )
( ))/ (1)
70
where is the flow rate and is the number of input stations.
71
72
2.3.Multiple Regression Analysis
73
Multiple regression analysis is a statistical method for determining the mathematical dimension
74
of the relationship between variables affecting each other. The value to be estimated using the
75
equation formulated based on multiple regression analysis is written in the form of a function of
76
values affecting it [21].
77
= + + ⋯ + + (2)
where is the dependent (estimated) variable, is the independent (explanatory) variable, is
79
the regression coefficient, is the number of input parameters and is the error term.
80
Multiple linear regression analysis can be used when data are normally distributed, the
81
relationship between independent variables and dependent variable is linear, and error variance for
82
each independent variable is constant [22].
83
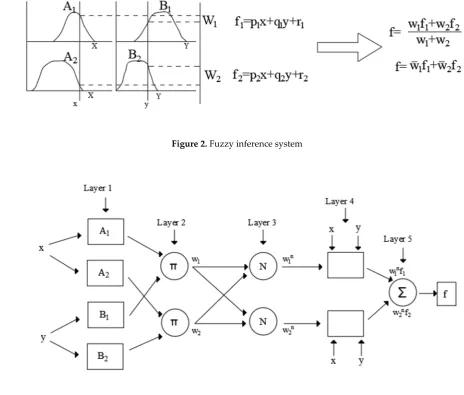
2.4.ANFIS (Artificial Neural Network Fuzzy Inference Systems)
84
Developed by Jang in [22], ANFIS is a modeling method that combines Fuzzy Logic and YSA
85
models. Different from Fuzzy Logic, ANFIS is based on the use of data for the automatic acquisition
86
of rules. ANFIS structure uses artificial neural networks' learning ability and fuzzy logic inference,
87
and therefore, it is more successful than when artificial neural networks model or fuzzy logic is used
88
alone. When input and output values are known, ANFIS determines all possible rules or allows them
89
to be generated using input and output values (Figure 2). ANFIS structure consists of five layers:
90
fuzzification layer, rule layer, normalization layer, defuzzification layer and summation layer (Figure
91
3). The first and fourth layers are adaptable [23,24].
92
93
Figure 2. Fuzzy inference system 94
95
Figure 3. ANFIS architecture 96
3. Results 98
Models were developed using Yeşilırmak River data for the estimation of missing data of
99
stations 1402 and 1413. Two-input-one-output models and four-input-one-output models were
100
developed to complete the missing data of station 1402. The two-input-one-output models were used
101
as the output of station 1402. Stations 1413 and 1401 connected to station 1402 on the left- and
right-102
hand sides, respectively, were used to estimate station 1402. In addition to these stations, stations
103
1412 and 1414 connected to station 1413 on the left- and right-hand sides, respectively, were used to
104
estimate station 1413 in the four-input-one-output models. A two-input-one-output model was
105
developed, and stations 1414 and 1412 were used for the estimation of missing data of station 1413.
106
In the models developed for stations 1402 and 1413, classical and multiple regression models were
107
constructed and compared as well as the ANFIS method. In the last part of the study, the minimum
108
number of data required to reach the correct result using ANFIS models was obtained.
109
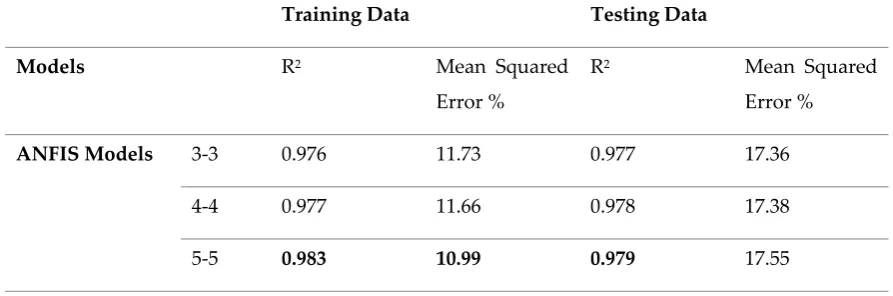
3.1. First Data Set Models
110
The aim of these models was to complete the missing data of station 1402. For this, the data of
111
stations 1413 and 1401 were used. Of 540 data, the first 400 were used for training and the remaining
112
for testing. In addition to ANFIS models generated by changing the number of sets of input
113
parameters, classical method and the multiple regression model were used to compare the results
114
(Table 3).
115 116
The equation of the classical method is:
117
= (2,072 ∗ + 2,215 ∗ )/2 (1)
118
119
The equation of the multiple regression model is:
120
= 0,896 ∗ + 1,178 ∗ + 5,37 (2)
121
122
Table 3. Training and testing data results of models developed for the first data set 123
Training Data Testing Data
Models R2 Mean Squared
Error %
R2 Mean Squared
Error %
ANFIS Models 3-3 0.976 11.73 0.977 17.36
4-4 0.977 11.66 0.978 17.38
6-6 0.980 11.13 0.978 16.60
7-7 0.979 11.12 0.961 17.00
8-8 0.983 11.09 0.959 17.12
Normal Ratio Method 0,970 11.79 0.955 18.85
Multiple Regression 0,972 13.54 0.960 18.62
124
The results of this part of the study show that ANFIS models are not superior to the classical and
125
multiple regression models but that all ANFIS models yield better results than the other two methods.
126
The models in which each input has 5 subsets are the optimum models. The speed of the training
127
phase of the model is also noteworthy. The comparison of the values obtained from the optimum
128
ANFIS model with the observed values shows that the errors of both the minimum and maximum
129
flow values are very few (Figure 4).
130
131
Figure 4.Comparison of observed data and estimated data of Anfis (5-5) model test data for the first data set 132
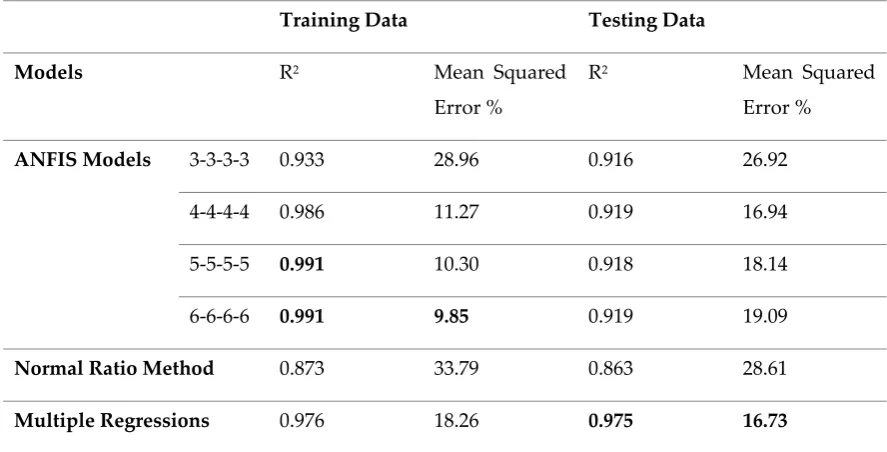
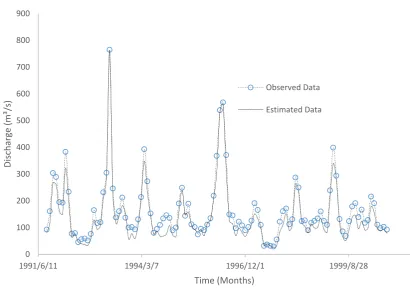
3.2.Second Data Set Models
133
These models also aimed to complete the missing data of station 1402. To achieve this, the data
134
of stations 1412 and 1414 as well as those of 1413 and 1401 were used. Of 504 data, the first 405 were
135
used for training and the remaining for testing. In addition to ANFIS models generated by changing
136
the number of sets of input parameters, classical method and multiple regression model were used
137
to compare the results (Table 4).
138 139
0 100 200 300 400 500 600 700 800 900
1988/12/23 1991/9/19 1994/6/15 1997/3/11 1999/12/6
Discharge
(m³/s)
Time (Months)
The equation of the classical method is:
140
= (2,107 ∗ + 19,53 ∗ + 2,26 ∗ + 5,44 ∗ )/4 (3)
141
The equation of the multiple regression model is:
142
= 0,921 ∗ + 1,036 ∗ + 1,090 ∗ − 0,251 ∗ + 11,071 (4)
143
Table 4.Training and testing data results of models developed for the second data set 144
Training Data Testing Data
Models R2 Mean Squared
Error %
R2 Mean Squared
Error %
ANFIS Models 3-3-3-3 0.933 28.96 0.916 26.92
4-4-4-4 0.986 11.27 0.919 16.94
5-5-5-5 0.991 10.30 0.918 18.14
6-6-6-6 0.991 9.85 0.919 19.09
Normal Ratio Method 0.873 33.79 0.863 28.61
Multiple Regressions 0.976 18.26 0.975 16.73
145
The results show that ANFIS models provide more accurate results than the classical model and
146
worse results than multiple regression models. The models with 4 inputs are quite slow, especially
147
when the number of subsets of inputs is greater than 5. The models with an increasing number of
148
inputs are much slower than multiple regression models. The comparison of the values of the
149
optimum ANFIS model with the observed values shows that although the largest error is at the
150
minimum flow values, this error is quite small at the maximum flow values (Figure 5).
152
Figure 5. Comparison of observed data and estimated data of Anfis (5-5) model test data for the second data 153
set 154
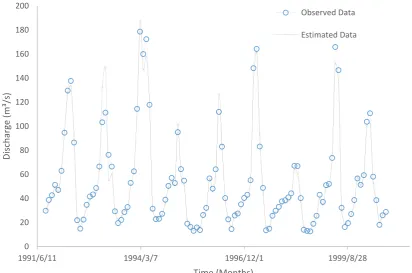
3.3.Third Data Set Models
155
The aim of these models was to complete the missing data of station 1413. For this, the data of
156
stations 1412 and 1414 were used. Of 504 data, the first 405 were used for training and the remaining
157
for testing. The results were compared using the classical method and multiple regression model as
158
well as ANFIS models generated by changing the number of sets of input parameters (Table 5).
159 160
The equation of the classical method is:
161
= (2,407 ∗ + 8,641 ∗ )/2 (5)
162
The equation of the multiple regression model is:
163
= 0,404 ∗ + 4,904 ∗ + 17,576 (6)
164
165
166
0 100 200 300 400 500 600 700 800 900
1991/6/11 1994/3/7 1996/12/1 1999/8/28
Discharge
(m³/s)
Time (Months)
Table 5. Training and testing data results of models developed for the third data set 167
Training Data Testing Data
Models R2 Mean Squared
Error %
R2 Mean Squared
Error %
ANFIS Models 3-3 0.890 20.29 0.865 23.24
4-4 0.892 19.35 0.872 22.93
5-5 0.881 18.64 0.879 22.56
6-6 0.865 19.88 0.854 23.07
Normal Ratio Method 0.764 27.41 0.694 36.60
Multiple Regressions 0.905 34.26 0.757 46.74
168
The results show that ANFIS models provide more accurate results than the classical and
169
multiple regression models. Although the results are not as good as those in the first data set, they
170
remain within acceptable error limits. The models in which each input has 5 subsets are the optimum
171
models. The comparison of the values of the optimum ANFIS model with the observed values shows
172
that the errors of both the minimum and maximum flow values are very few (Figure 6).
173
174
0 20 40 60 80 100 120 140 160 180 200
1991/6/11 1994/3/7 1996/12/1 1999/8/28
Discharge
(m³/s)
Time (Months)
Figure 6. Comparison of observed data and estimated data of Anfis (5-5) model test data for the third data set 175
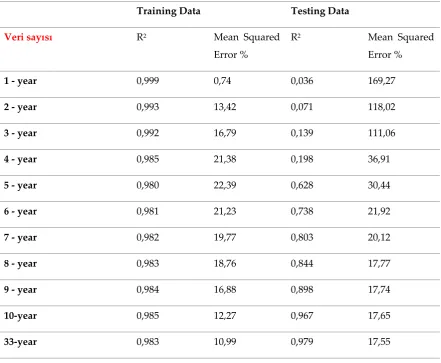
3.4. Determining the Minimum Number of Data for Anfis Model Training 176
This part of the study attempted to obtain the minimum number of data required for a reliable
177
ANFIS model training. The model with a 5-5 set of the first data set (the optimum modelling) were
178
the model of choice for this purpose. The models were trained using a 10-year data set and the
179
procedure was repeated year by year. The evaluation of the results is summarized in Table 4.
180
Table 6. Regression and error values for the number of data used for ANFIS model training 181
Training Data Testing Data
Veri sayısı R2 Mean Squared
Error %
R2 Mean Squared
Error %
1 - year 0,999 0,74 0,036 169,27
2 - year 0,993 13,42 0,071 118,02
3 - year 0,992 16,79 0,139 111,06
4 - year 0,985 21,38 0,198 36,91
5 - year 0,980 22,39 0,628 30,44
6 - year 0,981 21,23 0,738 21,92
7 - year 0,982 19,77 0,803 20,12
8 - year 0,983 18,76 0,844 17,77
9 - year 0,984 16,88 0,898 17,74
10-year 0,985 12,27 0,967 17,65
33-year 0,983 10,99 0,979 17,55
182
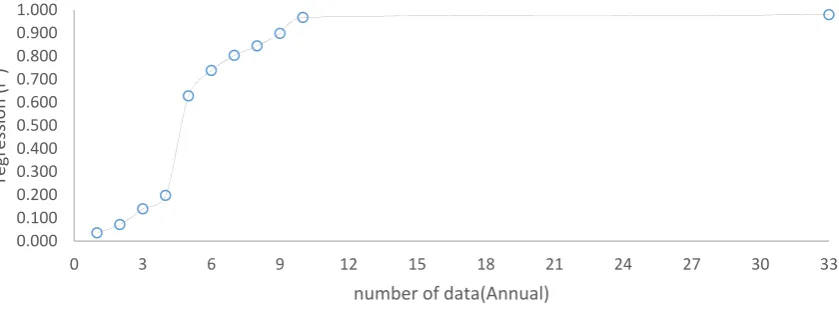
The number of data used for ANFIS model training does not affect the regression coefficient of
183
the training data very much (Table 6). However, the regression results obtained during the testing of
184
the models show that the results of the 10-year data set and model are very similar to those of the
33-185
year data and training (Figure 7). The error values show that the 8-year data set is sufficient for
186
training (Figure 8). In conclusion, a 10-year data set may be sufficient for Anfis model training.
188
Figure 7. Regression values for the number of data used for ANFIS model training 189
190
Figure 8.Error values for the number of data used for ANFIS model training 191
4. Conclusions 192
It is not always possible to collect long and coordinated data to optimally use water resources
193
projects. The aim of this study was to develop ANFIS models for stations on Yeşilırmak River in order
194
to solve this problem and improve the existing methods. Another aim of the study was to investigate
195
how the number of input parameters and amount of data affect ANFIS models. For this purpose, 3
196
different data sets were analyzed.
197
Results show that besides classical and regression models, ANFIS models can be used to
198
complete missing flow data. ANFIS models yield very accurate results especially when the number
199
of input parameters is small. However, multiple regression models yield better results than ANFIS
200
models when the number of input parameters is large. In addition, it takes ANFIS models longer to
201
achieve results when the number of input parameters increases. Lastly, at least a 10-year data is
202
required for a reliable ANFIS model training phase.
203
In conclusion, the ANFIS modelling yield accurate results and therefore can be used to complete
204
missing data when the number of input parameters is small and data set is older than 10 years.
205
It is not always possible to collect long and coordinated data to optimally use water resources
206
projects. The aim of this study was to develop ANFIS models for stations on Yeşilırmak River in order
207
0.000 0.100 0.200 0.300 0.400 0.500 0.600 0.700 0.800 0.900 1.000
0 3 6 9 12 15 18 21 24 27 30 33
regression (r²)
number of data(Annual)
0 20 40 60 80 100 120 140 160 180
0 3 6 9 12 15 18 21 24 27 30 33
error
to solve this problem and improve the existing methods. Another aim of the study was to investigate
208
how the number of input parameters and amount of data affect ANFIS models. For this purpose, 3
209
different data sets were analyzed.
210
Results show that besides classical and regression models, ANFIS models can be used to
211
complete missing flow data. ANFIS models yield very accurate results especially when the number
212
of input parameters is small. However, multiple regression models yield better results than ANFIS
213
models when the number of input parameters is large. In addition, it takes ANFIS models longer to
214
achieve results when the number of input parameters increases. Lastly, at least a 10-year data is
215
required for a reliable ANFIS model training phase.
216
In conclusion, the ANFIS modelling yield accurate results and therefore can be used to complete
217
missing data when the number of input parameters is small and data set is older than 10 years.
218
This section is not mandatory, but can be added to the manuscript if the discussion is unusually
219
long or complex.
220
References 221
1. M. A. B. Aissia; F. Chebana; T. B. M. J. Quarda. Multivariate missing data in hydrology – Review and applications. Advances in Water Resources 2017, 110,pp.299-309.
2. S. Sun; G. Leonhardt; S. Sandovald; J. L. B. Krajewski; W. Rauch. A Bayesian method for missing rainfall estimation using a conceptual rainfall–runoff model. Hydrological Sciences Journal 2017, 62,pp.2456–2468.
3. Y. S. Güçlü; A. M. Subyani; Z. Şen. Regional fuzzy chain model for evapotranspiration estimation. Journal of Hydrology 2017, 544, pp. 233-241.
4. J. T. Shiau; H. T. Hsu. Suitability of ANN-Based Daily Streamflow Extension Models: a Case Study of Gaoping River Basin, Taiwan. Water Resources Management 2016, 30, pp. 1499-1513.
5. R. Bakış; S. Göncü. Completıon Of Mıssıng Data In Rıvers Flow Measurement: Case Study Of Zab Rıver Basın. Anadolu University Journal of Science and Technology A- Applied Sciences and Engineering 2015, 16, pp. 63-79.
6. R. S. Britoa; M. C. Almeida; J. S. Matos. Estimating flow data in urban drainage using partial least squares regression. Urban Water Journal 2017, 14, pp. 467-474.
7. T. Gao; H. Wang. Testing Backpropagation Neural Network Approach in Interpolating Missing Daily Precipitation. Water Air Soil Pollut 2017, 228, pp. 2-17.
8. M. T. Dastorani; A. Moghadamnia; J. Piri; M. R. Ramirez. Application of ANN and ANFIS models for reconstructing missing flow data. Environ Monit Assess 2010, 166, pp. 421-434.
9. L. Mpallas; C. Tzimopoulos; C. Evangelidis. Rainfall data calculation using Artificial Neural Networks and adaptive neuro-fuzzy inference systems. Sustainable Irrigation Management, Technologies and Policies 2010, 134, pp. 133-144.
10. J. W. Kim; Y. A. Pachepsky. Reconstructing missing daily precipitation data using regression trees and artificial neural networks for SWAT streamflow simulation. Journal of Hydrology 2010, 394, pp. 305-314.
11. M. Kim; S. Beak; M. Ligaray; J. Pyo; M. Park; K. H. Cho. Comparative Studies of Different Imputation Methods for Recovering Streamflow Observation. Water 2015, 7, pp. 6847-6860.
12. P. Coulibaly; N. D. Evora. Comparison of neural network methods for infilling missing daily weather records. Journal of Hydrology 2007, 341, pp. 27-41.
13. A. G. Yilmaz; N. Muttil. Runoff Estimation by Machine Learning Methods and Application to the Euphrates Basin in Turkey. Journal of Hydrologic Engineering 2014, 19, pp. 1015-1025.
15. N. Nawaz; S. Harun; R. Othman; A. Heryansyah. Neuro-Fuzzy Systems Approach To Infıll Mıssıng Raınfall Data For Klang Rıver Catchment, Malaysıa. Jurnal Teknologi 2016, 78, pp. 15-21.
16. W. N. W. Ismail; W. Z. W. Zin. Estimation of rainfall and stream flow missing data for Terengganu, Malaysia by using interpolation technique methods. Malaysian Journal of Fundamental and applied Sciences 2017, 13, pp. 214-218.
17. A. Ulke; G. Tayfur; S. Ozkul. Predicting Suspended Sediment Loads and Missing Data for Gediz River, Turkey. Journal of Hydrologic Engineering 2009, 14, pp. 954-965.
18. A. Kurunç; K. Yürekli; F. Öztürk. Effect of Discharge Fluctuation on Water Quality Variables from the Yeşilırmak River. Tarım Bilimleri Dergisi 2005, pp. 189-195.
19. Yeşilırmak Havzası Toprakları, Topraksu Genel Müdürlüğü, Ankara, 1970.
20. W. Sun; B. Trover. Multiple model combination methods for annual maximum water level prediction during river ice breakup. Hydrological Processes 2018, 32, pp. 421-435.
21. J. F. Hair; W. C. Black; B. J. Babin; R. E. Anderson. Multivariate Data Analysis, Pearson, 2009.
22. S. R. Jang. ANFIS: Adaptive-Network-Based Fuzzy Inference System. IEEE Transactions on Systems, Man, and Cybernetics 1993.
23. P. C. Nayak, K. P. Sudheer, D. M. Rangan ve K. S. Ramasastri. A neuro-fuzzy computing technique for modeling hydrological time series. Journal of Hydrology 2004, pp. 52-66.