Witnessing evolution of SARS-CoV-2 through comparative phylogenomics: The proximate origin is Guangdong, not Wuhan
Özgül Doğana, Ertan Mahir Korkmaza*, Mahir Budaka, Battal Çıplakb, Hasan Hüseyin
Başıbüyük c
a Department of Molecular Biology and Genetics, Faculty of Science, Sivas Cumhuriyet
University, Sivas, Turkey.
bDepartment of Biology, Faculty of Science, Akdeniz University, Antalya, Turkey
c Department of Gerontology, Faculty of Health Sciences, Akdeniz University, Antalya, Turkey.
*Corresponding author
E-mail: [email protected]
ABSTRACT
A new form of coronavirus called severe acute respiratory disease coronavirus type 2 (SARS-CoV-2) is currently causing a pandemic. A six-month evolutionary history of SARS-CoV-2 is witnessed by characterising the total genome of 821 samples using comparative phylogenomic approaches. Our analyses produced striking inclusive results that may guide scientists/professionals for the past/future of pandemic. Phylogenetic and time estimation analyses suggest the proximate origin of pandemic strain as Guangdong and the origin time as first half of September 2019, not Wuhan and December 2019, respectively. The viral genome experienced a substitution rate similar to other RNA viruses, but it is particularly high in some of the peptides encoding sequences such as leader protein, E gene, orf8, orf10, nsp10, N gene, S gene and M gene and nsp4, while low in nsp11, orf7a, 3C-like proteinase, nsp9, nsp8 and endoRNase. Most strikingly, the divergence rate of amino acid sequences is high proportional to nucleotide divergence. Additionally, specific non-synonymous mutations in nsp3 and nsp6 evolved under positive selection. The exponential growth rate (r), doubling time (Td) and R0 were estimated to be 47.43 per year, 5.39 days and 2.72, respectively. Comparison of synapomorphies distinguishing the SARS-CoV-2 and the candidate ancestor bat coronavirus indicates that mutation pattern in nsp3 and S gene enabled the new strain to invade human and become a pandemic strain. We arrive at the following main conclusions: (i) six months evolution of viral genome is nearly neutral, (ii) origin of pandemic is not Wuhan and predates formal reports, (iii) although viral population is ongoing an exponential growth, the doubling time is evolving towards shortening, and (iv) divergence rate of total genome is similar to other RNA viruses, but it is prominently high in some genes while low in some others and evolution in these genes should be closely monitored as their protein products intervening to pathogenicity, virulence and immune response.
INTRODUCTION
Human populations have experienced a period of explosive growth depending on decreases in external cause mortality during approximately last 250 years following the Industrial Revolution (1). The growing human population has also led to anthropogenic impact on the environment promoting continuous and multiple contacts between people, domestic and wild animals. Such contacts were considered as main cause for the emergence and spread of zoonotic infectious diseases in association with crowded settlement (2). Most known examples of the emerging infectious diseases throughout and in various parts of the world include the smallpox, Spanish flu (H1N1 influenza), plague, cholera, Human Immunodeficiency Virus (HIV), hepatitis C, avian flu (H5N1 influenza), swine flu (H1N1 influenza), Severe Acute Respiratory Syndrome Coronavirus (SARS), and Ebola Virus (EBOV) (3–5).
It is known that the emergence and re-emergence of most of the zoonotic infectious diseases are resulted from viruses with RNA as their genetic material, which can rapidly adapt to varying environmental conditions owing to their exceptionally shorter generation times, high mutation rates, frequent recombination and re-assortment events creating novel genotypes from co-circulating strains (quasispecies) (3, 6). The occurrence of the high mutation rates, as high as a million times [10-2 - 10-5 per site per year (7)] greater than their hosts [2,2 x 10⁻⁹ per site per year (8)], is considered as a beneficial trait for RNA viruses due to prominent enhancement in the ability of their virulence and evolvability.
The recent pandemic outbreak resulted from a novel coronavirus, named as SARS-CoV-2 (also referred to as hCoV-19) (9), causing unusual respiratory condition with various degrees of severity was reported for the first time by the end of 2019 in Wuhan, China (10, 11). SARS-CoV-2 has a linear positive ss-RNA genome with a length of 29,903 nt, consisting of a leader sequence, ORF1ab encoding replicase polyproteins involved in RNA replication and transcription processes and non-structural proteins (nsp), S gene encoding spike glycoprotein, E gene encoding envelope protein, M gene encoding membrane glycoprotein, N gene encoding nucleocapsid phosphoprotein and six ORFs encoding peptides with unknown exact functions (12).
(13, 14), was generated containing 16 non-structural proteins, four structural proteins and six accessory proteins (20–23). Although a few of these peptide encoding sequences overlap (23), each one was treated as independent encoding unit to understand their evolution separately and outline their potential medical implications. The dataset/sub-datasets were subjected to appropriate bioinformatics analyses to accomplish the following specific objectives: (i) to explore evolutionary destiny of SARS-CoV-2 and its likely closest relative bat-RaTG13-CoV (13) based on synapomorphic characters for the first time, (ii) to determine the place of origin and likely origin strain based on phylogenetic trees, (iii) to estimate the time of origin and the rate of base/amino acid substitutions per individual peptide encoding sequences and total genome by time estimation analyses (iv) to estimate the demographic evolutionary dynamics such as exponential growth rate (r), doubling time (Td) and basic reproduction number (R0), which were computationally predicted based on the genome data using a Bayesian framework, (v) finally, to investigate adaptive substitutions across SARS-CoV-2 genomes and substitution rates of each peptide encoding sequences, which are clinically important traits as they enable the virus to escape from vaccine coverage, to expand host range and to resist against to potential drugs.
MATERIAL and METHODS
Construction of dataset and basic sequence statistics
A dataset of 821 samples was constructed by retrieving the complete genomes of SARS-CoV-2 representing 38 countries from GISAID (13 March SARS-CoV-20SARS-CoV-20; https://www.gisaid.org/) database. Details of the samples were presented in Table S1. Annotation of the genomes were performed using ORFFinder implemented in Geneious R9 (24) and by comparison with the reference SARS-CoV-2 genome from NCBI (NC045512). Sequences were aligned using MAFFT v7.450 (25) and manually checked by MEGA X (26). The basic sequence statistics such as nucleotide and amino acid identities, nucleotide diversity and nucleotide compositions were estimated by MEGA X.
Comparative distribution of synapomorphies
(Trees: ‘Describe Trees’ with ‘phylogram’, ‘labelled internal nodes’, and ‘list of synapomorphies’). The resulting logfile listed all synapomorphies of the dataset. The synapomorphic changes were screened and comparatively analysed in terms of total numbers, positions and substitution types (transitions/transversions and synonymous/nonsynonymous) across the genome.
Model selection, phylogenetic analyses and network reconstruction
The bat-RaTG13-CoV sample was included to the dataset as outgroup (13) for model selection and phylogenetic analyses. The best-fit evolution model of the dataset was selected using ModelTest-NG (28), applying the default parameters under three statistical criteria (AIC, BIC, and DT). The Maximum Likelihood (ML) tree was built using RAxML v8.0.9 (29) under the GTR substitution model with gamma distribution (gamma shape: 0.507).
To deeply investigate the evolutionary relationships and the proximate origin place of pandemic form of the SARS-CoV-2, a median-joining (MJ) network (30) was constructed using a dataset comprising total genome of 25 human SARS-CoV-2 samples selected from the basal placement of each clade and/or subclade of the phylogenetic trees generated here including the samples from Wuhan (China), supposed to be origin place of the outbreak (10), and the bat-RaTG13-CoV was assigned as outgroup (Table S3). The analysis was performed in Network v.5.0.1.1 (available at http://www.fluxus-technology.com) with the default settings (ε = 0).
Estimation of mutation rates of genome and peptide encoding sequences
The individually aligned peptide encoding sequences of SARS-CoV-2 samples were concatenated by SequenceMatrix v.1.7.8 (31). The substitution rate estimation of each peptide encoding sequences and whole genome was conducted in BEAST v1.10.4 (32) using the available dates for samples with a random starting tree on the CIPRES science gateway portal (33). As the dataset were not clocklike (likelihood ratio test: −ln+c 52308.105, −ln−c -49863.927, d.f. = 819, P = 0.0000E+000), the analyses were performed by an uncorrelated relaxed molecular clock model with a lognormal rate distribution under GTR+G model and combined with a coalescent model with an exponentially growing population [frequently
preferred for viral outbreaks and suggested by A. Rambaut
(http://virological.org/t/phylodynamic-analysis-176-genomes-6-mar-2020/356)]. Four independent analyses were performed using 100 million generations (sampling every 10000 generations) and then these analyses were combined after removal of the burn-in of 10 % using LogCombiner version 1.10.4. The results were assessed to show convergence and ensure effective sample sizes (ESS > 200) in Tracer v1.7. The maximum clade credibility of trees was calculated using TreeAnnotator v1.10.4 (32) after removing a 20% burn-in of the samples.
To understand the course of the pandemic from genome data, the demographic dynamics of SARS-CoV-2 outbreak, were inferred from Bayesian coalescent model using demographic reconstruction option in Tracer v1.7. The doubling time (Td) was calculated using the following formula: Td = ln(2)/r, assuming that the pandemic is growing exponentially with a constant growth rate (r) (34). The basic reproduction number (R0) was calculated using the formula by Anderson and May (35): 1 + [ln(2) / Td] x D, where D is the duration of the infectious period [13.4 days, (36)].
Gene-level selection analyses
To investigate the role of different selective forces in the evolution of each peptide encoding sequences of SARS-CoV-2, the nonsynonymous (dN) and synonymous (dS) substitution rates for each codon, and codons under pervasive and/or episodic positive selection were estimated using the codon-based approaches FUBAR [the Bayesian MCMC-based fast unbiased approximate Bayesian analysis; (37)] and MEME [mixed effects model of evolution; (38)] implemented in HyPhy package (39) on the DataMonkey server (http://www.datamonkey.org/dataupload.php). Statistical significance was assessed by posterior probability > 0.95 (FUBAR) and P-value < 0.05 (MEME). The magnitude categories (conservative, moderate, and radical) and physicochemical properties of the positively selected sites detected in the result of FUBAR and MEME were identified using the modified MM01 model implemented in TreeSAAP v3.2 (40). Eight categories (1-8) were used to represent the magnitude of substitutions, by setting a sliding window of 20 codons and analysing the properties of 31 amino acids (41). Significant positive z-scores (P < 0.001) were accepted as a signal of significant change in function and/or structure.
RESULTS
Basic sequence statistics
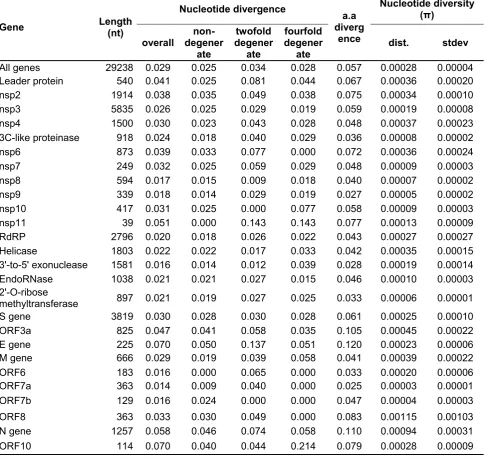
The final length of the sequences of human SARS-CoV-2 was 29,238 nt (without outgroups), of which 832 sites were variable. Of these variable sites, 232 were parsimony informative while 600 were singleton mutations. Divergence indices for both nucleotide (29,238 nt) and amino acid sequences of concatenated dataset (9,746 aa) on average were 0.029 and 0.057, respectively (Table 1). Divergences for each peptide encoding sequence were also in low levels ranging from 0.014 (nt div.) and 0.025 (aa div.) in orf7a to 0.070 (nt div.) and 0.120 (aa div.) in E gene. The low nucleotide diversity (π) values were observed in each peptide encoding sequences, ranging from 0.00005 in nsp9 to 0.00115 in orf8, with an average of 0.00028 overall mean nucleotide diversity (Table 1). Nucleotide compositions of the SARS-CoV-2 genomes were U and A rich, with 32.22% U, 29.82% A, 19.62% G, 18.34% C contents on average (Table S4).
The phylogenetic tree constructed to identify synapomorphies and the list of synapomorphic characters was shown in Figure S1 and Table S5, respectively. The ratio of synapomorphic characters to the total number of characters at the branch leading to bat-RaTG13-CoV (2.09%) was relatively higher than that of the branch leading to SARS-COV-2 (1.88%). The proportions of transitional substitutions (78.4% in bat-RaTG13-CoV and 78.9% in SARS-COV-2) within these synapomorphic characters were apparently higher than transversions (21.6% in bat-RaTG13-CoV and 21.1% in SARS-COV-2) at both branches. Although transitions and transversions dispersed similarly throughout the genomes (Fig. 1a), the distribution of transition- and transversion-types exhibited differences (Fig. 1b and 1c). Remarkably, A to G and U to C transitions were observed in high frequencies of 63.03% in bat-RaTG13-CoV and 64.87% in SARS-CoV-2 on average of total transitions (Fig. 1b). The synonymous substitutions (SS) were proportionally higher (85.38% in bat-RaTG13-CoV and 85.12% in SARS-COV-2) than nonsynonymous substitutions (NS) (14.62% in bat-RaTG13-CoV and 14.88% in SARS-COV-2) at both branches (Fig. 1d). The peptide encoding sequences with the highest proportion of both SS and NS were nsp3 (18.70% SS; 39.08% NS in bat-RaTG13-CoV and 20.68% SS; 39.02% NS in SARS-COV-2) and S gene (23.62% SS; 20.69% NS in bat-RaTG13-CoV and 22.60% SS; 19.51% NS in SARS-COV-2). The seven peptide encoding sequences (nsp7-11, E gene and orf6) have not contained any NS at both branches.
Phylogeny of SARS-CoV-2
information on the first transmission routes of the SARS-CoV-2. The subclade B2 consisting of samples worldwide indicating multiple independent transmission events from China. The samples from Europe formed the most recent crown cluster of subclade B2.
The MJ network revealed that the outgroup bat-RaTG13-CoV sample was connected to the sample from Guangdong (EPI_ISL_413892) with 1132 mutations, which has basal placement also in the phylogenetic tree (Fig. 3). The putative ancestral form can be distinguished from the samples of USA (EPI_ISL_404895) and Guangdong (EPI_ISL_413865) with the occurrence of two mutations in S gene: the nonsynonymous mutation U21619C changing a leucine to a serine and the synonymous mutation U24290C. The other samples with basal placements in the tree (EPI_ISL_413855, _408478, _408487) was also found to be derived from these samples in the network. Similar to the phylogenetic inference, the network indicated an evidence of two evolutionary transmission paths (Fig. 3): (i) from EPI_ISL_413557 (USA) to EPI_ISL_415593 (USA) corresponding to basal samples of the clade A with occurrence of two nonsynonymous mutations in the sequence encoding helicase (C17654U replacing a proline to a leucine and A17765G replacing a tyrosine to a cysteine); (ii) from _406801 (Wuhan) to the samples forming the clade B with occurrence of one synonymous mutation U17967C in the sequence encoding 3'- to- 5' exonuclease.
Demographic dynamics of the outbreak of SARS-CoV-2
Median estimation of tMRCA from Bayesian coalescent analyses was found as 2019.69 (95% HPD = 2019.54 – 2019.83), corresponding to 10 September 2019 (95% HPD: 19 July 2019 – 30 October 2019) (Fig. 4). Independent from any epidemiological information, the exponential growth rate (r) from demographic analyses of the genome data were inferred as 47.43 per year (95% HPD = 36.72 – 66.88 per year). Based on the growth rate, the Td of the virus was calculated as 5.39 days (95% HPD = 3.82 – 6.96 days). The R0 was estimated to be 2.72 (2.33 - 3.43).
Estimation of substitution rate
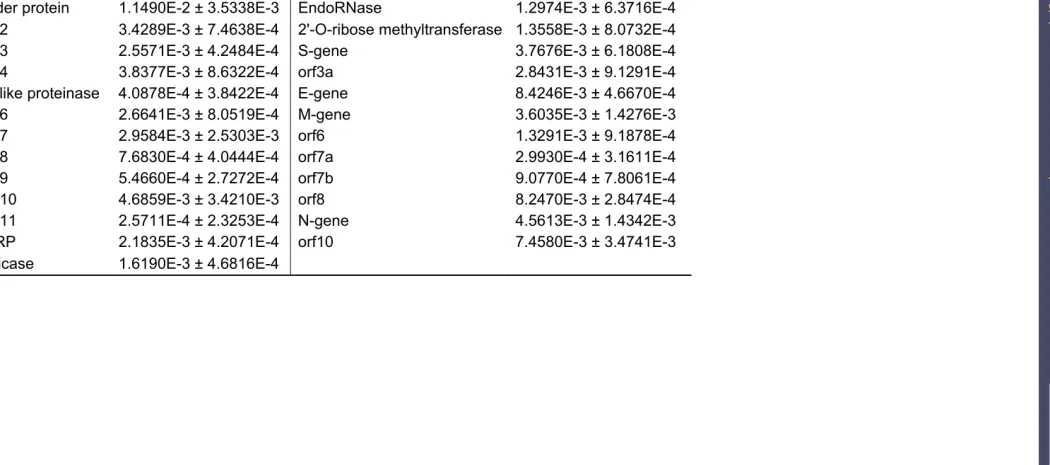
The total substitution rate of SARS-CoV-2 was estimated to be 1.65 x 10⁻³ per site per year (s/s/y) (95% HPD = 1.44 – 1.88 x 10⁻³) (Table 2). The estimated substitution rates of SARS-CoV-2 exhibited considerable variation between peptide encoding sequences, ranging between 9.08 x 10⁻⁴ s/s/y (95% HPD = 3.22 x 10⁻⁵ - 2.40 x 10⁻³) in orf7b and 1.15 x 10⁻² s/s/y (95% HPD = 5.11 x 10⁻³ – 1.88 x 10⁻²) in leader protein (Table 2). The sequences encoding structural proteins displayed higher substitution rates than overall genome, varying from 3.60 x 10⁻³ in M gene to 8.42 x 10⁻³ in E gene (Table 2).
Gene-level selection analyses
be under positive selection (dN > dS) with significant statistical support (Fig. 5, Table 3). Five sites were detected under episodic positive selection in four peptide encoding sequences by MEME, while seven sites were found to be under pervasive positive selection in four peptide encoding sequences by FUBAR (Table 3). Only two codons in two different peptide encoding sequences (nsp3 and nsp6) were found as positively selected in both tests, therefore, the TreeSAAP analyses focused only on these two codons. The first one was codon 1179 in the nucleic acid-binding region (NAB) of the replicase protein nsp3, leading to a replacement between alanine and valine. This substitution seems to alter both chemical [long-range non-bonded energy (EI), polar requirement (Pr), polarity (p) and solvent accessible reduction ratio
(Rα)] and structural [beta structure tendency (Pβ), average number of surrounding residues (Ns)] properties of the relevant protein (Table 3). The second one was codon 38 in the replicase
protein nsp6, with the substitution of leucine to phenylalanine altering the property of Pβ of the protein.
DISCUSSION
A strict phylogenetic approach was applied to reveal the differences in mutational patterns on the base of molecular synapomorphic changes that defining SARS-CoV-2 and its known closest relative bat-RaTG13-CoV branches as probably being a crucial preliminary step for the therapeutic studies. A several pattern common for both branches was found (Fig. 1): (i) the numbers of transitional and synonymous mutations were always higher than those of transversional and nonsynonymous mutations; (ii) the number of these mutations displayed similar distribution for each peptide encoding sequences, but transition- and transversion-types were apparently branch specific; (iii) the highest number of synonymous and nonsynonymous mutations found in nsp3 and S gene. The further investigations on the transition-type mutations pointed out the excessive number of “A to G” and “U to C” transitions, which is a commonly observed pattern in retroviral and other RNA genomes (45), that might be related to deamination of adenine to hypoxanthine and thermodynamically in favour of hypoxanthine cytosine matches. The numerous mutations observed in nsp3 and S gene may be related to their essential functions in viral RNA synthesis/inactivation of host innate immune signals and viral entry to host cell (46–48), suggesting potential sites to be considered for vaccine and/or drug developments. These findings require further investigation to understand the effects of this mutation pattern in protein level, which may provide valuable information on how SARS-CoV-2 increased its infectiousness and virulence.
The phylogenetic tree and MJ network, by including higher number of samples some from previously unsampled countries, obtained here (Figs. 2 and 3) were largely in congruence with some of the recent publications (7, 37) but contradicts to some others (38-40)], and provided reliable evidence on the origin place and transmission routes of the SARS-CoV-2. Although Wuhan province of China has been reported as origin place of SARS-CoV-2 (e.g. 49, 50), the phylogeny and network strongly suggested that the virus samples from Guangdong province forms the ancestral branches (Figs. 2 and 3). Wuhan has been widely cited as origin place for the official first case report (10), and possibly biased phylogenetic reconstructions either due to absence of samples from Guangdong in the data sets (10) or phylogenetic trees constrained by Wuhan as outgroup [e.g. (51, 52)]. The Guangdong province is known as the largest import and export centre in China, where SARS was also first emerged and caused a global epidemic in 2003 (53). Besides, not all reported early cases were Wuhan’s wet market related (54) and a potential intermediate host Malayan pangolins (Manis javanica) were illegally traded in Southern China, particularly in Guangdong province (14). These evidences implicitly support the hypothesis that SARS-CoV-2 originated from Guangdong, not Wuhan.
demographic history of the outbreak require utilization of comprehensive genome datasets. In present study demographic dynamics of SARS-CoV-2 such as the growth rate, doubling time and basic reproduction number were estimated for the first time using genome data and are consistent with the previously reported epidemic estimations (3 and reference therein, 44–47). It is also worthwhile to note a decline was observed in the basic reproduction number, the R0,
a reference parameter for pathogeny of the agent. Although there has been several reports exceeding approximately R0 > 6, the number estimated here, (R0 = 2.72) is amongst the lowest (11) possibly because of the preventive measures taken worldwide. Therefore, it is recommended that measures must be persistent and strongly implemented so that until the declining tendency in R0 becomes perpetual.
Accurate estimation of nucleotide substitution rates has crucial importance for several aspects, but two are especially essential. First, tracing evolutionary paths of the virus via substitution rate and mutational spectra may help to understand alterations in viral fitness as respond to host immune system on virus genes/genotypes and thus virulence in the host (60). Second, such results may have important implications for development of vaccines, antibodies and/or drugs (61, 62). The estimated substitution rate for total genome of SARS-CoV-2 (Table 2) falls within the range reported for earlier coronaviruses (62) and RNA viruses (7). It is in accordance with the estimations of Bai et al. (15) (1.60 x 10⁻³ s/s/y), lower than that of Giovanetti et al. (18) and Benvenuto et al. (16) (6.58 × 10⁻³ s/s/y), and higher than that of A. Rambaut (http://virological.org/t/phylodynamic-analysis-176-genomes-6-mar-2020/356) (0.80 x 10⁻³ s/s/y). However, substitution rate estimations for total genomes are very general and do not provide much information for individual peptide encoding sequences/genes as the rates per gene show a considerable variation. Nevertheless, if this rate of mutation (3.5 to 4.6) persists over the time, approximately four new mutations will occur per month adding a considerable amount of genetic variations in viral gene pool. Non-structural, structural and accessory proteins of the virus serve in penetration to host cell, in replication of viral genome and in constitution of viral particles interacting with each other (20–23). All these functions cause several effects on host cells, consequently determining patogenity, virulence, and antigens and finally the immune response (23). Therefore, the accurate estimation of substitution rate per gene has special importance for medical preventions and treatments.
2) higher than the overall rate in N, nsp4, S, M and nsp2. The high rate in N, S and M genes encoding three of total four structural proteins has special importance as key viral antigens (20), thus requiring close scrutiny in future particularly for vaccines studies. On the other hand, the substitution rate of nsp11, orf7a, nsp5, nsp9, nsp8, orf7b and nsp15 is considerably lower than the overall rate (Table 2), polypeptide products of each peptide encoding sequence have key functions both in viral replication and viral interaction with host cell, thus host immunity (21–23). For example, the peptide encoding nsp15 is termed as “suicide enzyme” (23) and new deleterious mutations in this peptide may be public wish, but results obtained here are not promising towards that direction. A similarly case is valid for orf7a as it has several significant functions in interaction with host immune system. Evaluation of the substitution rate in relation with function of each peptide encoding sequence is beyond scope of the present study. However, the conserved sequences of nsp8, nsp9 and nsp11, protein products of which have key importance in viral replication (23) may indicate a selective processes preventing accumulation of mutation in these peptide encoding sequences (63) and this constitutes an important question for further detailed research.
As for the overall substitution rate, the selective pattern on total genome also provides general information and do not allow us to distinguish key evolutionary trend. Although the SARS-CoV-2 genomes have been evolving under nearly neutral or purifying selection, one codon for each of nsp3 and nsp6 encoding sequences were found to be positively selected (Table 3). These positively selected codons may enhance the function of replicase proteins. The positively selected codon in nsp3 was reported for the first time and codes threonine in pangolin CoV and serine in BetaCoV England 1. Considering the multiple interactions of NAB with other non-structural proteins such as nsp2, nsp5, orf3a as well as other domains of nsp3 (48), this substitution seems to be significant due to altering both chemical and structural features of the involved protein. The nsp6 was located at the endoplasmic reticulum (ER) generating autophagosomes (64), has the positively selected substitution of leucine to phenylalanine and indicated a signal of structural change in the protein. This was also reported by Benvenuto et al. (65) and it appears to be variable in other coronaviruses as valine, isoleucine and leucine (64).
preventive actions taken worldwide and must be maintained. Finally, investigating more comprehensive genome data improves robustness and also enhances understanding of the demographic history of the outbreak. However, there is still a long way to go in order to better understand the SARS-CoV-2 and its outbreak.
ACKNOWLEDGEMENTS
This study is dedicated to all healthcare staff and scientists for their diligence and hard work during this SARS-CoV-2 outbreak. We are grateful to the authors and originating and submitting laboratories of the sequences from GISAID’s EpiCOVTM Database. The bioinformatics analyses were partially performed at TUBITAK ULAKBIM, High Performance and Grid Computing Center (TRUBA resources). We are indebted to Dr. Robert Belshaw (University of Plymouth, United Kingdom) for his critical reading and valuable comments on the early version of the manuscript. We also thank to Helin Çıplak Palabıyık (Wodern, İstanbul, Turkey) for designing the Figure 2.
REFERENCES
1. J. Van Bavel, The world population explosion: causes, backgrounds and -projections for the future. Facts, Views Vis. ObGyn5, 281–291 (2013).
2. S. Cleaveland, D. T. Haydon, L. Taylor, “Overviews of pathogen emergence: Which pathogens emerge, when and why?” in Wildlife and Emerging Zoonotic Diseases: The
Biology, Circumstances and Consequences of Cross-Species Transmission, J. E.
Childs, J. S. Mackenzie, J. . Richt, Eds. (Current Topics in Microbiology and Immunology,Vol. 315, Springer, 2007), pp. 85–111.
3. R. Carrasco-Hernandez, R. Jácome, Y. López Vidal, S. Ponce de León, Are RNA viruses candidate agents for the next global pandemic? A review. ILAR J.58, 343–358 (2017).
4. M. E. J. Woolhouse, L. Brierley, C. McCaffery, S. Lycett, Assessing the epidemic potential of RNA and DNA viruses. Emerg. Infect. Dis.22, 2037–2044 (2016).
5. K. E. Jones, et al., Global trends in emerging infectious diseases. Nature451, 990–993 (2008).
6. P. T. Dolan, Z. J. Whitfield, R. Andino, Mapping the evolutionary potential of RNA viruses. Cell Host Microbe23, 435–446 (2018).
7. S. Duffy, Why are RNA virus mutation rates so damn high? PLOS Biol. 16, e3000003 (2018).
8. S. Kumar, S. Subramanian, Mutation rates in mammalian genomes. Proc. Natl. Acad. Sci.99, 803–808 (2002).
(2020).
10. P. Zhou, et al., A pneumonia outbreak associated with a new coronavirus of probable bat origin. Nature579, 270–273 (2020).
11. D. Wu, T. Wu, Q. Liu, Z. Yang, The SARS-CoV-2 outbreak: What we know. Int. J. Infect. Dis.94, 44–48 (2020).
12. C. Yin, Genotyping coronavirus SARS-CoV-2: methods and implications. Genomics
(2020) https:/doi.org/10.1016/j.ygeno.2020.04.016.
13. K. G. Andersen, A. Rambaut, W. I. Lipkin, E. C. Holmes, R. F. Garry, The proximal origin of SARS-CoV-2. Nat. Med.26, 450–452 (2020).
14. K. Xiao, et al., Isolation of SARS-CoV-2-related coronavirus from Malayan pangolins.
Nature (2020) https:/doi.org/10.1038/s41586-020-2313-x.
15. Y. Bai, et al., Evolution and molecular characteristics of SARS-CoV-2 genome. bioRxiv
(2020) https:/doi.org/10.1101/2020.04.24.058933.
16. D. Benvenuto, et al., The global spread of 2019-nCoV: a molecular evolutionary analysis. Pathog. Glob. Health114, 64–67 (2020).
17. A. Lai, A. Bergna, C. Acciarri, M. Galli, G. Zehender, Early phylogenetic estimate of the effective reproduction number of SARS CoV 2. J. Med. Virol.92, 675–679 (2020). 18. M. Giovanetti, D. Benvenuto, S. Angeletti, M. Ciccozzi, The first two cases of 2019
nCoV in Italy: Where they come from? J. Med. Virol.92, 518–521 (2020).
19. B. Bhattacharjee, B. Pandit, Phylogenetic clustering of the Indian SARS-CoV-2 genomes reveals the presence of distinct clades of viral haplotypes among states.
bioRxiv (2020) https:/doi.org/10.1101/2020.05.28.122143.
20. L. Liu, Leader sequences of coronavirus are altered during infection. Front. Biosci.23, 4579 (2018).
21. Y.-J. Tan, S. G. Lim, W. Hong, Understanding the accessory viral proteins unique to the severe acute respiratory syndrome (SARS) coronavirus. Antiviral Res. 72, 78–88 (2006).
22. R. McBride, B. Fielding, The role of severe acute respiratory syndrome (SARS)-coronavirus accessory proteins in virus pathogenesis. Viruses4, 2902–2923 (2012). 23. E. J. Snijder, E. Decroly, J. Ziebuhr, The nonstructural proteins directing coronavirus
RNA synthesis and processing. Adv. Virus Res.96, 59–126 (2016).
24. M. Kearse, et al., Geneious Basic: an integrated and extendable desktop software platform for the organization and analysis of sequence data. Bioinformatics28, 1647–9 (2012).
25. K. Katoh, D. M. Standley, MAFFT multiple sequence alignment software version 7: improvements in performance and usability. Mol. Biol. Evol.30, 772–80 (2013).
genetics analysis across computing platforms. Mol. Biol. Evol.35, 1547–1549 (2018). 27. D. L. Swofford, PAUP. Phylogenetic analysis using parsimony (and other methods).
Version 4. Sinauer Assoc. Sunderland, Massachusetts., 294–307 (2002).
28. D. Darriba, et al., ModelTest-NG: A new and scalable tool for the selection of DNA and protein evolutionary models. Mol. Biol. Evol.37, 291–294 (2020).
29. A. Stamatakis, RAxML version 8: A tool for phylogenetic analysis and post-analysis of large phylogenies. Bioinformatics30, 1312–1313 (2014).
30. H. J. Bandelt, P. Forster, A. Röhl, Median-joining networks for inferring intraspecific
phylogenies. Mol. Biol. Evol. (1999)
https:/doi.org/10.1093/oxfordjournals.molbev.a026036.
31. G. Vaidya, D. J. Lohman, R. Meier, SequenceMatrix: Concatenation software for the fast assembly of multi-gene datasets with character set and codon information.
Cladistics27, 171–180 (2011).
32. A. J. Drummond, M. A. Suchard, D. Xie, A. Rambaut, Bayesian Phylogenetics with BEAUti and the BEAST 1.7. Mol. Biol. Evol.29, 1969–1973 (2012).
33. M. A. Miller, W. Pfeiffer, T. Schwartz, The CIPRES science gateway in Proceedings of the 1st Conference of the Extreme Science and Engineering Discovery Environment on
Bridging from the EXtreme to the Campus and beyond - XSEDE ’12, (ACM Press,
2012), p. 1.
34. E. Vynnycky, R. G. White, An introduction to infectious disease modelling (Oxford: Oxford University Press, 2010).
35. R. M. Anderson, R. M. May, Infectious diseases of humans: Dynamics and control (OUP Oxford, 1992).
36. A. W. Byrne, et al., Inferred duration of infectious period of SARS-CoV-2: rapid scoping review and analysis of available evidence for asymptomatic and symptomatic COVID-19 cases. MedRxiv (2020) https:/doi.org/10.1101/2020.04.25.20079889.
37. B. Murrell, et al., FUBAR: a fast, unconstrained bayesian appRoximation for inferring selection. Mol. Biol. Evol.30, 1196–1205 (2013).
38. B. Murrell, et al., Detecting individual sites subject to episodic diversifying selection.
PLoS Genet.8 (2012).
39. S. L. Kosakovsky Pond, S. D. W. Frost, S. V. Muse, HyPhy: Hypothesis testing using phylogenies. Bioinformatics21, 676–679 (2005).
40. S. Woolley, J. Johnson, M. J. Smith, K. A. Crandall, D. A. McClellan, TreeSAAP: Selection on Amino Acid Properties using phylogenetic trees. Bioinformatics19, 671– 672 (2003).
917–925 (2001).
42. M. Holder, P. O. Lewis, Phylogeny estimation: Traditional and Bayesian approaches.
Nat. Rev. Genet.4, 275–284 (2003).
43. T. Gojobori, E. N. Moriyama, M. Kimura, Molecular clock of viral evolution, and the neutral theory. Proc. Natl. Acad. Sci.87, 10015–10018 (1990).
44. B. Berkhout, F. van Hemert, On the biased nucleotide composition of the human coronavirus RNA genome. Virus Res.202, 41–47 (2015).
45. M. R. Valentine, J. Termini, Kinetics of formation of hypoxanthine containing base pairs by HIV-RT: RNA template effects on the base substitution frequencies. Nucleic Acids Res.29, 1191–1199 (2001).
46. S. Angeletti, et al., COVID-2019: The role of the nsp2 and nsp3 in its pathogenesis. J.
Med. Virol.92, 584–588 (2020).
47. V. Armijos-Jaramillo, J. Yeager, C. Muslin, Y. Perez-Castillo, SARS-CoV-2, an evolutionary perspective of interaction with human ACE2 reveals undiscovered amino acids necessary for complex stability. Evol. Appl.00, 1–11 (2020).
48. P. Serrano, et al., Nuclear magnetic resonance structure of the nucleic acid-binding domain of severe acute respiratory syndrome coronavirus nonstructural protein 3. J.
Virol.83, 12998–13008 (2009).
49. Y.-R. Guo, et al., The origin, transmission and clinical therapies on coronavirus disease 2019 (COVID-19) outbreak – an update on the status. Mil. Med. Res.7, 11 (2020). 50. F. Wu, et al., A new coronavirus associated with human respiratory disease in China.
Nature579, 265–269 (2020).
51. P. Forster, L. Forster, C. Renfrew, M. Forster, Phylogenetic network analysis of SARS-CoV-2 genomes. Proc. Natl. Acad. Sci.117, 9241–9243 (2020).
52. M. A. Shereen, S. Khan, A. Kazmi, N. Bashir, R. Siddique, COVID-19 infection: Origin, transmission, and characteristics of human coronaviruses. J. Adv. Res. 24, 91–98 (2020).
53. The Chinese SARS Molecular Epidemiology Consortium, Molecular evolution of the SARS coronavirus during the course of the SARS epidemic in China. Science (80-. ).
303, 1666–1669 (2004).
54. Y.-Z. Zhang, E. C. Holmes, A genomic perspective on the origin and emergence of SARS-CoV-2. Cell181, 223–227 (2020).
55. C. Huang, et al., Clinical features of patients infected with 2019 novel coronavirus in Wuhan, China. Lancet395, 497–506 (2020).
56. L. Ferretti, et al., Quantifying SARS-CoV-2 transmission suggests epidemic control with digital contact tracing. Science (80-. )., eabb6936 (2020).
curve and transmission parameters in mainland China: a modelling study. Lancet Public
Heal. (2020) https:/doi.org/10.1016/S2468-2667(20)30089-X.
58. S. Sanche, et al., High contagiousness and rapid spread of severe acute respiratory syndrome coronavirus 2. Emerg. Infect. Dis.26 (2020).
59. K. Mizumoto, K. Kagaya, G. Chowell, Early epidemiological assessment of the transmission potential and virulence of coronavirus disease 2019 (COVID-19) in Wuhan
City: China, January-February, 2020. MedRxiv (2020)
https:/doi.org/10.1101/2020.02.12.20022434.this.
60. M. Vignuzzi, J. K. Stone, J. J. Arnold, C. E. Cameron, R. Andino, Quasispecies diversity determines pathogenesis through cooperative interactions in a viral population. Nature
439, 344–348 (2006).
61. R. Sanjuán, M. R. Nebot, N. Chirico, L. M. Mansky, R. Belshaw, Viral mutation rates. J.
Virol.84, 9733–9748 (2010).
62. Z. Zhao, et al., Moderate mutation rate in the SARS coronavirus genome and its implications. BMC Evol. Biol.4, 21 (2004).
63. S. Srinivasan, et al., Structural genomics of SARS-CoV-2 indicates evolutionary conserved functional regions of viral proteins. Viruses12, 360 (2020).
64. S. Baliji, S. A. Cammer, B. Sobral, S. C. Baker, Detection of nonstructural protein 6 in murine coronavirus-infected cells and analysis of the transmembrane topology by using bioinformatics and molecular approaches. J. Virol.83, 6957–6962 (2009).
Figure and Table Legends
Figure 1. The substitution types and distribution patterns of synapomorphic base changes defining the clades (or branches) of human SARS-CoV-2 and bat-RaTG13-CoV. a) The distribution graph of transitions and transversions throughout the genomes, b) the number of transition-type differences (GA, AG, CT, TC), c) the number of transversion-type differences (CA, AC, TG, GT, AT, TA, GC, CG), d) the distribution graph of synonymous and nonsynonymous changes throughout the genomes
Figure 2. Phylogenetic tree of SARS-CoV-2 reconstructed from the concatenated dataset of all peptide encoding sequences using Bayesian Inference. Posterior probability support to main clades/subclades are shown. Coloured branches refer to geographic locations: China (blue), America (red), Asia (orange), Europe (green), Australia (pink), Africa (cyan). The sample of bat-RaTG13-CoV was used as outgroup.
Figure 3. Median-joining network constructed using whole genome dataset of 25 SARS-CoV-2 and bat-RaTG13-CoV samples. A detailed explanation on the information about samples was given in Table S2. The marked colours: cyan (Guangdong Province), lilac (Wuhan Province), blue (other Chinese samples), red (America), brown (Asia). The length of links was proportional to the number of mutated nucleotide positions between two circles and open circles indicate hypothetic missing haplotypes.
Figure 4. Median estimation of tMRCA of SARS-CoV-2 inferred from Bayesian coalescent model using demographic reconstruction option. The dataset was derived from an alignment of all peptide encoding sequences of 821 SARS-CoV-2 samples. An exponentially growing population rate mode of demography and a GTR + G model of substitution were assumed. The x axis is given as units of years, and the y axis is equal to the product of the effective population size. The bold dashed line is the median estimate, and the thick dashed lines display the 95% HPD limits (see text for details).
Table 1. Basic statistics of each peptide encoding sequences (10 CDS and 16 nsps synthesised from orf1ab) and overall genome of SARS-CoV-2.
Table 2. The substitution rate estimations of each peptide encoding sequences (10 CDS and 16 nsps synthesised from orf1ab) and overall genome based on the available dates for samples using an uncorrelated relaxed molecular clock model with an exponentially growing population in BEAST, mean values ± standard deviations.
Table 1.
Gene Length (nt)
Nucleotide divergence a.a
diverg ence
Nucleotide diversity (π)
overall degener non-ate
twofold degener
ate
fourfold degener
ate dist. stdev
All genes 29238 0.029 0.025 0.034 0.028 0.057 0.00028 0.00004
Leader protein 540 0.041 0.025 0.081 0.044 0.067 0.00036 0.00020
nsp2 1914 0.038 0.035 0.049 0.038 0.075 0.00034 0.00010
nsp3 5835 0.026 0.025 0.029 0.019 0.059 0.00019 0.00008
nsp4 1500 0.030 0.023 0.043 0.028 0.048 0.00037 0.00023
3C-like proteinase 918 0.024 0.018 0.040 0.029 0.036 0.00008 0.00002
nsp6 873 0.039 0.033 0.077 0.000 0.072 0.00036 0.00024
nsp7 249 0.032 0.025 0.059 0.029 0.048 0.00009 0.00003
nsp8 594 0.017 0.015 0.009 0.018 0.040 0.00007 0.00002
nsp9 339 0.018 0.014 0.029 0.019 0.027 0.00005 0.00002
nsp10 417 0.031 0.025 0.000 0.077 0.058 0.00009 0.00003
nsp11 39 0.051 0.000 0.143 0.143 0.077 0.00013 0.00009
RdRP 2796 0.020 0.018 0.026 0.022 0.043 0.00027 0.00027
Helicase 1803 0.022 0.022 0.017 0.033 0.042 0.00035 0.00015
3'-to-5' exonuclease 1581 0.016 0.014 0.012 0.039 0.028 0.00019 0.00014
EndoRNase 1038 0.021 0.021 0.027 0.015 0.046 0.00010 0.00003
2'-O-ribose
methyltransferase 897 0.021 0.019 0.027 0.025 0.033 0.00006 0.00001
S gene 3819 0.030 0.028 0.030 0.028 0.061 0.00025 0.00010
ORF3a 825 0.047 0.041 0.058 0.035 0.105 0.00045 0.00022
E gene 225 0.070 0.050 0.137 0.051 0.120 0.00023 0.00006
M gene 666 0.029 0.019 0.039 0.058 0.041 0.00039 0.00022
ORF6 183 0.016 0.000 0.065 0.000 0.033 0.00020 0.00006
ORF7a 363 0.014 0.009 0.040 0.000 0.025 0.00003 0.00001
ORF7b 129 0.016 0.024 0.000 0.000 0.047 0.00004 0.00003
ORF8 363 0.033 0.030 0.049 0.000 0.083 0.00115 0.00103
N gene 1257 0.058 0.046 0.074 0.058 0.110 0.00094 0.00031
Table 2.
Gene Mean Rate Gene Mean Rate
Overall 1.6463E-3 ± 1.1729E-3 3'-to-5' exonuclease 1.7954E-3 ± 6.9984E-4 leader protein 1.1490E-2 ± 3.5338E-3 EndoRNase 1.2974E-3 ± 6.3716E-4 nsp2 3.4289E-3 ± 7.4638E-4 2'-O-ribose methyltransferase 1.3558E-3 ± 8.0732E-4 nsp3 2.5571E-3 ± 4.2484E-4 S-gene 3.7676E-3 ± 6.1808E-4 nsp4 3.8377E-3 ± 8.6322E-4 orf3a 2.8431E-3 ± 9.1291E-4 3C-like proteinase 4.0878E-4 ± 3.8422E-4 E-gene 8.4246E-3 ± 4.6670E-4 nsp6 2.6641E-3 ± 8.0519E-4 M-gene 3.6035E-3 ± 1.4276E-3 nsp7 2.9584E-3 ± 2.5303E-3 orf6 1.3291E-3 ± 9.1878E-4 nsp8 7.6830E-4 ± 4.0444E-4 orf7a 2.9930E-4 ± 3.1611E-4 nsp9 5.4660E-4 ± 2.7272E-4 orf7b 9.0770E-4 ± 7.8061E-4 nsp10 4.6859E-3 ± 3.4210E-3 orf8 8.2470E-3 ± 2.8474E-4 nsp11 2.5711E-4 ± 2.3253E-4 N-gene 4.5613E-3 ± 1.4342E-3 RdRP 2.1835E-3 ± 4.2071E-4 orf10 7.4580E-3 ± 3.4741E-3 Helicase 1.6190E-3 ± 4.6816E-4
Table 3.
Gene MEME (P ≤ 0.5) FUBAR (P ≤ 0.5)
Leader
protein 31 -
nsp3 1179 1179
nsp6 38 4. 38. 154. 157
RdRP - 323
S gene 860. 861 -
N gene - 24
Gene Codon Exchange
Property and category of the change (P ≤ 0.001)
Average number of surrounding
residues
Beta-structure tendencies
Long-range non-bonded
energy
Polar requirement
Polarit y
Solvent accessible
reduction ratio
nsp3 1179 A↔V 5 6 5 2 3 5
nsp6 38 L→F - 1 - - - -
5'UTR
Leader protein
nsp2 nsp3 nsp4
3C
−
lik
e proteinase
nsp6 nsp7 nsp8 nsp9 nsp10 nsp11
ORF1ab stem loop1 ORF1ab stem loop2
RdRP Helicase 3' − to − 5' e xon uclease EndoRNase 2' − O − ribose meth yltr ansf er ase
S gene ORF3a E gene M gene ORF6 ORF7a ORF7b ORF8 N gene
ORF10 stem loop
ORF10 stem loop
Transversion
Human
Bat
0 20 40 60 80GA AG TC CT
Human Bat 0 50 100 150 200 250
CA AC TG GT AT TA GC CG
Human Bat 0 10 20 30 40 50
b)
c)
Human
Bat
Leader proteinnsp2 nsp3 nsp4
3C
−
lik
e proteinase
nsp6 nsp7 nsp8 nsp9 nsp10 nsp11 RdRP
Helicase 3' − to − 5' e xon uclease EndoRNase 2' − O − ribose meth yltr ansf er ase
S gene ORF3a E gene M gene ORF6 ORF7a ORF7b ORF8 N gene ORF10
proteinLeader nsp2 nsp3 nsp4 proteinase3C-like
nsp8
nsp6 nsp7 nsp9 nsp10
nsp11 RdRP Helicase exonuclease EndoRNase
3'-to-5'
Supplementary Files
Supplementary Figures
Figure S1. The phylogenetic tree reconstructed for defining synapomorphies at the clades (or branches) leading to human SARS-CoV-2 and bat-RaTG13-CoV. The sampling list used in the reconstruction of the tree was presented in Table S3.
Figure S2. Phylogenetic tree of SARS-CoV-2 reconstructed from the concatenated dataset of all peptide encoding sequences using Maximum Likelihood approach.
Supplementary Tables
Table S1. Detailed description of the sampling list retrieved from GISAID database. Table S2. A summary of the sampling list used the phylogenetic tree to define synapomorphies of the clades (or branches) leading to human SARS-CoV-2 and bat-RaTG13-CoV
Table S3. A summary of the sampling list used in the network reconstruction of SARS-CoV-2 Table S4. Nucleotide composition of each peptide encoding sequences (10 CDS and 16 nsps synthesised from orf1ab) and overall genome of SARS-CoV-2.
Table S5. The list of molecular characters that define the clades (or branches) of human SARS-CoV-2 and bat-RaTG13-CoV