specific ‘centre of pressure locator’
in chiropractic practice
David De Camillis,
DC, DACRB, FCCRS(C), DIP MDT*
Robin Carr,
PhD (Kinesiology)**
This study assessed the reliability and potential value of a specific Centre of Pressure Locator (COPL) for the initial diagnosis of spinal mal-alignments and for the measurement of change in weight distribution resulting from clinical intervention. Basic validation of the equipment with standard weights showed it to be very precise, reliable and accurate at noting changes in the position of the centre of pressure. Control subjects were used to develop interim norms for COP position and sway. R-L COP position among both controls and patients was found to be too variable to be a useful tool for diagnosis or for the measurement of the effects of intervention. However, the equipment shows promise for the measurement of A-P and R-L postural sway;
potentially important variables to consider within chiropractic practice.
(JCCA 2000; 44(4):209–222)
K E YW O R D S: chiropractic, rehabilitation, exercise.
La présente étude vise à évaluer la fiabilité et la valeur potentielle d’un localisateur du centre de gravité (CG) pour le diagnostic initial des défauts d’alignement de la colonne vertébrale et la mesure des changements dans la répartition du poids suite aux interventions cliniques. Des tests élémentaires de validation, réalisés à l’aide de poids standards ont révélé que le matériel est précis, fiable et exact pour ce qui est des changements de position du centre de gravité. Des sujets témoins ont servi à l’élaboration de normes provisoires sur la position et le déplacement du CG. Les écarts chez les patients pour que le matériel s’avère utile à la pose d’un diagnostic ou à la mesure des effets des interventions. Par contre, il se montre prometteur pour la mesure des déplacements posturaux antéro-postérieurs ou droite-gauche, deux variables
(JACC 2000; 44(4):209–222)
M O T S C L É S : chiropratique, réadaptation, exercices.
* 741 – 6th Street, New Westminister, B.C. V3L 3C6. (Member, Western Upper Cervical Society). ** Department of Human Performance, Langara College, Vancouver, B.C. V5Y 2Z6.
Requests for reprints. – David De Camillis, DC
741 – 6th Street, New Westminster, B.C. V3L 3C6. Phone (604) 522-5225. © JCCA 2000.
Introduction
During the last decade, some chiropractors (especially up-per cervical practitioners) have begun using postur-ography in their clinical practices, particularly with respect to the initial diagnosis of spinal mal-alignments, and for the measurement of alignment change resulting from clinical intervention. One method involves the use of a ‘Centre of Pressure Locator’ (COPL) developed by one of the authors (DDC). The underlying assumption is that a
spinal malalignment may result in a right-left weight dis-tribution imbalance that could be detected by this equip-ment. This study is an attempt to quantify the reliability and value of this approach.
Posturography involves the recording of postural
line from the body’s centre of gravity (COG), as well as its area of movement, over a given period of time. The X indicates lateral movement, while the Y involves antero-posterior movement. Stabilometry analyses the X and Y movements separately. Proposals have been made for the standardization of techniques.1
Force platforms can be used to estimate the COG2 and they have been applied in many studies as the criterion tool for quantifying body sway.3–9 Technically, they indicate the centre of pressure (COP) acting through the feet, which reflects not only the ground reaction force necessary to oppose gravity, but also the moments of force produced to maintain standing posture. Although the COP is only iden-tical to the veriden-tical line from the COG when there is no sway, over the period of a testing trial the mean COP should be a good representation of the mean COG.2,10
Force platforms are relatively simple to use, do not in-terfere with movement, and are not unpleasant or unsafe for subjects. They are quite expensive, however, and usu-ally have to be embedded in concrete. For these reasons, they are generally found only in universities, hospitals, or other large institutions of research. When the use of the criterion force platforms is not possible or practical, other force-plate type systems for evaluating weight distribution and sway have now become commercially available.
Roland et al. (1995)11 reported on the use of a relatively simple and economical load-sensitive platform (the SwayWeigh®) to measure lateral body sway in order to assess balance dysfunction. With it, the percentage of a patient’s total weight that was borne on the right foot ena-bled measurement of right-left weight distribution and lat-eral movement of the centre of gravity. They reported significant differences between “normals” and “patients” (of an otoneurology clinic), but they did not report the technical capabilities of the equipment in terms of preci-sion, reliability and accuracy. (Weerdt et al. (1989)12 had employed a similar platform to measure the rehabilitation of physiotherapy patients after cerebrovascular accidents.) Another device, and the focus of this study, is the ‘cen-tre of pressure locator’ (COPL). It was first developed by the author (DDC) in 1985 for use in his chiropractic prac-tice. Twenty-two more were subsequently built and are currently being used in other private practices and re-search facilities. The private practitioners who use the COPL claim it appears to be reliable and useful for their clinical purposes. The purpose of this study was to
inves-tigate these assumptions and to quantify the COPL’s characteristics.
Methods
The COPL consists of four strain gauge weigh scales at-tached in a square pattern to a plywood under-surface (see Figure 1). It is covered by two removable wooden plat-forms – one for the left side and one for the right. The scales are electronically linked to a cable that attaches to the parallel port of a computer, to provide an easy data capture system without the need for an analog-to-digital (A-D) interface board for the computer. Sampling fre-quency is fixed at 401 samples per trial, with a trial lasting approximately 15 seconds. A simple-to-use DOS-based program comes with the scale, and provides the monitor with a visual analog output estimating the location and movement of the subject’s centre of gravity in the horizon-tal plane.
Since standing posture involves anteroposterior, right-left, and up-down sway, the software provides an ‘ANALYSIS’ function showing the centre of pressure movement in all three planes. A ‘HISTORY’ function shows the entire pathway that the centre of gravity has followed in the horizontal plane over the sampling time. For each of the three planes, the ‘STATISTICS’ function calculates three statistics: the mean, the standard devia-tion, and the standard error.
The mean indicates the average location of the centre of pressure (COP) over the sampling period. The standard deviation indicates the variability of the position over time, and is therefore a measure of postural ‘sway’ in the given plane. (The weight standard deviation theoretically repre-sents the usually very small movement of the centre of gravity up and down as the person stands (i.e. ‘weighting’ and ‘unweighting’).) The standard error is calculated as the standard deviation divided by the square root of the number of samples per trial (i.e. 401 in each case).
The recommended clinical procedure for using the COPL is as follows:
1 the patient stands on the COPL for a preliminary test; 2 If a weight distribution asymmetry is present, and if
other diagnostics warrant it, the patient is adjusted and re-tested.
mid-point of the grid, with mean anteroposterior (A-P) and mean right-left (R-L) values close to zero and with weight distributed equally on forefoot and rearfoot, right and left. However, since the A-P values depend on foot positioning on the platform, the mean A-P location of the COP has little meaning unless foot positioning has been carefully controlled. R-L location of the COP is independent of foot placement, since the right and left feet are on separate platforms, and therefore it has greater potential usefulness as a measurement variable.
This study consisted of three phases:
1. Basic lab testing with standard weights
The purpose of this phase was to assess the technical capa-bilities of the COPL. The COPL was initially calibrated with a known weight according to on-line instructions. Five trials were recorded with no weight on the platform, and then five each with the following known weights (i.e. weightlifting disks combined to total 25, 45, 95, and 140 lb.) for a total of 25 trials. The default duration of each trial
Posterior
Anterior
Left
Right
Figure 1 Schematic representation of top view of the COPL. Relative positions of the four strain gauge weigh scales under the two wooden platforms are indicated by the dotted lines.
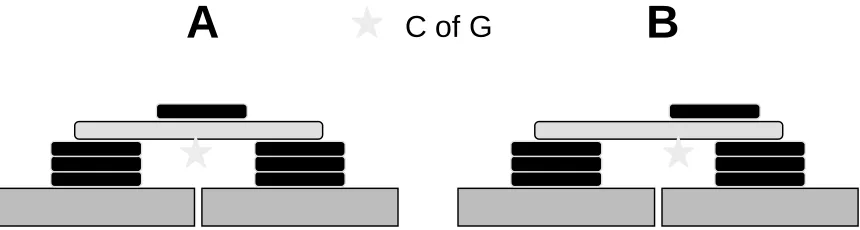
A
C of G
B
was about 15 seconds, with 401 samples being collected each trial. This translates to a sampling frequency of about 27 Hertz. The data gathered was used to determine noise, to establish intra-class reliability coefficients, and to as-sess precision and accuracy. The weights were also stacked in various configurations (both symmetrically and asymmetrically – see Figure 2) on a 1-meter plywood plank with a measurement scale on it, in order to assess the COPL’s ability to detect centre of gravity location.
2. Testing with ‘control’ subjects
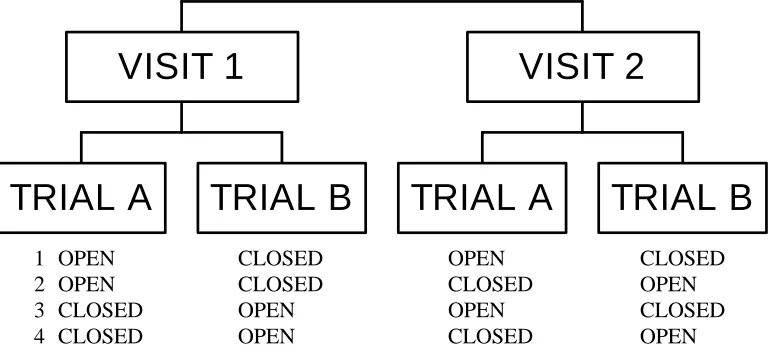
The purpose of this phase was to assess the performance of the COPL in measuring the position and involuntary move-ment of the COP of ‘control’ (asymptomatic) subjects, and to establish initial norms for standing with eyes open and with eyes closed. Thirty-one subjects (males and females aged 18–32, all students at Langara College in Vancouver, B.C.) read and signed informed consent forms and volun-teered to stand on the COPL for two trials on each of two visits to the lab, for a total of four trials per subject. Visits were kept one week apart. One of the trials during each visit involved standing with the eyes closed, while the other al-lowed the eyes to be open. The four possible orders for the four trials were randomly assigned, without replacement in each cycle, to all subjects (see Figure 3).
For the first trial of the first visit, each subject was asked to remove shoes and stand fully clothed on the COPL so that the feet were symmetrically but comfortably posi-tioned on a plastic grid taped to the platforms. The feet were then adjusted until the centre of pressure was centred
on the monitor display. These new foot positions were recorded and were used again for all subsequent trials. The subjects were instructed to look straight ahead and stand comfortably still.
The COPL software came with no documentation other than a limited on-line help file, and there was apparently no way of controlling sampling frequency. The default duration of the trials was again about 15 seconds, with 401 samples being collected each time.
3. Testing with ‘clinical’ chiropractic patients
The purpose of this phase was to examine the current use of the COPL in a single private ‘upper cervical’ chiroprac-tic pracchiroprac-tice, by measuring the pre- and post-adjustment COP positions and sway movements from a pool of 27 patients (males and females, 26 to 69 years of age) with varying symptoms. These were patients chosen by the chiropractor, who was not one of the authors of this study. Following an initial trial with eyes open, these patients underwent chiropractic adjustment. Nineteen were avail-able to be re-measured (eyes open again) on the COPL.
Results
Phase 1 – Basic lab testing with standard weights
Calibration
When first set up with the computer, the display cursor on the monitor (which indicates the centre of pressure) jumped between two non-centred positions, even though
TRIAL A
TRIAL B
VISIT 1
TRIAL A
TRIAL B
VISIT 2
1 OPEN CLOSED OPEN CLOSED
2 OPEN CLOSED CLOSED OPEN
3 CLOSED OPEN OPEN CLOSED
4 CLOSED OPEN CLOSED OPEN
no weight was on the platforms. The COPL was then cali-brated by following on-line instructions that involved re-moving the wooden platforms, placing a known weight sequentially on the four scales and pressing a key on the keyboard after each placement. The wooden platforms were then put back in position. This calibration procedure resulted in the monitor display cursor becoming centred.
Noise
Five trials were then recorded with no weight on the plat-form, and then five each with the following known weights (i.e. weightlifting disks combined to total 25, 45, 95, and 140 lb.) for a total of 25 trials. Based on the 401 samples collected on each trial, the standard deviation of the weight can be used to assess background noise. Table 1 shows the means and ranges of the five standard deviations calcu-lated for each known weight. Even using the light weight of 25 lb, the signal-to-noise ratio is a very high 93:1, and the noise did not increase as the weights became heavier. For each trial, at every weight, the standard error of the mean (i.e. the standard deviation divided by the square root of the number of samples) was a very small 0.01 lb. Similarly, the standard errors in the antero-posterior (A-P) and right-left (R-L) planes always recorded as 0.01 lb.
Reliability
A one-way ANOVA (5 trials for each weight) enabled calculation of a case one type intraclass correlation coeffi-cient (ICC)13 for the A-P Mean. ICC’s were also calcu-lated for A-P Standard Deviation, R-L Mean, R-L Standard Deviation, Weight Mean and Weight Standard Deviation (see Table 2). In all cases, the ICC’s exceeded 0.99.
In this case, using ICC’s alone to evaluate equipment reliability is inadequate, since the ICC’s can be artificially inflated just by increasing the range of the test weights used (thus increasing the ratio of the variance of interest to the variance of interest plus error).13 A measure of the precision of the equipment, in the actual units of measure-ment, is often a more informative tool.
Precision
The standard deviation and standard errors of the recorded mean weights for the five trials (at each weight level) were used as indicators of weight precision. Table 3 shows the high level of precision obtained at each weight.
The technical error of measurement was also used to assess precision. Effectively the standard deviation of re-peated measurements,14 it is given by the formula below:
Table 1
Noise Assessment: The mean and range (calculated over 5 trials) of the within-trial weight standard deviations show low system noise that does not increase as the weights get heavier.
Weight (lb.) Mean (lb.) of Weight Standard Deviations Range (lb.) of Weight Standard Deviations
0 .17 .17 - .18
25 .27 .22 - .29
45 .25 .23 - .27
95 .27 .22 - .29
140 .25 .23 - .27
Table 2
Reliability Assessment: The ICC’s for these six variables measured by the COPL exceeded 0.99 on repeated trials with the standard weights.
ICC A-P Mean ICC A-P S ICC R-L Mean ICC R-L S ICC Wt. Mean ICC Wt. S
TEM = (S d2 / 2n) 0.5
where d is the difference between two sets of measure-ments on n subjects. The units for the TEM are the same as the original measurements.
When calculated for the repeated measures with all weights, to derive a single value for precision, the TEM was 0.04 lb. As a percentage of the mean weight, that amounted to 0.05%. (The author (RC) had previously cal-culated a %TEM for a Kistler force platform at 1.12%, although that was based on motionless human subjects.)15
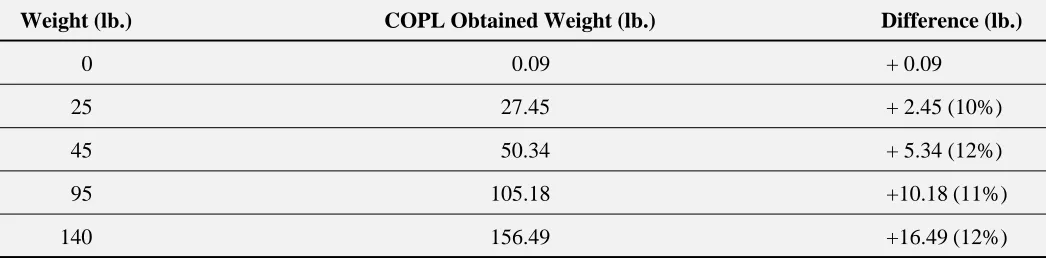
Accuracy
Although very precise, the absolute weight recorded by the COPL at each trial was relatively inaccurate, even after the calibration process. Table 4 shows the mean weights re-corded by the COPL versus the ‘true’ weights.
COP Location Sensitivity
When the stacked weights were moved from symmetrical to asymmetrical positions, the COPL was found to be ex-tremely sensitive to even slight changes in the A-P or R-L location of the centre of pressure. A single 35 pound (15.9 kg) weight registered different positions (A-P and R-L means) when it’s centre of gravity was moved as little as 2 mm in any direction. A single 25 pound weight, when moved 1 cm anterior and left, registered a change in posi-tions exceeding 15 standard errors (see Table 5).
Informal testing with the “History” function, which traces the pathway of the COP during a trial on a live subject, showed its ability to reproduce the general pat-terns of movement of the centre of mass when the subject made deliberate, even small, movements in any direction.
Phase 2 – Testing with ‘control’ subjects
Reliability and Precision with Human Subjects
Following the procedure described above, ICC’s were cal-culated for the six COPL variables (Table 6) for ‘eyes open’ and ‘eyes closed’. The reliabilities for all but the weight measures appear relatively low. However, as sug-gested above, ICC’s are measures of reliability that depend upon the variability of subjects.14 When variability is low, Table 3
Weight Precision Assessment: The standard deviations and standard errors of the mean weights were calculated across the five trials at
each weight level, to indicate precision at detecting absolute weight.
S and S.E. (in lb.) of Means Weight (lb.) Across Trials
0 0.03 (0.01)
25 0.04 (0.02)
45 0.04 (0.02)
95 0.04 (0.02)
140 0.02 (0.01)
Table 4
Weight Accuracy Assessment: The mean weight obtained by the COPL showed relatively large and increasing absolute error with increasing weights.
Weight (lb.) COPL Obtained Weight (lb.) Difference (lb.)
0 0.09 + 0.09
25 27.45 + 2.45 (10%)
45 50.34 + 5.34 (12%)
95 105.18 +10.18 (11%)
ICC’s may underestimate consistency. A measure of pre-cision, in the actual units of measurement, may provide a better assessment.
A good example of the need for a measure of precision is shown with weight standard deviation (i.e. weight sway) with eyes open, where the ICC was calculated as 0.00,
indicating no reliability. In fact, the variable was ex-tremely consistent, with a TEM of only 0.18 pounds. The low ICC was due to the fact that all subjects had low values for weight sway (i.e. 0.35 lb. – see Table 8) that were not much above the noise values (i.e. 0.27 lb. – see Table 1). Thus the ratio of the variance of interest to the variance of
Table 5
COPL Sensitivity Assessment: This shows the change in lb. readings when a 25 pound weight centred on the platform was moved one cm anterior and left. Standard errors are in brackets.
Position A-P Mean A-P S R-L Mean R-L S Wt. Mean Wt. S
centred -0.07 (0.01) 0.21 0.02 (0.01) 0.22 27.45 (0.01) 0.22
1 cm left & 0.09 0.20 -0.73 27.44 0.23
anterior (0.01) (0.01) 0.21 (0.01)
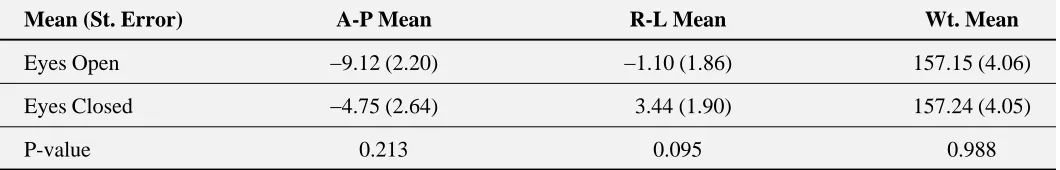
Table 7
Positions – Eyes Open and Closed: Among ‘controls’, no significant differences were found for A-P Mean, R-L Mean, and Weight Mean under ‘eyes open’ and ‘eyes closed’ conditions.
Mean (St. Error) A-P Mean R-L Mean Wt. Mean
Eyes Open -9.12 (2.20) -1.10 (1.86) 157.15 (4.06)
Eyes Closed -4.75 (2.64) 3.44 (1.90) 157.24 (4.05)
P-value 0.213 0.095 0.988
Table 6
Human Subject Reliability and Precision: ICC’s and TEM’s for controls under ‘eyes open’ and ‘eyes closed’ conditions.
Eyes Open Eyes Closed
Variable ICC TEM (lb.) ICC TEM (lb.)
A-P Mean 0.78 8.28 0.62 13.15
A-P Sway 0.19 1.48 0.57 1.72
R-L Mean 0.54 10.07 0.71 8.18
R-L Sway 0.01 2.90 0.75 1.23
Weight Mean 0.99 2.37 0.99 2.31
0.00 1.00 2.00 3.00 4.00 5.00 6.00
A-P(SD) R-L(SD) Vertical(SD)
Sway Plane
S
w
ay (l
b.
)
Open Closed
Figure 4 Comparison of sway in three planes. Differences between ‘eyes open’ and ‘eyes closed’ conditions were significant for A-P Sway (p < 0.001) and R-L Sway (p < 0.05).
Table 8
Sway – Eyes Open and Closed: Among ‘controls’, ‘eyes closed’ resulted in greater A-P sway ( p < 0.001) and R-L sway ( p < 0.05), but no difference in weight sway.
Mean (St. Error) A-P Sway R-L Sway Wt. Sway
Eyes Open 3.32 (0.20) 4.09 (0.36) 0.35 (0.02)
Eyes Closed 5.14 (0.33) 5.31 (0.31) 0.35 (0.01)
p-value 0.000 0.014 0.735
Table 9
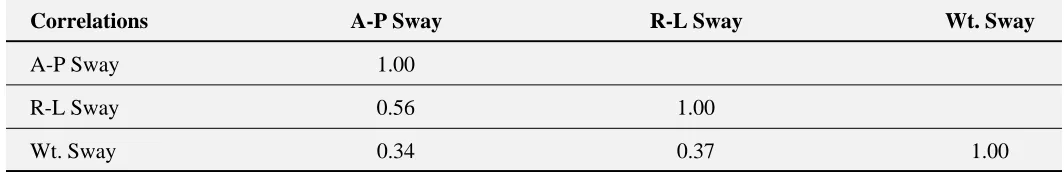
Correlation Matrix: This describes the significant relationships among A-P sway, R-L sway, and weight oscillation. Bonferroni probabilities for significance were all p < 0.001.
Correlations A-P Sway R-L Sway Wt. Sway
A-P Sway 1.00
R-L Sway 0.56 1.00
Wt. Sway 0.34 0.37 1.00
interest plus error was effectively zero. The ICC for the same variable with eyes closed was 1.00, because the be-tween trials error had diminished to near zero!
A-P Means, R-L Means, and Weight Means
These variables represent average positions of the centre of pressure (and generally the centre of gravity) in the antero-posterior and right-left planes, and average ground reaction force in the vertical plane. They are reported in Table 7.
Repeated measures ANOVAs showed no significant difference between ‘eyes open’ and ‘eyes closed’ condi-tions for the A-P Means or the R-L Means. Thus the
aver-age position was not affected by having the eyes open or
closed. And as should be expected, no significant differ-ence was found in the means of the Weight Means between ‘eyes open’ and ‘eyes closed’ sessions.
A-P, R-L and Weight Standard Deviations
These variables represent the amount of sway of the centre of pressure (and generally the centre of gravity) in the antero-posterior and right-left planes, and the oscillation of the ground reaction force in the vertical plane. They are reported in Table 8.
Repeated measures ANOVAs showed that the ‘eyes closed’ condition resulted in significantly more A-P sway (p < 0.001) and R-L sway (p < 0.05), but no significant difference in weight sway.
Figure 4 shows the A-P, R-L and Weight Standard De-viations (in pounds) under both ‘eyes open’ and ‘eyes closed’ conditions. It can be seen that R-L sway is greater than A-P sway with eyes open. With eyes closed, however, there is a bigger increase in A-P sway, almost equaling R-L sway. Closing the eyes had no effect on the very small weight sway.
Effects of Visits and Trials
The visit and trial numbers had no significant effects on any variables, suggesting that no accommodation or learn-ing was involved here.
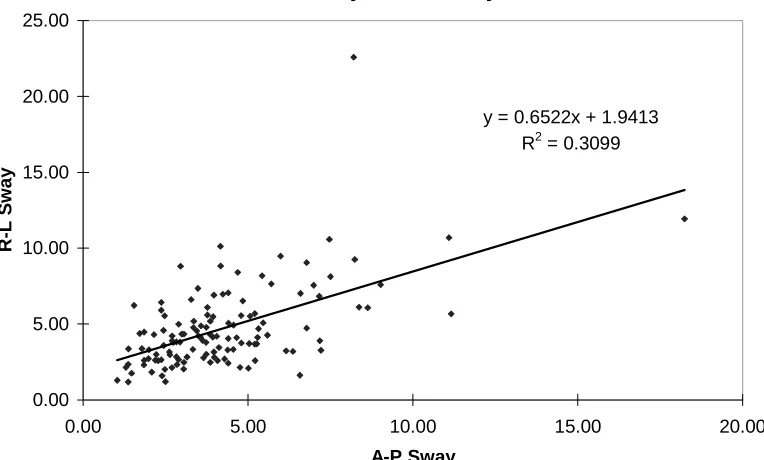
Correlations among Sway Directions
Somewhat small but clearly significant (p < 0.001) corre-lations were found among A-P sway, R-L sway, and weight oscillations, with the highest among them (r = 0.56, therefore r2 = 0.31) being found between A-P sway and R-L sway (calculated on the measurements taken on all sessions). Subjects in this study who have larger A-P sway
y = 0.6522x + 1.9413
R2 = 0.3099
0.00 5.00 10.00 15.00 20.00 25.00
0.00 5.00 10.00 15.00 20.00
A-P Sway
R-L S
w
ay
Figure 5 Scatterplot of A-P Sway versus R-L Sway (in pounds of force). Pearson r = 0.56.
Figure 6 ‘Controls’ versus ‘Clinicals’ as percentage of weight. ‘Clinicals’ had significantly ( p < 0.05) more R-L position asymmetry: on average they had more weight on the left foot. They also had significantly more weight sway in the vertical plane ( p < 0.001).
-6.00 -5.00 -4.00 -3.00 -2.00 -1.00 0.00 1.00 2.00 3.00
A-P Sway % R-L Position % R-L Sway % Wt. Sway %
% of Weight
Controls Clinicals
‘Controls’ vs. ‘Clinicals’ as % of Weight
Table 10
‘Clinicals’ vs. ‘Controls’: ‘Clinicals’ had greater asymmetry in COP position ( p < 0.05); in this study the bias was towards the left side. They also showed more vertical weight sway ( p < 0.001).
Mean
(St. Error) A-P Sway R-L Mean R-L Sway Wt. Sway
Clinicals 2.30 -5.10 2.16 0.53
(0.17) (1.67) (0.33) (0.03)
Controls 2.03 -0.26 2.38 0.21
(0.16) (1.56) (0.31) (0.03)
0 0.1 0.2 0.3 0.4 0.5 0.6 0.7 0.8 0.9
Wt. Disks Controls Clinicals
Weight
Sway (
lb.)
Figure 7 Mean weight sway (vertical) in pounds, with standard error bars. The weight disks represent floor movement or noise. Differences were significant (p < 0.001).
tend to have larger R-L sway, and vice-versa, although individual prediction of one sway from the other is only about 31% better than by chance alone. Figure 5 shows the scatterplot of these two variables, while Table 9 contains the correlation matrix.
Phase 3 – Testing with ‘clinical’ chiropractic patients Figure 6 compares values obtained from the ‘Controls’ during their first ‘eyes open’ session to those from the ‘Clinicals’ (also eyes open) during their pre-adjustment session. Since the ‘Clinicals’ had different weights than the ‘Controls’, all comparisons were made by expressing the values as a percentage of the subjects’ weights. Table 10 also summarizes these results.
It was considered inappropriate to compare differences in A-P means, since the clinical subjects had not been centred on the platform first, but had been aligned with respect to a fixed toe bar on the platform. Weight means were also different, of course, and were not compared. The ‘Clinicals’ had significantly greater R-L position asymme-try ( p < 0.05), with this group showing consistently more
weight being borne on the left side. Significantly greater weight sway values also occurred among ‘Clinicals’ ( p < 0.001).
Figure 7 compares vertical weight sway among ‘Con-trols’ and ‘Clinicals’ with the weight standard deviations obtained on the static weight disks that were used in the basic study. While very small weight sway actually oc-curred during recordings made with the weight disks (and thus must reflect electronic noise and/or some degree of motion in the floor), significantly greater standard devia-tions occurred with the ‘Controls’ ( p < 0.01), and even greater ones with the ‘Clinicals’ ( p < 0.001).
Figure 8 shows the R-L means of the 27 ‘Clinicals’ as well as the 19 who were re-tested with the COPL after adjustment. While there was a measured reduction in R-L asymmetry after the adjustments in 15 of the Clinicals, 4 became more asymmetrical. The differences resulting from the adjustments were not considered statistically sig-nificant, although more subjects should be examined to see if this trend continues.
Figure 9 shows difference scores calculated by
-50.00 -40.00 -30.00 -20.00 -10.00 0.00 10.00 20.00 30.00
1 2 3 4 5 6 7 8 9
10 11 12 13 14 15 16 17 18 19 20 21 22 23 24 25 26 27
Patient Number
M
e
a
n
P
o
s
itio
n
(L
e
ft-R
ig
h
t)
L-R(Mean) L-R(Mean)2 (Pre-Adjustment) (Post-Adjustment)
Figure 8 R-L Means of 27 patients during clinical screening, and of 19 of those patients after adjustment. ing the absolute value of the second measurement from the
absolute value of the first. Positive scores in Figure 9 thus indicate a reduction of any centre of gravity deviation, while negative scores indicate a worsening alignment.
Discussion
When properly calibrated, the COPL is precise, reliable and sensitive in measuring the position and movement of the centre of pressure. There is a problem obtaining accu-rate results for total weight, but this is not really the pur-pose of this piece of equipment anyway, and the error is probably due to software inadequacy, since the hardware performs so consistently.
As expected with normal human subjects, the COPL showed greater amounts of both A-P and R-L sway in
‘eyes closed’ as opposed to ‘eyes open’ conditions. The ‘Clinical’ group displayed greater R-L position asymmetry, as might be expected for those with back pain, but the chiropractic adjustments failed to produce a signifi-cant reduction (although there was a trend evident in 15 of the 19 who were re-tested). A study with a larger number of subjects is needed to determine the effectiveness of using the COPL as described in this particular chiropractic practice. A complicating factor is that mean R-L position deviations seem to be reasonably large even among ‘Con-trols’, and appear to be not restricted to pathology or medi-cal conditions.
While differences in A-P and R-L sway between ‘Clinicals’ and ‘Normals’ were not significant, differences in vertical ‘weight sway’ were. The greater weight sway
Figure 9 Difference scores for 19 patients are calculated by subtracting the absolute value of the second (post-adjustment) measurement from the absolute value of the first (pre-adjustment) measurement. Positive scores thus indicate a reduction of any centre of gravity deviation, while negative scores indicate a worsening alignment.
-15 -10 -5 0 5 10 15 20 25
1 2 3 4 5 6 7 8 9
10 11 12 13 14 15 16 17 18 19 20 21 22 23 24 25 26 27
Patient Number
Red
u
ced
Deviat
io
n
among the ‘Clinicals’ may have resulted from muscular torques that occur as they tried to maintain their centres of mass within their base of support. People with back pain may have more difficulty controlling and modulating these torques, thus resulting in greater oscillations of the vertical component of the ground reaction force.
Another potential use for the COPL was not investi-gated herein, but became apparent with the capabilities of the equipment. With society’s aging population becom-ing more prone to loss of balance and subsequent serious injury,16–18 the measurement of COP movement and sway may be important for clinical practice. In older peo-ple, increased sway has been associated with an in-creased risk of falling.19–22 The monitoring of sway in older patients may be useful for screening those at risk
for falls, and for determining what types of interventions may be effective.
Funding sources
Funding for this study was provided from a priori sale of COPL units for use in private chiropractic clinics.
Acknowledgments
The authors wish to acknowledge the assistance of Roberta Pelletier, Amy Ruth, Kevin Mobbs, students in the Department of Human Performance, Langara College, Vancouver, B.C. V5Y 2Z6.
References
1 Kapteyn TS, Bles W, Njiokiktjien CJ, Kodde L, Massen CH, Mol JMF. Standardization in platform stabilometry being a part of posturography. Agressologie 1983; 24(7):321–326.
2 Shimba T. An estimation of centre of gravity from force platform data. J Biomechanics 1984; 17:53–60.
3 Jansen C, Laeson RE, Olesen MB. Quantitative Romberg’s Test. Acta Neurologica Scandinavia 1982; 66:93–99. 4 Nashner L, Black FO, Wall C. Adaptation to altered
support and visual conditions during stance: patients with vestibular deficits. J Neuroscience 1982; 2:536–544. 5 Thyssen H, Brynskov J, Jansen EC, Munster-Swendsen J.
Normal ranges in the reproducibility for the quantitative Romberg test. Acta Neurologica Scandinavica 1982; 66:100–104.
6 Diener HC, Dichgans J, Bacher M, Gompf B.
Quantification of postural sway in controls and patients with cerebellar diseases. Electroencephalography and Clinical Neurophysiology 1984; 57:134–142.
7 Norre ME, Forrez G. Vestibular function in otoneurology. J Otolaryngology and its Allied Specialties 1986;
48:37–44.
8 Aalto H, Pyykko I, Starck J. Computerized posturography, a development of the measuring system. Acta
Otolaryngologica (Stockholm) 1988; 449:71–75. 9 Norre ME. Sensory interaction posturography in patients
with benign paroxysmal positional vertigo. Clinical Otolaryngology 1993; 18:226–230.
10 Winter DA, Patla AE, Frank JS. Assessment of balance control in humans. Med Prog Technol 1990; 16:31–51. 11 Roland NJ, Smith CA, Miller IW, Jones AS, Lesser TH. A
simple technique to measure body sway in normal subjects and patients with dizziness. J Laryngology and Otology, 1995; 109:189–192.
12 Weerdt W, Crossley SM, Lincoln NB, Harrison MA. Restoration of balance in stroke patients: a single case design study. Clinical Rehabilitation, 1989; 3:139–147. 13 Shrout PE, Fleiss JL. Intraclass correlations: uses in
assessing rater reliability. Psychological Bulletin, 1979; 86(2):420–428.
14 Pederson D, Gore C. Anthropometry measurement error. In: Norton K, Olds T (eds) Anthropometrica. Sydney: University of New South Wales Press, 1996; 77–96. 15 Carr RV. Anthropometric Modelling of the Human
Vertical Jump. Doctoral Thesis, Simon Fraser University, Burnaby, B.C., 183–187.
16 Overstall PW, Johnson AL, Exton-Smith AN. Instability and falls in the elderly. Age Ageing 1978; 7:92S–96S. 17 Greenhouse AH. Falls among the elderly. In: Albert ML,
Knoefel JE (eds) Clinical neurology of aging (2nd ed). New York: Oxford University Press, 1994; 611–626. 18 Maki BE, Holliday PJ, Topper AK. A prospective study of
postural balance and risk of falling in an ambulatory and independent elderly population. J Gerontol 1994; 49: M72–M84.
19 Rubenstein LZ, Robbins AS, Josephson KR. The value of assessing falls in an elderly population – a randomized clinical trial. Ann Intern Med 1990; 113(4):308–316. 20 Kirshen AJ, Cape RDT, Hayes HC, Spencer JD. Postural
sway and cardiovascular parameters associated with falls in the elderly. J Clin Exp Gerontol 1984; 6:291–307. 21 Brocklehurst JC, Robertson D, James-Groom P. Clinical
correlates of sway in old age: Sensory modalities. Age Ageing 1982; 11:1–10.
22 Lord SR, Rogers MW, Howland A, Fitzpatrick R. Lateral stability, sensorimotor function and falls in older people. J Am Geriatr Soc 1999; 47(9):1077–1081.