DOI: 10.1051/epjconf/20134703006 C
Owned by the authors, published by EDP Sciences, 2013
The APACHE Project
A. Sozzetti
1,a, A. Bernagozzi
2, E. Bertolini
2, P. Calcidese
2, A. Carbognani
2,
D. Cenadelli
2, J.-M. Christille
2,3, M. Damasso
1,2,4, P. Giacobbe
1,2,5, L. Lanteri
1,
M.G. Lattanzi
1and R. Smart
11INAF – Osservatorio Astrofisico di Torino Via Osservatorio 20, 10025 Pino Torinese, Italy 2Astronomical Observatory of the Autonomous Region of the Aosta Valley, Loc. Lignan 39,
11020 Nus (Aosta), Italy
3Dept. of Physics, University of Perugia, via A. Pascoli, 06123 Perugia, Italy 4Dept. of Physics and Astronomy, University of Padova, Vicolo dell’Osservatorio 5,
35122 Padova, Italy
5Dept. of Physics, University of Trieste, via Tiepolo 11, 34143 Trieste, Italy
Abstract. First, we summarize the four-year long efforts undertaken to build the final setup of the APACHE Project, a photometric transit search for small-size planets orbiting bright, low-mass M dwarfs. Next, we describe the present status of the APACHE survey, officially started in July 2012 at the site of the Astronomical Observatory of the Autonomous Region of the Aosta Valley, in the Western Italian Alps. Finally, we briefly discuss the potentially far-reaching consequences of a multi-technique characterization program of the (potentially planet-bearing) APACHE targets.
1. INTRODUCTION
M dwarf stars, with massesM≤0.6 M, make up the vast majority of the reservoir of nearby stars within∼25–30 pc. These stars have not traditionally been included in large numbers in the target lists of radial-velocity (RV) searches for planets for two main reasons: 1) their intrinsic faintness, which prevented Doppler surveys in the optical from achieving very high radial-velocity precision (<5–10 m/s) for large samples of M dwarfs (e.g., Eggenberger & Udry2010, and references therein), and 2) their being considered as providers of very inhospitable environments for potentially habitable planets (e.g., Tarter et al.2007; Scalo et al. 2007, and references therein). These two paradigms are now shifting. There are several important reasons for such a change in perspective, which can be summarized under two main themes.
First, the observational evidence gathered by ultra-high-precision space-borne photometric surveys (e.g., Kepler) indicates that the frequency of low-mass planets, i.e. Neptunes and Super-Earths, is an increasing function of decreasing stellar mass (Howard et al. 2012; Dressing & Charbonneau2013). This result has recently been strengthened by the findings of ground-based RV programs carried out with state-of-the-art facilities (e.g., HARPS): Super-Earths with Mp ≤10 M⊕ within the Habitable Zone1 (HZ) of low-mass stars appear ubiquitous (Bonfils et al.2013). Given that the identification of a rocky, habitable planet is the essential prerequisite to its possible characterization as an actual life-bearing
ae-mail:[email protected]
1In its standard definition, the Habitable Zone corresponds to the range of distances from a given star for which water could be
found in liquid form on a planetary surface (Kasting et al.1993).
dwarfs, leading to deep transits (mag0.005 mag) for the case of planets with 2≤Rp ≤4R⊕(e.g., Charbonneau et al.2009). In addition, as we have discussed above, the favorable mass ratios allow for detection of rocky, potentially habitable planets with the RV technique, thanks to the moderately large amplitudes of the RV signals (a few m/s). Analogously, at intermediate separations (≈1–4 AU) high-precision astrometry becomes sensitive to planets in the mass range between Neptune and Jupiter (e.g., Casertano et al.2008). Finally, the favorable planet-star contrast ratios provided by the low intrinsic luminosity of M dwarfs allows for improved detectability thresholds of giant planets at wide separations (>5–10 AU) with direct imaging techniques (e.g., Bowler et al. 2012). For the same reason, atmospheric characterization of transiting low-mass Super-Earths can be achieved for this sample (e.g., Tessenyi et al. 2012). Systematic studies of planetary systems orbiting low-mass stars can thus crucially inform planet formation and evolution, structural and atmospheric models, particularly when seen in connection with the properties of the hosts (e.g., Ida & Lin2005; Mordasini et al.2012a,b; Seager & Deming2010, and references therein).
However, not all physical properties of low-mass stars are known precisely enough for the purpose of the detection and characterization of small-radius planets. Worse still, some of the characteristics intrinsic to late-type dwarfs can constitute a significant source of confusion in the interpretation in planet detection and characterization measurements across a range of techniques. First of all, there exist discrepancies between theory and observations in the determination of the sizes of M dwarfs, typically on the order of 10%–15% (Ribas 2006; Torres et al.2010, and references therein). Second, there are at present difficulties in spectroscopically determining with a high degree of precision M dwarf metallicities, as M-dwarf spectra are dominated by chemically complex molecular features that make the identification of the continuum in an M dwarf spectrum challenging, rendering line-based metallicity indicators unreliable (Woolf et al.2009; Rojas-Ayala et al.2010). Third, our understanding of the age-rotation-activity connection for field M dwarfs with age greater than t ∼0.5 Gyr (e.g., Jenkins et al. 2009; West & Basri2009) is still subject to rather large uncertainties due to the sparseness of the data. Fourth, as measurements of chromospheric activity indicators (H line) have shown how the fraction of active M dwarfs increases as a function of spectral sub-type (e.g., Bochanski et al.2005; West et al. 2011), activity-related phenomena such as stellar spots, plages, and flares become increasingly a matter of concern for planet detection and characterization programs targeting late-type stars.
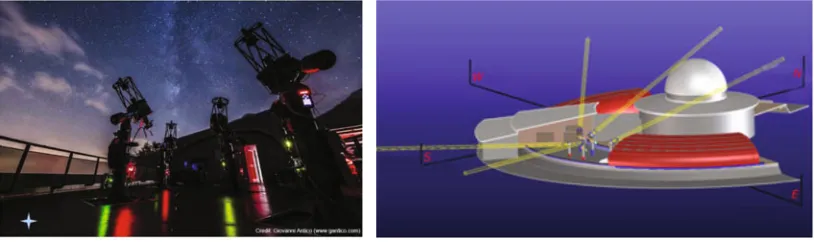
Figure 1. Left: map of northern Italy with the red cross marking the approximate location of the OAVdA in the Western Italian Alps. Right: a night view of the Aosta Valley Observatory.
thousands of bright, nearby early- to mid-M dwarfs. The APACHE project is a collaboration between INAF-Osservatorio Astrofisico di Torino (INAF-OATo) and the Astronomical Observatory of the Autonomous Region of the Aosta Valley (OAVdA). APACHE utilizes an array of five 40-cm telescopes at the OAVdA site, in the western Italian Alps (Fig.1, left and right panels). The survey, with official kick-off in July 2012, will last for five years.
2. THE SITE CHARACTERIZATION STUDY
In this work (Damasso et al. 2010), we carried out a detailed site characterization study at the OAVdA site, aimed at establishing its potential to host the APACHE project. For the purpose of the site testing campaign, we gatheredR-band photometric and seeing measurements utilizing different instruments available at the site. We gauged site-dependent observing conditions such as night-sky brightness, photometric precision, and seeing properties. Public meteorological data were also used in order to help in the determination of the actual number of useful observing nights per year.
We measuredV-band night-sky brightness and extinction levels not dissimilar from those registered at other good observing sites. The median seeing over the period of in situ observations (a few months) was found to be≈1.7(Fig.2, left panel), and rather stable. However, given the limited duration of the observations, we did not probe any possible seeing seasonal patterns or the details of its possible dependence on other meteorological parameters, such as wind speed and direction. The fraction of fully clear nights per year amounts to 39%, while the total of useful nights increases to 57%, assuming a (conservative) cloud cover of not more than 50% of the night. Based on the analysis of photometric data collected over the period of 2009 May-August for three stellar fields centered on the transiting planet hosts WASP-3, HAT-P-7, and Gliese 436, we achieved seeing-independent best-case photometric precision∼3 mmag (rms) in several nights for bright (R <11 mag) stars (see Fig.2, right panel for an example). A median performance∼6 mmag during the observing period was obtained for stars with
R <13 mag.
3. THE PILOT STUDY
The pilot study (Giacobbe et al. 2010) was focused on a year-long photometric monitoring campaign, using small-size instrumentation (25–80 cm class telescope systems), of a sample of 23 bright (J <
Figure 2. Left: the distribution of seeing measurements over the whole period of observation reported in Damasso et al. (2010). The small black stars show individual data points, each corresponding to an average seeing value over a 1 min interval. The large filled circles indicate the median seeing value for each night. Right: photometric errors (rms) vs. instrumental mean magnitude in the field of the planet-hosting star WASP-3 during a good observing night (Damasso et al. 2010). The various contributions to the expected photometric noise, according to an analytic error budget model, are also shown. Pictures reprinted with permission from Damasso et al. (2010).
b) where possible, to better our knowledge of some astrophysical properties (e.g., activity, rotation, age) of our targets through a combination of spectroscopic and astrometric information and our differential photometric measurements.
We achieved a typical nightly rms photometric precision of∼5 mmag, with little or no dependence on the instrumentation used or on the details of the adopted methods for differential photometry, and gauged the degradation levels in the precision with respect to a pure white noise regime due to the presence of correlated (red) noise in our data. Based on a detailed stellar variability analysis, a) we detected no transit-like events (an expected result given the sample size); b) we determined<1 day photometric rotation periods for two of the M dwarfs in the sample, in agreement with the large projected rotational velocities inferred for both stars based on the analysis of archival spectra, and found consistency of the estimated inclinations of the stellar rotation axes with those derived using a simple spot model (see Fig.3, left panel). For two stars in the sample we recorded short-term, low-amplitude flaring events. Finally, based on simulations of transit signals of given period and amplitude injected in the actual (nightly reduced) photometric data for our sample, we derived a relationship between transit detection probability and phase coverage (see Fig.3, right panel). We found that, using the BLS search algorithm, even when phase coverage approached 100%, there was a limit to the detection probability of ≈90%. Around program stars with phase coverage>50% we would have had>80% chances of detecting planets withP <1 day inducing fractional transit depths>0.5%, corresponding to minimum detectable radii in the range∼1.0–2.2R⊕.
4. THE APACHE INFRASTRUCTURE
Figure 3. Left: photometric data for the dM star LHS 3445 folded according to its probable rotation period (P =0.472 days). Overplotted is a best-fit single-spot model, as discussed in Giacobbe et al. (2012). Right: average detection probability as a function of average phase coverage forP <1.0 days. Pictures reprinted with permission from Giacobbe et al. (2012).
Figure 4. Left: close-up night view of the APACHE telescope array. Right: a cartoon visualizing the exact arrangement of the APACHE telescopes within the OAVdA platform.
Johnson-Cousins R & I filters. These systems guarantee state-of-the-art quality performance: negligible temperature gradients, QE 80% in the whole wavelength range of interest. The open source observatory manager RTS2 (Kubanek2010) is the choice for the high-level software control of the five-telescope system, including dynamic scheduling of the observations (for details, see Christille et al., this volume). Provisions have been made for the hardware of relevance for the APACHE operations control, data acquisition, processing centre and backup, which is necessary to accommodate the high data rate: two HP Z600 Workstation and one HP EliteBook 8740w Mobile Workstation as control PCs and workstations for data analysis, one HP Storage Works X1600 12TB as Network Attached Storage (NAS), connected together via Intranet 1 GB.
5. SURVEY DESIGN: INPUT CATALOGUE AND OBSERVING STRATEGY
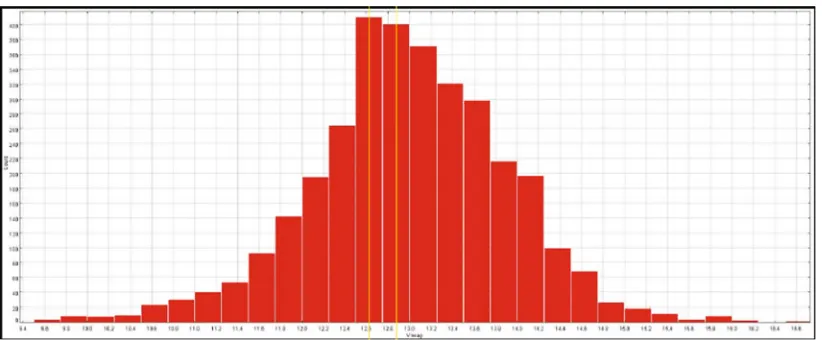
Figure 5. V mag distribution of the APACHE target sample.
∼3000 targets selected on the basis of their visibility from the OAVdA site and the availability of a suitable number of potentially good comparison stars in the telescopes’ field-of-view. Moreover, cross-correlation with approximately two dozen catalogues was performed to get further information about the targets, such as a precise determination of spectral class, their projected rotational velocityVsini, their level of chromospheric activity, X-ray emission, the presence of binary companions detected either spectroscopically or by direct imaging, or astrometry, or a combination of these techniques. Based on accurate parameterization of Gaia’s scanning law, the number of the Gaia transits scheduled was associated to each target. Based on all available information, a prioritized list was defined for the purpose of scheduling with the APACHE telescopes. The final optical magnitude distribution of the sample peaks at V ≈13 mag, with a median of V ∼14 mag (Fig. 5). The vast majority of targets is bright enough to allow for a host of additional characterization measurements, in case of positive detections of transiting planets. As a synergetic example, a carefully selected sub-sample of APACHE targets is currently the objective of high-precision RV monitoring with the HARPS-N spectrograph on the Telescopio Nazionale Galileo (TNG) as part of the long-term Global Architecture of Planetary Systems (GAPS) programme.
We built upon the experience matured with the pilot study to define and then refine the details of the observing strategy for the APACHE survey. Taking into account the use of synthetic transits, by assuming different numbers of consecutive exposures (from 1 to 4) and different temporal samplings (intervals of 20 through 50 minutes between two sets of consecutive pointings of the telescope on the same target), we evaluated the transit detection probabilities for stars with different average phase coverages in a given interval of possible orbital periods. The results of this analysis prompted us to adopt an initial observing strategy consisting of 3 exposures every∼20 minutes, to be eventually revisited as the survey unfolds.
6. THE FIRST SIX MONTHS OF OPERATIONS
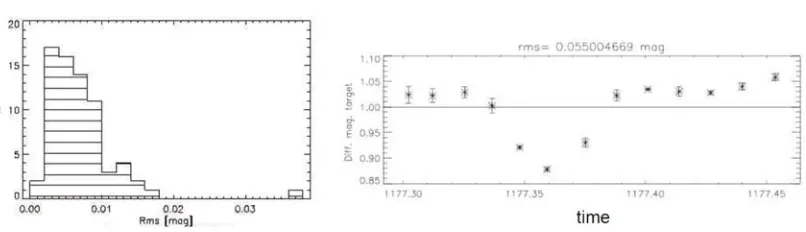
Figure 6. Left: rms photometric precision distribution for a sample of∼100 APACHE targets observed during the first six months of survey operation. Right: APACHE#1 independent discovery lightcurve of an eclipsing binary first reported by Kiraga (2012).
Using the robust TEEPEE pipeline for the reduction and analysis of the photometric data (Giacobbe et al. 2012), we performed differential aperture photometry on the ensemble of targets observed to-date. The resulting distribution of the rms photometric precision for the sample (Fig.6, left panel) has a median of∼5 mmag, attesting of the quality of the data. We independently discovered (Fig.6, right panel) a new eclipsing binary amongst our targets, that was published by Kiraga (2012) while we were performing a preliminary analysis on the data.
In parallel, we are developing the pipeline TSE (TEEPEE Sentinel) which is designed to perform real-time differential photometry of the targets during each night. Once fully developed and tested, TSE will be used for a prompt identification and assessment of interesting signals, triggering real-time changes in the observing strategy such as high-cadence follow-up of ongoing possible events (magnifying the sensitivity to long-period planets).
A significant update to the AIC is now ongoing, based on the latest spectroscopic information for many of the APACHE targets published by Lépine et al. (2013). The repercussions are particularly non-negligible in the M0-M1 sub-spectral type regime, with many objects being spectroscopically recognized as earlier-type dwarfs.
7. SUMMARY
[2] Bonfils X., et al., A&A, 549, A109 (2013) [3] Casertano S., et al., A&A, 482, 699 (2008) [4] Charbonneau D., et al., Nature, 462, 891 (2009) [5] Ciardi D.R., et al., AJ, 141, 108 (2011)
[6] Dressing C.D., & Charbonneau D., ApJ, accepted (arXiv:1302.1647) (2013) [7] Eggenberger A., & Udry S., EAS Pub. Ser., 41, 27 (2010)
[8] Giacobbe P., et al., MNRAS, 424, 3101 (2012) [9] Howard A.W., et al., ApJS, 201, 15 (2012) [10] Ida S., & Lin D.N.C., ApJ, 626, 1045 (2005) [11] Jenkins J. S., et al., ApJ, 704, 975 (2009) [12] Kasting J. F., et al., Icarus, 101, 108 (1993) [13] Kiraga M., AcA, 62, 67 (2012)
[14] Kubanek P., AdAst, 2010, 902484 (2010) [15] Lépine S., & Gaidos E., AJ, 142, 138 (2011)
[16] Lépine S., et al., AJ, in press (arXiv:1206.5991) (2013) [17] Mordasini C., et al., A&A, 547, A111 (2012)
[18] Mordasini C., et al., A&A, 547, A112 (2012)
[19] Nutzman P., & Charbonneau D., PASP, 120, 317 (2008) [20] Ribas I., Ap&SS, 304, 89 (2006)
[21] Rojas-Ayala B., et al., ApJ, 720, L113 (2010) [22] Scalo J., et al., Astrobiology, 7, 85 (2007)
[23] Seager S., & Deming D., ARA&A, 48, 631 (2010) [24] Smart R.L., et al., A&A, 514, A84 (2010)
[25] Tarter J.C., et al., Astrobiology, 7, 30 (2007) [26] Tessenyi M., et al., ApJ, 746, 45 (2012) [27] Torres G., et al., A&ARv, 18, 67 (2010) [28] West A.A., & Basri G., ApJ, 693, 1283 (2009) [29] West A.A., et al., ASP. Conf. Ser., 448, 531 (2011) [30] Woolf V.M., et al., PASP, 121, 117 (2009)