Open Access
Research article
A new methodology for assessment of the performance of
heartbeat classification systems
John M Darrington*
1and Livia C Hool
2Address: 1School of Computer Science and Software Engineering University of Western Australia Perth, WA, Australia and 2Cardiac
Electrophysiology Laboratory School of Biomedical, Biomolecular and Chemical Sciences University of Western Australia Perth, WA, Australia
Email: John M Darrington* - [email protected]; Livia C Hool - [email protected] * Corresponding author
Abstract
Background: The literature presents many different algorithms for classifying heartbeats from ECG signals. The performance of the classifier is normally presented in terms of sensitivity, specificity or other metrics describing the proportion of correct versus incorrect beat classifications. From the clinician's point of view, such metrics are however insufficient to rate the performance of a classifier.
Methods: We propose a new methodology for the presentation of classifier performance, based on Bayesian classification theory. Our proposition lets the investigators report their findings in terms of beat-by-beat comparisons, and defers the role of assessing the utility of the classifier to the statistician. Evaluation of the classifier's utility must be undertaken in conjunction with the set of relative costs applicable to the clinicians' application. Such evaluation produces a metric more tuned to the specific application, whilst preserving the information in the results.
Results: By way of demonstration, we propose a set of costs, based on clinical data from the literature, and examine the results of two published classifiers using our method. We make recommendations for reporting classifier performance, such that this method can be used for subsequent evaluation.
Conclusion: The proportion of misclassified beats contains insufficient information to fully evaluate a classifier. Performance reports should include a table of beat-by-beat comparisons, showing not-only the number of misclassifications, but also the identity of the classes involved in each inaccurate classification.
Background
In recent years there has been a surge of interest in com-puter implementations of automatic beat classification algorithms. The impetus for this research stems partly from the advances and miniaturisation of electronics, which allows portable, wearable and implantable devices to perform greater functionality than was achievable in
the past, but also from the desire to automate tasks cur-rently performed by intensive care and operating room staff.
There are several principles on which classifiers operate, and many variations and implementations of each. With the large number of published algorithms comes the need
Published: 30 January 2008
BMC Medical Informatics and Decision Making 2008, 8:7 doi:10.1186/1472-6947-8-7
Received: 10 October 2007 Accepted: 30 January 2008 This article is available from: http://www.biomedcentral.com/1472-6947/8/7
© 2008 Darrington and Hool; licensee BioMed Central Ltd.
to analyse and compare their performance. The literature to date, compares techniques on a low level, parameter-by-parameter basis [1-3]. ANSI standard EC57 [4] attempts to formalise methods for reporting such compar-isons. These comparisons are of interest to those working on the development of new algorithms or the enhance-ment of existing ones, but are of little interest to a clinician when making a decision about which algorithm suits his purpose.
Problems with current classification methods
The contemporary method for reporting the performance of a beat classification algorithm involves beat-by-beat comparisons between the class as indicated by the algo-rithm and as indicated by some reference. The MIT-BIH database [5] is a commonly used reference source. Per-formance is reported either by a table giving counts of cor-rectly and incorcor-rectly classified beats, or by way of statistics inferred from such a table. Common statistics are sensitivity (Se), specificity (Sp) and positive predictivity (+P). These are defined as:
where:
TP = number of true positives
FP = number of false positives
TN = number of true negatives
FN = number of false negatives.
However these values are defined only for binary classifi-cation, and do not readily lend themselves to problems involving more than two classes, {ω1, ω2 ... ωn}. Neverthe-less, in the literature, one often sees beat classifier per-formance reports where sensitivity and specificity are freely quoted. Whilst the definitions of these measures for the context are normally not given, they appear to use the following extended definitions:
TPj = number of beats correctly identified as belonging to class ωj
FPj = number of beats incorrectly identified as belonging to class ωj
TNj = number of beats correctly identified as belonging to a class other than ωj
FNj = number of beats incorrectly identified as belonging to a class other than ωj
and hence Sej, Spj and +Pj can be defined accordingly.
A number of problems become apparent when using such statistics to evaluate the performance of beat classifiers:
1. They do not take into account the a priori probabilities of the beat classes.
2. They do not take into account the relative costs of false classification.
3. They can be presented only as a multi-dimensional value, even where only two classes are being considered. There is no obvious single ordinal value.
Problem 1 has been recognised in the medical literature [6]. We are not aware of any previous attempt to deal with problem 2. Problem 3 makes these reports particularly unhelpful from the point of view of the clinician trying to compare systems with a view to adopting one for use. For an n class classifier, there are 2n scalar quantities, so rank-ing classifiers usrank-ing these quantities is not possible.
We propose a new method, which overcomes these prob-lems and aims to be generally useful for the quantitative comparison of beat classification schemes.
Proposed methodology
A system's utility as a prognostic medical tool is a measure of the benefit afforded by selecting it against other alterna-tives. Choosing a system involves maximising the benefit, or alternatively, minimising the risk. A measure for the overall risk associated with making a decision based upon the output of a beat classifier is a useful measure of its per-formance. Risk is characterised by the probability of error and the costs associated with making a decision based upon the erroneous classification. We have used Bayesian decision theory to determine a method of calculating the risk associated with a beat classifier.
Introduction to Bayesian risk
Bayesian decision theory is presented in many texts on sta-tistics and classification theory [7,8] and will be intro-duced here only briefly. In a system which is claimed to recognise n different classes of beats {ω1, ω2 ...ωn}, there are n possible outputs, {α1, α2 ... αn}. Bayes rule states: Se TP
TP FN
Sp TN TN FP
P TP TP FP
= + =
+ + =
+
,
,
,
P P k j P j
P k
j k
( | ) ( | ) ( ) ( ) .
Since {α1, α2 ... αn} are mutually exclusive and then
The quantity P(ωj) is called the a priori probability,
P(αk|ωj) the likelihood or class conditional probability and
P(ωj|αk) the a posteriori probability. Note that P(αj|ωj) ≡ Sej . From (1) and (2) we can write:
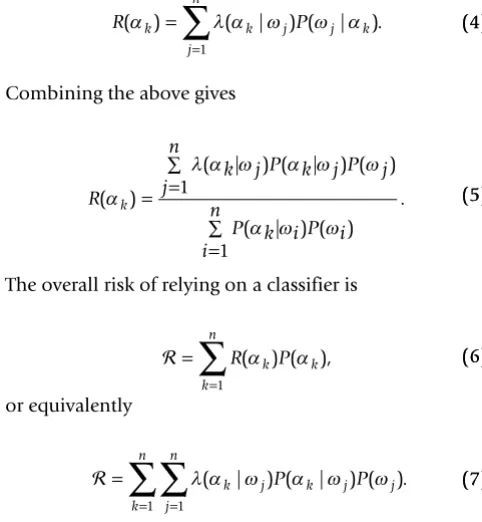
Let λ(αk|ωj) be the cost incurred for making decision αk when ωj is the true beat class. Therefore, the risk of making decision αk based upon the classifier's output (the risk of reliance) is:
Combining the above gives
The overall risk of relying on a classifier is
or equivalently
We propose that {R(α1), R(α2) ... R(αn)} be used in the consideration of a classifier's utility, and that be used for overall rating of classifiers. has the range (0, ∞) and its units are dollars (or whatever units have been chosen for λ(αk|ωj)). We envisage that a unitless measure, having the range (0, 1) is more useful in many circumstances. Accordingly, we also propose a normalised metric:
where is the value obtained from equation (5)
when the class conditional probabilities are set to
Thus, a perfect classifier has a value of zero and, at the opposite extreme, unity.
Results
ANSI EC57 section 4.3 identifies 5 classes of beats which are recommended in performance reports, viz: normal beats, Supra-Ventricular Ectopic Beats, Ventricular Ectopic Beats, fusions of normal and Ventricular Ectopic Beats and other unclassified beats. From secondary data sources, we derived a priori probabilities and costs of decisions for these classes. A detailed description of the derivation and the data sources are below.
Table 1 shows the a priori probabilities. Table 2 shows the costs. Together with the values of P(αk|ωj), these tables enable the risk to be calculated. Unfortunately, in many cases the literature presents neither the values for P(αk|ωj), nor the table of beat-by-beat comparisons from which they could be deduced. In the literature, we were able to find only two classifiers for which this data was reported. These are the classifiers of de Chazal et al. [9] and of Melo
et al. [10]. Melo et al. publishes separate results for aber-rated atrial premature beats. For the purposes of compar-ison, we have regarded aberrated and non-aberrated atrial premature beats as a single class (ωSVEB).
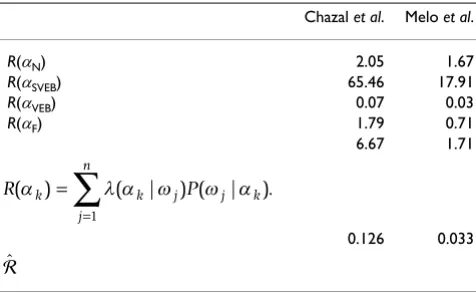
The results are shown in Table 3. In these results, the over-all risk is significantly lower for the Melo classifier, and the risks of reliance R(αi) is also lower for all i. In other words, this classifier dominates in all respects. In general
P(∪in=1αi)=1
P k P k i P i
i n
(α )= (α ω| ) (ω). =
∑
1 (2)(2)P P k j P j
P k i P i
i n j k ( | ) ( | ) ( ) ( | ) ( ) . ω α = = ∑ α ω ω α ω ω 1 (3) (3)
R k k j P j k
j n
(α )= λ α ω( | ) (ω α| ). =
∑
1 (4)(4)R
k j P k j P j
j n
P k i P i
i n k ( ) ( | ) ( | ) ( ) ( | ) ( ) . α λ α ω α ω α ω ω = = ∑ = ∑ ω 1 1 (5) (5) = =
∑
R k P k k n (α ) (α ), 1 (6) (6) = = =∑
∑
λ α ω( k| j) (α ωk| j) (ωj). j n k n P P 1 1 (7) (7) ˆ max , = (8)(8)
max
P k j
k j
i i j
( | )
( | ) max ( | ).
α ω = = ⎧ ⎨ ⎪⎪ ⎩ ⎪ ⎪ 1 0 if otherwise λ α ω
λ α ω (9)(9)
ˆ
Table 1: A priori probabilities derived from the MIT-BIH Arrhythmia Database.
j ωj cj P(ωj)
however this may not be the case, and one classifier may have a lower risk of reliance for one decision whilst having a higher risk of reliance for another.
Discussion
We do not presume that the costs presented herein, or the propositions used in their calculation are universally applicable. Rather, we seek to demonstrate how, given the class conditional matrix, an ordinal measure for a beat classifier may be determined, applicable to any particular situation. Others might disagree with our cost calculation methods, or the application might demand consideration for classes other than those we have investigated. Whilst we have used monetary units to measure costs, we recog-nise the ethical issues raised by doing so, and our method-ology imposes no requirement on the nature of the units of cost. Any unit acceptable to the community of interest may be used. In such cases, given the class conditional matrix, potential users may conduct their own studies and assess the performance of the classifier using the method we have described.
To facilitate such studies, we urge biomedical engineers to report more than the relative numbers of correct versus incorrectly classified beats, but also the identity of the misclassified beats in the form of a class conditional matrix. ANSI EC57 describes how to compile such a matrix, but makes no recommendation for its publica-tion. It is trivial to calculate sensitivity and specificity from such a matrix if desired, and allows for more useful meas-ures of performance as described herein. We recommend publication of the class conditional matrix and/or a table of beat-by-beat comparisons.
Conclusion
The utility of a beat classifier cannot be fully quantified in terms of the number of correct and incorrect beats. Instead, the number of misclassifications for each class is
required. Together with the a priori probabilities and the costs of misclassification, quantitative measures of a clas-sifier's utility can be determined.
A system which claims to classify beats into more than two classes is not a binary classifier, and performance should not be reported as if it is. Instead of reporting sen-sitivity/specificity/predictivity for each of the n classes, a n
× n matrix of beat classifications (the class conditional fre-quencies) should be reported.
Clinicians wishing to assess a classifier need to obtain esti-mates for the costs of misclassification, and calculate the overall risk of reliance.
Methods
Equation (5) comprises the terms P(αk|ωi), P(ωj) and λ(αk|ωj). P(αk|ωi) are parameters of the classifier and can be tested experimentally. P(ωj) and λ(αk|ωj) are parame-ters of the classes of interest. They are respectively the a pri-ori probabilities and the costs of making decisions. In this section we examine a number of secondary sources to determine values for P(ωj) and λ(αk|ωj).
A priori probabilities
We used the MIT-BIH Arrhythmia Database to extract a
priori probabilities. The records chosen were the first
group of records (numbers 100–124) from the database. We omitted the second group (numbers 200–234), since these were deliberately selected by the authors of the data-base to contain "rare but clinically important phenom-ena", whereas the first group was randomly selected so as to "serve as a representative sample of the variety of wave-forms and artifact that an arrhythmia detector might encounter in routine clinical use".
Table 1 shows the data extracted from the database. Class 0 was disregarded, since these annotations are not beats, but are used to mark other interesting features in the sig-nal. cj are the counts of beats of class ωj. P(ωj) was
calcu-Table 2: Costs of false classification in 1000s of AUD
λ ωN ωSVEB ωVEB ωF ωQ
αN 0 38.631 170.192 170.193 0
αSVEB 0 0 170.194 170.195 0
αVEB 2.156 2.157 0 0 0
αF 2.158 2.159 0 0 0
αQ 0 0 0 0 0
1 Datum 5 2 Datum 13 3 Datum 13 4 Datum 13 5 Datum 13 6 Datum 14 7 Datum 14 8 Datum 14 9 Datum 14
Table 3: Comparative performance of two classifiers
Chazal et al. Melo et al.
R(αN) 2.05 1.67
R(αSVEB) 65.46 17.91
R(αVEB) 0.07 0.03
R(αF) 1.79 0.71
6.67 1.71
0.126 0.033
R k k j P j k
j n
(α )= λ α ω( | ) (ω α| ). =
∑
1lated by dividing cj by , Note that c5 = 0 and we therefore conclude that beat classes other than 1–4 are sufficiently rare to have negligible effect on the utility of a system.
Extrapolation of data
Where possible, we referred to longitudinal studies, giving data gathered over a period of 10 years or longer. In many instances, the data was available only in graphical form in which case trapezoidal approximation of integrals was used. Where data over a 10 year period was not available, we used data gathered over a shorter period and extrapo-lated by the following method.
We presume survival to be described by an exponential expression
s = κeβt. (10) where κand βare constants for which β< 0 and 0 <κ≤ 1. Equation (10) implies that the mortality fraction m is
m = 1-κeβt. (11) Integrating m over 10 years gives the total loss:
which can be expressed as
where X = ln κ. Thus equation (10) implies
ln(s) = X + βt. (14) Hence, X and β can be found from the data by linear regression of t against ln(s), and the total expected mortal-ity over 10 years from equation (13).
Costs of incorrect classification
In determining costs for incorrect decisions, we have pre-sumed standard clinical treatment of abnormal beats, or non-treatment of normal beats according to the system's output. We have then investigated the costs, in monetary terms, of taking that course of action under each state of nature. We have endeavoured to report 'costs' as the gen-eral cost to society, rather than the cost to any particular entity. A summary of these figures is presented in Table 2. All costs have been normalised the year 2006, and are in Australian dollars except where otherwise noted.
Each application however may have different ancillary parameters, and these may affect the costs involved. The methods and figures provided in this study reflect the most general situation, as best as we could determine. Propositions we have made in calculations of costs we have stated herein, and these should be examined when applying the figures.
Proposition 1 The clinical treatment for fusions of normal and Ventricular Ectopic Beats (class ωF) is identical to that for Ventricular Ectopic Beats.
We make this proposition on the basis that sustained Ven-tricular Ectopic Beats are potentially life threatening, and must be treated. To a clinician, the fact that the polarisa-tion of the waveform coincides with the preceding beat is merely incidental.
Proposition 2 The maximum future projection which may affect costs of misclassification is 10 years.
10 years is chosen as a reasonable period beyond which the advances in medical technology can be expected to invalidate the results of future prediction.
Datum 1 The expected loss of life of a healthy subject, projected over the next 10 years, is 1.21 years.
This datum is from the control group of Benjamin et al. [11]. This was a longitudinal study which investigated the mortality of subjects who had developed Atrial Fibrilla-tion. We integrated the survival results presented by Figure A of that paper to determine the expected number of years of life lost by a healthy subject.
Datum 2 The probability that a subject with Supra-Ventricular Ectopic Beats will develop Atrial Fibrillation is 0.324.
Datum 2 comes from the results of Frost et al. [12].
Datum 3 The expected loss of life due to a person suffering from Atrial Fibrillation is 2.69 years (projected over 10 years).
Datum 3 is determined from Benjamin et al. in a similar fashion to Datum 1: The calculations are presented in Table 4.
Datum 4 A person's contribution to society is $44,320 per annum.
Datum 4 is the mean average wage in Australia for the year 2006[13].
Datum 5 The cost of misdiagnosing a Supra-Ventricular Ectopic Beat as a normal beat, λ(αN|ωSVEB) is $38,627.
cj
1 5
∑
1
0 10
−
∫
κe dtβt , (12)(12)10−e X e ×10−1
β β
This figure is the product of Data 2, 3 and 4.
Datum 6 The probability of initially surviving Ventricular
Fibrillation is .
From the text of Baum et al.[14], we know that, in a 3 year study of Ventricular Fibrillation cases, 146 patients out of 886 initially survived Ventricular Fibrillation.
Datum 7 The total expected loss of life by a person who initially survives Ventricular Fibrillation is 6.33 years (projected over 10 years).
To derive Datum 7 we used the results of Baum et al.[14]. In Figure 2 of that paper, survival curves are presented for subjects who initially survived Ventricular Fibrillation. Survival data are presented for only 24 months. We extrapolated survival data over a 10 year period by the method described above.
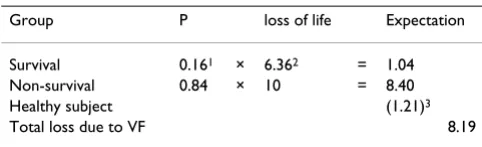
Datum 8 The expected loss of life, attributable to Ventricular Fibrillation, by a subject who suffers Ventricular Fibrillation is 8.19 years (projected over 10 years).
We know from Datum 3 that the expected loss of life of healthy subjects is 1.21 years. Hence we can calculate the loss due to Ventricular Fibrillation as per Table 5.
Datum 9 The expected loss of life, attributable to Ventricular Tachycardia by a subject who suffers Ventricular Tachycardia is 2.59 years (projected over 10 years).
This datum was obtained from Doval et al.[15] by the data extrapolation method described previously. In that study of 516 subjects both with and without non-sustained Ven-tricular Tachycardia, the projected loss over 10 years for the group with Ventricular Tachycardia was 9.24 years, whereas the projected loss for the group without Ventricu-lar Tachycardia was 6.65 years. The difference is 2.59 years.
Datum 10 The probability that a subject who experiences one or more episodes of Ventricular Ectopic Beats, will develop Ven-tricular Fibrillation is 0.34.
Datum 11 The probability that a subject who experiences one or more episodes of Ventricular Ectopic Beats, will develop Ven-tricular Tachycardia is 0.41.
Datum 10 and Datum 11 are implied from Carrim and Khan [16]. In that study of 44 subjects exhibiting Ven-tricular Ectopic Beats, V T is the set of subjects developing Ventricular Tachycardia and V F is the set of subjects developing Ventricular Fibrillation. From their data, we are given:
|V T ∪V F| = 21, (15) (15)
and
from which we can deduce that |V T ∩V F| = 12, |V T| = 18 and |V F| = 15.
Thus,
and
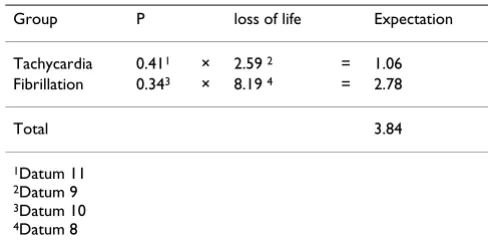
Datum 12 The expected loss of life, when a Ventricular Ectopic Beat is misdiagnosed as a normal beat is 3.84 years.
Datum 12 is derived from Data 10, 11, 8 and 9. The deri-vation is shown in Table 6.
Datum 13 The cost of misdiagnosing a Ventricular Ectopic Beat as a normal beat, λ(αN|ωVEB) is $170,189.
146
886 =0 164.
VT∩VF =6, (16)(16)
VF∩VT =3, (17)(17)
P(VEBxVT)= VT =
18
44 (18)(18)
P(VEBxVF)= VF = .
15
44 (19)(19)
Table 4: Expected Loss of life due to Atrial Fibrillation
Women without Atrial Fibrillation 0.87 Men without Atrial Fibrillation 1.55 Mean Average 1.21 Women with Atrial Fibrillation 3.75 Men with Atrial Fibrillation 4.05 Mean Average 3.90 Expected Loss Due to AF 2.69
Table 5: Expected Loss of life due to Ventricular Fibrillation
Group P loss of life Expectation Survival 0.161 × 6.362 = 1.04
Non-survival 0.84 × 10 = 8.40 Healthy subject (1.21)3
Total loss due to VF 8.19
This is the product of Datum 12 and Datum 4. By Propo-sition 1 we attribute the same cost to λ(αN|ωF).
Costs of misclassification of a normal beat as abnormal
Ventricular Ectopic Beats are of potential concern to a physician. If a system misclassifies a normal beat (ωN), or a Supra-Ventricular Ectopic Beat (ωSVEB) as Ventricular
Ectopic Beat or a fusion beat (decisions αVEB and αF), the likely result is that the patient will be unnecessarily detained in observation, pending further examination. Thus, the cost of misclassification, in this case, is the cost of retaining a patient in intensive care for one day.
Datum 14 The cost of retaining a patient in intensive care for 1 day is $2146
This datum is the mean average of figures obtained from two independent Australian health insurance providers. A case study by Rechner and Lipman[17] for the year 2003 cites the figure $2670. This study however was conducted within a teaching hospital, and we therefore expect the costs to be higher than average.
We use the cost of retaining a patient in intensive care for one day as the cost of misclassification of a normal beat as the penalty in such instances. Thus λ(αVEB|ωN) = λ(αF|ωN)
= λ(αVEB|ωSVEB) = λ(αF|ωSVEB) = $2146.
From Proposition 1 we conclude that λ(λ(αF|ωVEB) = λ(αVEB|ωF) = 0.
Erroneous classification of beats as Supra-Ventricular Ectopic Beats
Unlike Ventricular Ectopic Beats, Supra-Ventricular Ectopic Beats are typically not life threatening, and are therefore not normally treated unless recurrent [18]. Thus, the cost of misclassification as a normal beat (λ(αSVEB|ωN)) is zero. By the same token, misclassification of Ventricular Ectopic Beats or fusion beats as Supra-Ven-tricular Ectopic Beats bears the same penalty as an errone-ous classification as a normal beat. Thus λ(αSVEB|ωVEB) = λ(αN|ωVEB) and λ(αSVEB|ωF) = λ(αN|ωF).
Upper bound of risk
From Tables 1 and 2, the value of was calculated as
described in section as $52,817.
Competing interests
The author(s) declare that they have no competing inter-ests.
Authors' contributions
JMD conceived the study, participated in the acquisition of data, and drafted the manuscript. LH assisted with the design of the study, made substantial contribution to the acquisition of secondary data and the interpretation of data. Both authors read and approved the final manu-script.
Acknowledgements
The authors would like to express their thanks to Amitava Datta for his advice during this study.
References
1. Christov I, Bortolan G: Ranking of pattern recognition parame-ters for premature ventricular contractions classification by neural networks. Physiological Measurement 2004, 25:1281-1290. 2. de Chazal P, Reilly RB: A Comparison of the ECG Classification
Performance of Different Feature Sets. Computers in Cardiology 2000, 27:327-330.
3. Christov I, Gómez-Herrero G, Krasteva V, Jekova I, Gotchev A, Egia-zarian K: Comparative study of morphological and time-fre-quency ECG descriptors for heartbeat classification. Medical Engineering and Physics 2006, 28(9):876-887.
4. Testing and reporting performance results of cardiac rhythm and ST-segment measuring algorithms. Arlington, VA, USA; 1988. Published as American National Standard ANSI/ AAMI EC57:1988
5. Schluter P, Peterson S, Moody G, Siegal L, Jackson C, Perry D, Acar-turk E, Aumiller J, Blake S, Blaustein A, Conrad C, Heller G, Malagold M, Mark R, Miklozek C: MIT-BIH Arrhythmia Database Direc-tory. Online database 1987 [http://www.physionet.org/physiobank/ database/html/mitdbdir/mitdbdir.htm].
6. Altman DG, Bland JM: Statistics Notes: Diagnostic tests 2: pre-dictive values. British Medical Journal 1994, 309(6947):102. 7. Schlesinger MI, Hlaváč V: Ten Lectures on Statistical and Structural
Pat-tern Recognition Volume 24. Issue chap 1 Kluwer Academic Publishers; 2002:1-22.
8. Duda RO, Hart PE: Pattern Classification and Scene Analysis 1st edition. Issue chap 2 Kluwer Academic Publishers; 1973:10-39.
9. de Chazal P, O'Dwyer M, Reilly RB: Automatic Classification of Heartbeats Using ECG Morphology and Heartbeat Interval Features. IEEE Transactions on Biomedical Engineering 2004,
51(7):1196-1206.
10. Melo SL, Calôba LP, Nadal J: Arrhythmia Analysis Using Artifi-cial Neural Network and Decimated Electrocardiographic Data. Computers in Cardiology 2000, 27:73-76.
11. Benjamin EJ, Wolf PA, D'Agostino RB, Silbershatz H, Kannel WB, Levy D: Impact of Atrial Fibrillation on the Risk of Death: The Framingham Heart Study. Circulation 1998, 98:946-952. 12. Frost LHM, Christiansen EH, Jacobsen CJ, Allermand H, Thomsen
PEB: Low vagal tone and supraventricular ectopic activity predict atrial fibrillation and flutter after coronary artery bypass grafting. European Heart Journal 1995, 16:825-831. 13. Australian Bureau of Statistics: 6306.0 – Employee Earnings and
Hours, Australia, May 2006. 2616 [http:www.abs.gov.aAUSSTAT [email protected]?O nDocument#]. Belconnen, ACT Australia
14. Baum RS, III HA, Cobb LA: Survival after Resuscitation from Out-of-Hospital Ventricular Fibrillation. Circulation 1974,
50:1231-1235.
max
Table 6: Expected loss of life due to Ventricular Ectopic Beats
Group P loss of life Expectation Tachycardia 0.411 × 2.59 2 = 1.06
Fibrillation 0.343 × 8.19 4 = 2.78
Total 3.84
Publish with BioMed Central and every scientist can read your work free of charge
"BioMed Central will be the most significant development for disseminating the results of biomedical researc h in our lifetime."
Sir Paul Nurse, Cancer Research UK
Your research papers will be:
available free of charge to the entire biomedical community
peer reviewed and published immediately upon acceptance
cited in PubMed and archived on PubMed Central
yours — you keep the copyright
Submit your manuscript here:
http://www.biomedcentral.com/info/publishing_adv.asp
BioMedcentral
15. Doval H, Nul D, Grancelli H, Varini S, Soifer S, Corrado G, Dubner S, Scapin O, Perrone S: Nonsustained Ventricular Tachycardia in Severe Heart Failure: Independent Marker of Increased Mortality due to Sudden Death. Circulation 1996,
94(12):3198-3203.
16. Carrim ZI, Khan AA: Mean Frequency of Premature
Ventricu-lar Complexes and Predictor of Malignant VentricuVentricu-lar Arrythmias. The Mount Sinai Journal of Medicine 2005,
72(6):374-380.
17. Rechner IJ, Lipman J: The costs of caring for patients in a terti-ary refereral Australian Intensive Care Unit. Anaesthesia Inten-sive Care 2005, 33(4):477-482.
18. Lundqvist CB: ACC/AHA/ESC Guidelines for the Management
of Patients with Supraventricular Arrhythmias – executive summary a report of the American college of cardiology/ American heart association task force on practice guidelines and the European society of cardiology committee for prac-tice guidelines (writing committee to develop guidelines for the management of patients with supraventricular arrhyth-mias). Journal of the American College of Cardiology 2003,
42(8):1493-1531. Developed in Collaboration with NASPE-Heart Rhythm Society
Pre-publication history
The pre-publication history for this paper can be accessed here: