T E C H N I C A L A D V A N C E
Open Access
Mining biomarker information in biomedical
literature
Erfan Younesi
1,2, Luca Toldo
3, Bernd Müller
1, Christoph M Friedrich
1,5, Natalia Novac
3, Alexander Scheer
4,
Martin Hofmann-Apitius
1,2and Juliane Fluck
1*Abstract
Background:For selection and evaluation of potential biomarkers, inclusion of already published information is of utmost importance. In spite of significant advancements in text- and data-mining techniques, the vast knowledge space of biomarkers in biomedical text has remained unexplored. Existing named entity recognition approaches are not sufficiently selective for the retrieval of biomarker information from the literature. The purpose of this study was to identify textual features that enhance the effectiveness of biomarker information retrieval for different indication areas and diverse end user perspectives.
Methods:A biomarker terminology was created and further organized into six concept classes. Performance of this terminology was optimized towards balanced selectivity and specificity. The information retrieval performance using the biomarker terminology was evaluated based on various combinations of the terminology's six classes. Further validation of these results was performed on two independent corpora representing two different neurodegenerative diseases.
Results:The current state of the biomarker terminology contains 119 entity classes supported by 1890 different synonyms. The result of information retrieval shows improved retrieval rate of informative abstracts, which is achieved by including clinical management terms and evidence of gene/protein alterations (e.g. gene/protein expression status or certain polymorphisms) in combination with disease and gene name recognition. When additional filtering through other classes (e.g. diagnostic or prognostic methods) is applied, the typical high number of unspecific search results is significantly reduced. The evaluation results suggest that this approach enables the automated identification of biomarker information in the literature. A demo version of the search engine SCAIView, including the biomarker retrieval, is made available to the public through http://www.scaiview.com/scaiview-academia.html.
Conclusions:The approach presented in this paper demonstrates that using a dedicated biomarker terminology for automated analysis of the scientific literature maybe helpful as an aid to finding biomarker information in text. Successful extraction of candidate biomarkers information from published resources can be considered as the first step towards developing novel hypotheses. These hypotheses will be valuable for the early decision-making in the drug discovery and development process.
Keywords:Text-mining, Biomarker discovery, Information retrieval, Terminology
* Correspondence:[email protected]
1Department of Bioinformatics, Fraunhofer Institute for Algorithms and
Scientific Computing (SCAI), Schloss Birlinghoven, Sankt Augustin 53754, Germany
Full list of author information is available at the end of the article
Background
During the past years, high-throughput technologies have been extensively employed for the study of molecu-lar mechanisms underlying different diseases; this has led to the discovery of a large number of molecular bio-markers [1]. The US National Institutes of Health defines a biomarker as “a characteristic that is object-ively measured and evaluated as an indicator of normal biological processes, pathogenic processes or pharmaco-logical responses to a therapeutic intervention”[2].
Depending on representing molecular, physiological, or structural features, biomarkers show significant
diver-sity – spanning from genes, proteins, DNA, RNA, and
SNPs to blood cholesterol levels and patterns of brain abnormality. Due to such diverse coverage, ambiguity in defining biomarkers types and classes continues to exist [3-5].
Application of biomarkers, however, goes beyond dis-ease prediction and monitoring; in fact they have also been utilized throughout various stages of drug discov-ery and development [6]. For example, biomarkers play an important role in drug target discovery and validation (e.g. as quantitative readouts for candidate drugs) [7], in the monitoring of toxicity mechanisms (e.g. assessment of indication of unwanted side-effects) [8], and non-invasive imaging of diseased organs [9]. In the process of drug development, biomarkers are considered to be piv-otal for informed go/no-go decision-making in the early stages of drug development [10]. For example, mechan-istic biomarkers can be used to pre-clinically measure a drug's pharmacological activity in terms of its distribu-tion and interacdistribu-tion with a defined protein target. Such measurements help to decide whether to move forward to the next phase of clinical development.
A first step to finding supportive evidence for clinically important potential biomarkers is to search the accumu-lated data and knowledge generated from basic research [11]. For efficient exploration of the suspected large amount of biomarker information contained in the biomedical literature, semantic search and information retrieval systems are of utmost importance. The lar-gest publicly available biomedical literature resource, PubMed, makes use of MeSH (Medical Subject Head-ings) concepts to annotate the abstracts so that it maps these concepts to user queries and by this means allows for semantic search [12]. However, to search for reported biomarkers, (e.g. genes, proteins, or genetic variations) in a text corpus, additional annotation of these entities and their normalization to relevant data-bases is required. Such a search is currently not pro-vided by PubMed. Manual annotation is also time consuming and lags behind due to the ever abundance of new publications. For example, compiling a com-pendium of potential biomarkers for pancreatic cancer
was carried out by systematic manual curation of the literature and took over 7,000 person hours [13].
The automated identification of relevant terminology, a process known as Named Entity Recognition (NER), can support semantic annotation and information re-trieval. In the past years, several NER methods for the extraction of different biological entities have been developed, primarily focusing on the recognition of gene and protein names. In this regard, the BioCreAtIvE assessments present an overview about the state of vari-ous technologies and approaches in use [14-16]. NER approaches have already been used to support the identi-fication of biomarker genes. In [17], the authors applied gene and protein name recognition techniques to Med-line and OMIM (OnMed-line Mendelian Inheritance in Man) to identify potential serum biomarkers for Down syn-drome. Similarly, a named entity tagging approach was employed to search for prostate cancer biomarker candi-date genes in OMIM records [18]. Studies on biomarker relation extraction from text have considered the extrac-tion of semantic relaextrac-tions between diseases and genes or proteins [19,20]. In a recent study, an information ex-traction framework has been developed for the classifi-cation of biomarker sentences that showed favourable results, but the study was unfortunately focused on a small training set [21]. Moreover, biomarker information is often dispersed over the entire abstract, making it dif-ficult to reach high information recall with sentence classification systems.
The aim of this work is to analyze how information about potential biomarkers is expressed in the complete body of a scientific text, and identify additional textual features that are relevant for the retrieval of potential biomarker information from the scientific literature.
Methods
Information retrieval system and entity ranking
Our retrieval system is composed of two software com-ponents: the named entity recognition tool ProMiner and the knowledge discovery framework SCAIView [22,23]. Figure 1 shows the design overview of the bio-marker information retrieval system. ProMiner is one of the systems for gene normalization, which performed very well in BioCreAtIvE I and II assessments [24-26], reaching an F-score of 0.8 for the recognition and normalization of human genes and proteins. The ProMi-ner system has been designed for the semi-automated generation of dictionaries and the recognition of spelling variants, as well as the disambiguation of acronyms and common word synonyms.
Figure 1An overview of the biomarker retrieval system design.
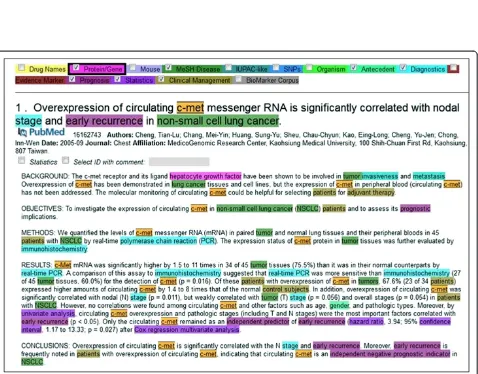
dictionaries. The resulting entity annotations are stored in an Apache Lucene(TM)-based search index, together with the documents and their meta-information. SCAI-View incorporates the Lucene-based index and allows for searches that include exact matches, wildcard options, and Boolean operations. The document visual-ization within SCAIView provides highlighting for all the entity classes with tooltips containing available linkouts, descriptions, and depictions (Figure 2).
The annotations are organized in the form of hierarch-ies (semantic trees) and can be navigated by the user via selecting full classes (e.g. ‘genes’ or ‘diseases’), selecting certain subclasses (e.g. ‘Nervous Systems Diseases’), or singular dictionary entries (e.g. ‘Alzheimer’s Disease’). For Boolean operations, either single entity class or complete tree classes could be selected. For example, the query “ ‘Alzheimer’s Disease’ AND ‘Evidence marker’ ” would retrieve all abstracts that contain one or more terms of both terminology classes. By selecting the Human Genes/Proteins, an entity table containing a list of the recognized genes and proteins in the selected cor-pus would be displayed (Figure 3).
The biomedical entities are ranked either by fre-quency or by relative entropy (in descending order of importance). The frequency ranking orders the entities with respect to the number of citations. The relative
entropy ranking is based on the Kullback–Leibler
di-vergence (also known as information gain) [27,28], and calculates the fraction between the documents contain-ing the entity in the result set and the total number of documents containing the entity in the complete Med-line document set. The formula for the relative entropy is given as:
RE p1ð ;p2Þ ¼p1⋅logp1
p2¼p1⋅ðlogp1logp2Þ
where p1is the number of abstracts containing the entity
in the query selected corpus and p2 denotes the total
number of documents in which the entity occurs within an unspecific reference corpus (i.e. the entire Medline).
The Kullback–Leibler divergence ranks those entities
high, which have especially high frequency in the selected corpus in comparison to the unspecific reference corpus. This means that frequently occurring entities do not re-ceive high ranks. For example, using the query“ ‘
Alzhei-mer’s Disease’ AND ‘Evidence marker’ AND ‘Human
Genes/Proteins’ ”, we retrieved 331 abstracts containing IL1B with a frequency ranking of 10. Conversely, accord-ing to the relative entropy formula, IL1B has an entropy rank of 34 despite its high occurrence in Medline (i.e. 40685 abstracts).
Corpus annotation and terminology generation
Five end users were asked to provide 50 relevant abstracts containing cancer or drug-related biomarker information. The abstracts were chosen from the follow-ing areas due to data availability and their current inter-est in treating cancer.
NSCLC (Non-Small Cell Lung Cancer) related, Breast cancer and predictive/prognostic, Met signaling and can-cer, EGFR related, Gefitinib related, and Erbitux related.
A training corpus of 289 abstracts was established (see Additional file 1 for PMIDs of the training abstracts), and two annotators (different from the end users) were asked to annotate 10 abstracts out of this corpus in a first step. The annotators manually marked all bio-marker information evidence that were perceived to be relevant (see Figure 2 for an example of automatic anno-tations). Instead of annotating the biomarkers them-selves (i.e. the gene, protein, or SNP mentions), the biomarker evidence was annotated and assigned to six classes. These classes were chosen based on the conven-tional classification of biomarker types as well as the dis-tribution analysis of the potential biomarker information in the literature. Subsequently, the following simple an-notation guideline was generated:
Clinical Management: annotate all terms indicating clinical investigations in patients, which includes the initial mentioning, the clinical study, and finally the treatment
Diagnostics: annotate all diagnostics that are used, which includes the initial disease stage, the molecular identification, and blood diagnostics
Prognosis: annotate all terms indicating any prognosis, outcome, or marker (e.g. clinical or biomarkers, adverse effects, resistance, response, disease progression or outcome)
Evidence marker: annotate all changes in gene and protein abundance, spanning from expression to mutation, SNP variations to phosphorylation status
Antecedent: annotate all risk factors mentioned for the relevant disease
Using this guideline, both annotators annotated 50 abstracts independently, and resulting agreement be-tween them was measured based on a kappa value. A kappa value measures the degree of confidence between the two annotators as follows [29]:
kappa¼ðPr að Þ Pr eð ÞÞ 1Pr eð Þ
ð Þ
where Pr(a) is the relative observed agreement among the raters and Pr(e) is the probability of random
agreement. The remaining abstracts were then annotated by one of the annotators.
Performance evaluation
For all evaluations, our search for Alzheimer’s disease (AD) or multiple sclerosis (MS) scenarios was expanded using MeSH synonyms and matches of the human gene/ protein dictionary. The ranked gene list provided by SCAIView was compared with the gold standard gene set that we obtained for AD and MS from the BIOBASE database [30]. This database contains manually curated literature evidence for causal and correlative associations of genes and proteins to human diseases. Both gold stan-dards were created by filtering property reports, based on the disease indication, and then importing the result-ing list of genes and proteins to a text file based on their supporting evidence (i.e. experimentally determined). To evaluate the performance, a gene enrichment ranking methodology adopted from the Gene Set Enrichment Analysis (GSEA) was applied [31]. The goal of the en-richment is to determine whether genes within the gold standard (gene set S) are randomly distributed through-out the ranked list of retrieved genes L (with length N) or primarily found at the top or bottom of the list. Com-puted score is the maximum deviation from zero when walking down the list of genes L that is increased by Xj =1 every time a gene in the list L is in S. Thus, the
enrichment score (ES) is calculated as:
ES¼max 1≤i≤N
Xi
j¼1 Xj
Knowing that the output of the retrieval system is a list of genes/proteins that are ranked according to their relative entropy scoring, different combinations of the biomarker terminology classes were applied. For all combinations, values of precision, recall and F-score were calculated. In order to compare the ranked gene list with the gold standard, the F-score criterion was used. An F-score is computed as the following:
Fscore¼2PrecisionRecall
PrecisionþRecall
ð Þ
where Precision is defined as TP/(TP+FP) and Recall is defined as TP/(TP+FN) [32], and TP = True Positive, FP = False positive, TN = True Negative (TN) and FN = False Negative (FN).
abstracts (the most recent publications), only the first ten abstracts were taken into account. Subsequently, and after manually checking of abstracts, the number of true positive and false positive biomarker abstracts was determined.
Results
Development of biomarker retrieval terminology
The training corpus containing cancer or drug-related biomarker information was pre-annotated using gene protein and disease named entity recognition. In the next step, we investigated if we could identify additional terminology relevant to biomarkers from the abstracts. Initially two annotators highlighted relevant parts in 10 abstracts and discussed the annotations. As a result, six terminology classes were defined representing the rele-vant content for biomarker identification (Table 1). Abstracts containing information about potential gene
biomarkers most often comprise evidence of gene or
protein alteration as well as indication words for the clinical management or investigation. Moreover,
diag-nostic methods and prognostic terms are found
frequently in these abstracts. Statistic evaluations
strengthen the relevance of biomarkers and in some casesantecedentsare strong indicators for disease status or therapy decisions (see Figure 2). Based on those ter-minology classes and a simple annotation guideline, all 10 abstracts were again annotated and discrepancies were discussed until a common understanding was reached between annotators. In the next step, the two annotators annotated 50 abstracts and the inter-annotator agreement was calculated. The kappa value of 0.81 showed that both annotators were in good agree-ment when annotating concepts represented by the six classes. Inconsistencies were mainly because of missed annotations (e.g. the concept ‘patient’ was annotated 3 times instead of 4 times in one abstract), boundary
dif-ferences (e.g. annotation of ‘management of patients’
versus annotation of ‘patients’) and some differences in
the annotation of diagnostic terms (e.g. the concept
‘Child’s score’ was only annotated by one annotator). Those differences were discussed and one annotator annotated the remaining abstracts.
All annotated terms in the training corpus were auto-matically extracted and integrated into a seed biomarker retrieval dictionary by manually assigning them to the six main classes. In the next step, the seed set was struc-tured, forming a seed terminology containing 76 entity classes with 1132 different synonyms. After extension of the terminology with similar classes and synonyms from MeSH and UMLS as well as expert knowledge for diag-nostic tests (after the analysis of larger disease- and biomarker-related text corpora), the biomarker retrieval terminology contained 119 entity classes with 1890 dif-ferent synonyms.
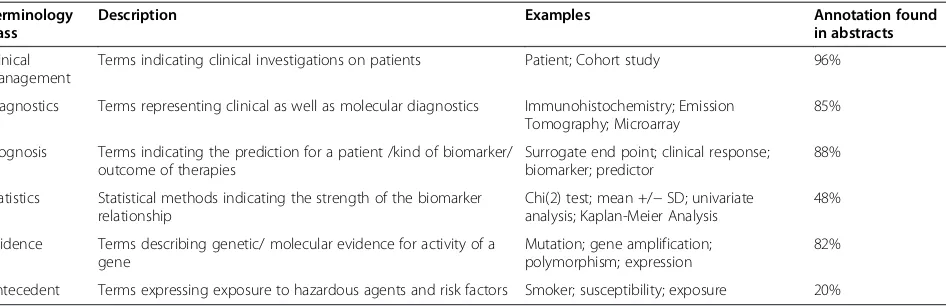
Distribution analysis of different biomarker classes in relevant text corpora (annotations in abstracts) showed that every training abstract contains at least one
bio-marker retrieval term. Moreover, Clinical Management
and Prognosis terms were found most frequently in the corpora, followed by Diagnostic, Evidence and Statistics
terms (see Table 1, last column). The Antecedent class
plays a minor role in the selected training data (recall of 20%), which might be quite different for diseases in which antecedents play a role in biomarker search. The six terminology classes are integrated into the SCAIView Demo server and can be accessed through http://www. scaiview.com/scaiview-academia.html.
Non-small cell lung carcinoma (NSCLC) as use case scenario
As a base line for biomarker candidate retrieval, selec-tion of the disease NSCLC in combinaselec-tion with the automated recognition of gene names in our retrieval system returns 10790 Medline abstracts mentioning at least one gene concept (2663 different gene entities in total). Without further specification, these numbers are far too high to inspect and the resulting abstracts and
Table 1 Biomarker retrieval terminology classes and coverage of the terminology in the annotated corpora
Terminology class
Description Examples Annotation found
in abstracts
Clinical Management
Terms indicating clinical investigations on patients Patient; Cohort study 96%
Diagnostics Terms representing clinical as well as molecular diagnostics Immunohistochemistry; Emission Tomography; Microarray
85%
Prognosis Terms indicating the prediction for a patient /kind of biomarker/ outcome of therapies
Surrogate end point; clinical response; biomarker; predictor
88%
Statistics Statistical methods indicating the strength of the biomarker relationship
Chi(2) test; mean +/−SD; univariate analysis; Kaplan-Meier Analysis
48%
Evidence Terms describing genetic/ molecular evidence for activity of a gene
Mutation; gene amplification; polymorphism; expression
82%
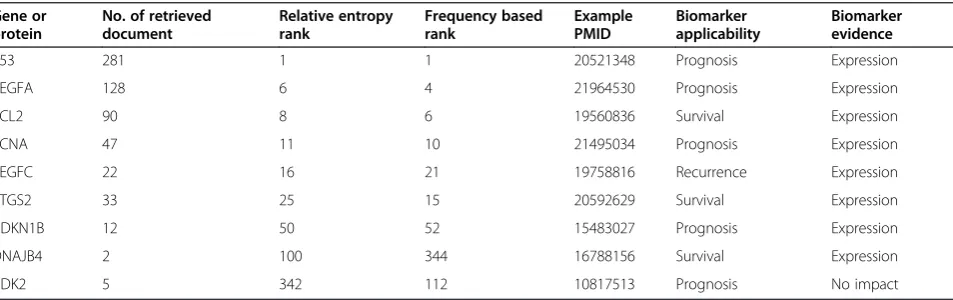
genes cover various aspects of NSCLC-gene relations not relevant for the search of NSCLC biomarker candi-dates. Putting additional restriction on the semantic search using the five biomarker retrieval classes (ignor-ing the class Antecedent) reduces the number of retrieved documents down to 1539, containing 877 genes. Further reduction to relevant genes is possible through the inclusion of frequency or relative entropy ranking thresholds. Ignoring all gene mentions occurring in less than 5 abstracts decreases the gene set to 126 genes. Spot checks of ten genes with low relative entropy values revealed that nine of these genes are true positive biomarker candidates (see Table 2).
One of the biomarker candidates is Mucin 1 for which 8 abstracts under the above- mentioned criteria were retrieved. Mucin 1 is involved in invasiveness, metasta-sis, and angiogenesis of NSCLC [33] and its expression and localisation in lung adenocarcinoma patients is altered compared to normal epithelial cells [34]. A fur-ther exemplified action using the biomarker retrieval ter-minology is the literature search for suitable Mucin-1 antibodies. This can be directly conducted by applying the biomarker retrieval terminology. Selection of the Diagnostic subclass Immunohistochemistry and the Evi-dence subclass Expression together with the NSLCL MeSH variants and the Mucin-1 gene concept retrieves 16 abstracts. In 11 abstracts immunostaining of Muc1 is directly stated but only 4 abstracts mention the specific antibodies (CA15-3, clone DF3 in PMID 17409826, HMFG2 in PMIDs 8980247, 2456176 and 1284790). A further analysis of the retrieved full text articles is neces-sary to retrieve in a next step all information about the antibodies utilized. Higher recall rates for different anti-bodies for this example could be reached with searches for a broader disease area likeLung Neoplasms(31 abstracts),
the search with the Diagnostic subclass
Immunohisto-chemistryin combination with the text search‘anti-Muc1’
(105 abstracts), or in combination with the gene
con-cept Muc1 and the Evidence marker Expression (1055
abstracts).
These examples demonstrate the ability of the bio-marker search engine - depending on the application area - to substantially increase recall or precision of the search results, maximizing the efficiency of public do-main literature searches.
Adaptation and evaluation of biomarker retrieval in neurodegenerative diseases area
To demonstrate the applicability of the biomarker re-trieval terminology in other disease indications inde-pendently of the oncology-focused training corpus, the performance of retrieval for biomarker-related abstracts from Medline was tested in the field of Alzheimer’s dis-ease and multiple sclerosis.
In a first test it became evident that the class
Diagnos-ticsshows a high diversity between cancer and
neurode-generative diseases and that this class has to be extended for the new disease areas. For instance, in the area of neurodegenerative diseases, we included the diagnostic imaging subtree of MeSH (after omitting microscopy and molecular imaging) and a number of very specific medical classification systems provided by experts (e.g. MS Functional Composite score). The final BioMarker terminology contains 164 classes and 2506 synonyms.
After this optimization for neurodegenerative diseases, in three evaluation steps we examined: i) to what extent biomarker class selection influences the biomarker gene enrichment in comparison to the content of independent
gold standards (entity retrieval); ii) how many
biomarker-enriched abstracts could be retrieved with the selection of our terminology (abstract retrieval); and iii) how far new biomarker genes/proteins information could be retrieved which are not provided by the gold standard (potential biomarker identification).
Table 2 Spot check of NSCLC genes/proteins for their relevance to biomarker applicability and evidence
Gene or protein
No. of retrieved document
Relative entropy rank
Frequency based rank
Example PMID
Biomarker applicability
Biomarker evidence
P53 281 1 1 20521348 Prognosis Expression
VEGFA 128 6 4 21964530 Prognosis Expression
BCL2 90 8 6 19560836 Survival Expression
PCNA 47 11 10 21495034 Prognosis Expression
VEGFC 22 16 21 19758816 Recurrence Expression
PTGS2 33 25 15 20592629 Survival Expression
CDKN1B 12 50 52 15483027 Prognosis Expression
DNAJB4 2 100 344 16788156 Survival Expression
CDK2 5 342 112 10817513 Prognosis No impact
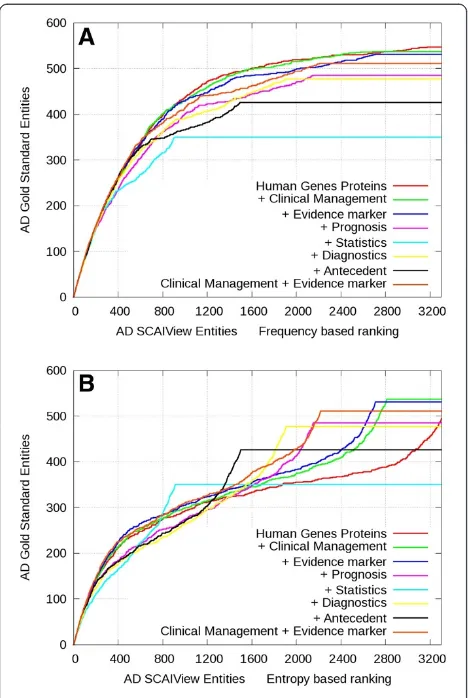
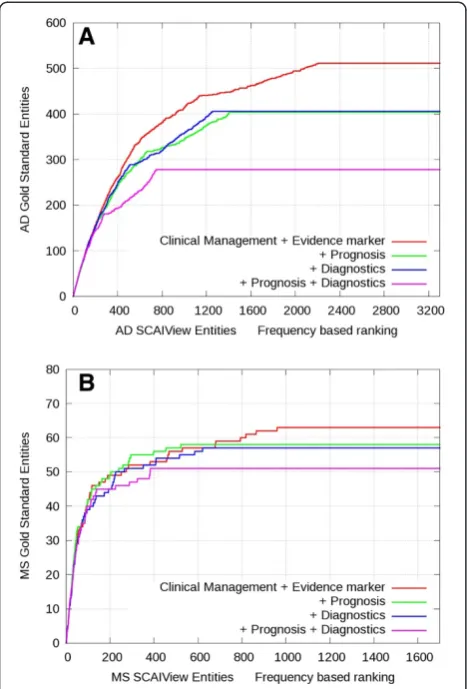
Using the gene enrichment ranking method and the se-lection ofHuman Genes/Proteins(our baseline approach), it turns out that almost all genes/proteins contained in the gold standard (95% for Alzheimer’s and 97% for multiple sclerosis) were covered by the results of our retrieval sys-tem (see Human Genes/Proteins in Figures 4 and 5).
The system was able to successfully extract candidate biomarker genes/proteins relevant to the queried dis-eases and both ranking methods performed well for high-ranking genes. Nevertheless, the baseline search returned over 3600 genes from more than 33000
abstracts for Alzheimer’s disease and over 2300 genes
from more than 12900 abstracts for multiple sclerosis. This amount of abstracts for manual inspection is
over-whelming. By additive selection of theClinical
Manage-ment or Evidence Markerclasses, it can be shown that the relevant biomarker candidate genes are retrieved at
higher ranks in both Alzheimer’s and multiple sclerosis contexts (Figure 4 and Figure 5). For all other classes, the slope of gene enrichment decreases at lower ranks
in comparison to selection of Human Genes/Proteins
alone. Overall, frequency-based ranking (Figure 4A and Figure 5A) seems to perform better than relative entropy-based ranking (Figure 4B and Figure 5B). Al-though frequency-based ranking leads to higher gene enrichment slope between the ranks 300 and 1500, we observe a stronger enrichment at low ranking positions using relative entropy-based ranking. Analysis of those
low ranking but frequent genes in Alzheimer’s disease
and multiple sclerosis shows that the high number of cytokines and inflammatory proteins are mere indicators of the disease. The frequency of those genes in the whole Medline is very high and for this reason they are under-represented in the specific corpus.
Figure 4Comparative gene enrichment plots for gene/protein entities retrieved in the context of AD.Genes were ranked based on frequency (A) or relative entropy (B) and evaluated against the Alzheimer’s genes/proteins gold standard. The red color represents the retrieval of all abstracts containing human genes/proteins. The other color codings indicate the retrieval rate after additive inclusion of further terminology classes.
Using an AND combination of three or more termin-ology classes leads to similar enrichment slopes for higher ranks but with reduced recall (Figure 6). When compared to the MS gold standard, the combination of
classes Clinical Management, Evidence Marker and
Prognosis or Diagnosis performs even better than Clin-ical Management and Evidence Marker alone but loses some recall at lower ranks.
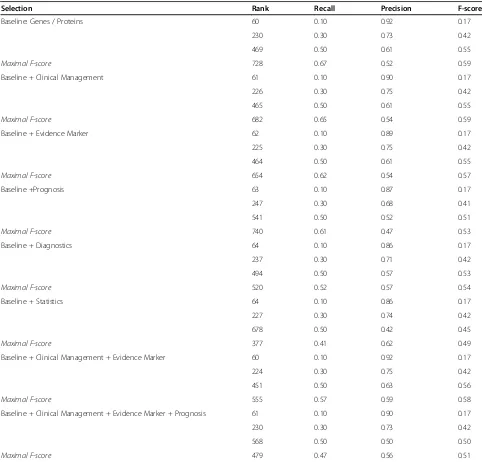
For Alzheimer’s disease, we analyzed the outcome of
the frequency based ranking method and calculated the precision, F-score and rank for different recall ranges (10%, 30%, and 50% recall) and determined the maximal
F-score (see Table 3). For the classes Clinical
Manage-ment and Evidence Marker as well as for the combined selection of both classes, the values are similar but the
maximal F-score (0.59 forGenes/Proteinsalone and 0.58
for the combination) is reached at lower ranking posi-tions (rank 555 for the combination instead of rank 728
for Genes/Proteins alone). For recall value of 0.3, the precision is similar for all selections even with the
com-bination of the classes Clinical Management, Evidence
Marker and Prognosis. At recall value of 0.5, the preci-sion drops down to 0.5, otherwise 0.63 if the class Prog-nosis is not selected; moreover, the maximal F-score
looses 7% in comparison toGenes/Proteinsalone.
The analysis of the retrieved abstracts for the first 10 ranked genes implies that the combination of different
biomarker classes (Clinical Management and Evidence
Marker alone or together with Diagnostics and Progno-sis) leads to a reduction in the number of abstracts but to an increase in the number of remaining ones (Figure 7). At this point, the user has to decide about the trade-off between recall and precision. For genes with a high num-ber of references (e.g. APP or APOE) a more stringent selection of abstracts is favorable, whereas for genes with a lower number of references a less restrictive search strategy might be beneficial.
Analysis of novel candidates as potential biomarkers
Genes retrieved by the selection ofClinical Management
and Evidence Marker classes and not mentioned in the AD gold standard were checked manually by a biologist
using the SCAIView environment. Such genes/proteins
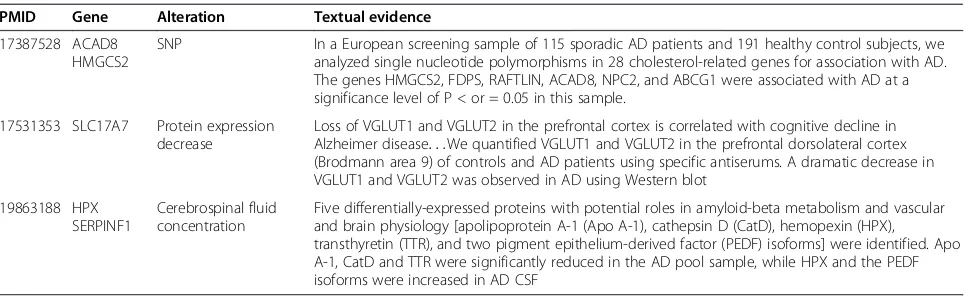
might be valuable for identification of novel biomarkers because they represent the yet-to-be identified biomar-kers whereas those already matched with the gold stand-ard are candidates that are better known as potential indicators of the disease. For this purpose, the abstracts must contain at least the information of the gene, which is altered (e.g. overexpression or mutation) in a particu-lar state of AD and their therapeutic response state. Examples of such information with the corresponding PMIDs are given in Table 4.
For AD, out of 400 genes, 158 genes/proteins had at least one evidence in the literature as being a potential biological indicator of Alzheimer’s disease and thus were considered as true positives (~ 40%) whereas 241 genes/ proteins were recognized by the annotator as false posi-tive genes (~ 60%) due to the lack of relevance to either Alzheimer’s disease or biomarkers (Table 5).
Discussion
Protein biomarkers are required for informed decision-making in drug discovery and development. In order to evaluate and prioritize potential biomarkers, a systematic literature search is the first step. Abstracts containing in-formation about potential gene biomarkers most often comprise evidence of gene or protein alteration as well as indication words for the clinical investigations. More-over, diagnostic methods and prognostic terms are found frequently in these abstracts. Automated recognition of gene names, co-occurrence search with disease names
and their statistical ranking serve as a baseline for bio-marker search.
Using our baseline approach, it turns out that almost all genes/proteins contained in the gold standard were covered by the results of our retrieval system. The sys-tem was able to successfully extract biomarker genes/ proteins relevant to the queried diseases and both rank-ing methods performed well for high-rankrank-ing genes. Nevertheless, the baseline search returned over 3600 genes from over 33000 abstracts for Alzheimer’s disease and over 2300 genes from more than 12900 abstracts for multiple sclerosis. This amount of abstracts for manual
inspection is overwhelming. Making use of the bio-marker retrieval terminology developed here results in the significant reduction of the number of extracted genes and documents with almost no loss in the gene enrichment, especially for high-ranking genes. This indi-cates that inclusion of more biomarker classes in the search query helps to narrow down the retrieval results by adding more restrictive context to the search.
Concerning the statistical ranking of the result set, the frequency-based ranking method performs better than the relative entropy-based ranking for biomarker gene enrichment of the diseases investigated in this study. Table 3 Performance evaluation for Alzheimer’s disease
Selection Rank Recall Precision F-score
Baseline: Genes / Proteins 60 0.10 0.92 0.17
230 0.30 0.73 0.42
469 0.50 0.61 0.55
Maximal F-score 728 0.67 0.52 0.59
Baseline + Clinical Management 61 0.10 0.90 0.17
226 0.30 0.75 0.42
465 0.50 0.61 0.55
Maximal F-score 682 0.65 0.54 0.59
Baseline + Evidence Marker 62 0.10 0.89 0.17
225 0.30 0.75 0.42
464 0.50 0.61 0.55
Maximal F-score 654 0.62 0.54 0.57
Baseline +Prognosis 63 0.10 0.87 0.17
247 0.30 0.68 0.41
541 0.50 0.52 0.51
Maximal F-score 740 0.61 0.47 0.53
Baseline + Diagnostics 64 0.10 0.86 0.17
237 0.30 0.71 0.42
494 0.50 0.57 0.53
Maximal F-score 520 0.52 0.57 0.54
Baseline + Statistics 64 0.10 0.86 0.17
227 0.30 0.74 0.42
678 0.50 0.42 0.45
Maximal F-score 377 0.41 0.62 0.49
Baseline + Clinical Management + Evidence Marker 60 0.10 0.92 0.17
224 0.30 0.75 0.42
451 0.50 0.63 0.56
Maximal F-score 555 0.57 0.59 0.58
Baseline + Clinical Management + Evidence Marker + Prognosis 61 0.10 0.90 0.17
230 0.30 0.73 0.42
568 0.50 0.50 0.50
Maximal F-score 479 0.47 0.56 0.51
One explanation is that the relative entropy penalizes genes/proteins common to many investigations/publica-tions and these entities rank at the end of the relevancy list, although they show a high frequency for the disease in question. Another explanation might lay in the select-ive annotation of entities by annotators of the external AD and MS gold standards; if annotators have selected the most frequent genes for annotation, the gold stand-ard has a bias towstand-ards frequency ranking.
Evaluation of retrieved genes not existing in the gold standard for AD showed that almost half of these genes have probably the potential of being considered as poten-tial biomarkers. This indicates that automated text mining using the biomarker terminology combinations increases recall for biomarker information retrieval and makes it possible to explore the biomarker space efficiently.
Comparing the number of retrieved entities between AD and MS shows that the biomarker information for
each specific disease is distributed differently over the literature corpora. Thus, to obtain the optimum results, the search strategy should be adapted to each disease of interest; however, combining more general queries with the Statistics and/or Prognosis classes results in more stringent outputs in terms of biomarker specificity, sen-sitivity, and predictive parameters. For the purpose of new biomarker identification, it is more suitable to use less stringent combinations, which results in higher re-call. In this case, the relative entropy-based ranking method can increase the likelihood of finding proper evi-dence in the support of a novel biomarker. For new dis-ease areas, it is necessary to update the terminology
especially for the class Diagnostics which shows the
highest diversity of terminology in different disease areas. One possibility to improve the generalisation of the terminology would be to include all diagnostic classes from publicly available terminology resources.
Figure 7Proportion of retrieved abstracts containing biomarker information for Alzheimer’s disease.The red color represents the retrieval of all abstracts containing human genes/proteins. The other color codings indicate the retrieval rate after additive inclusion of further terminology classes.
Table 4 Examples of articles accepted to contain biomarker information
PMID Gene Alteration Textual evidence
17387528 ACAD8 HMGCS2
SNP In a European screening sample of 115 sporadic AD patients and 191 healthy control subjects, we analyzed single nucleotide polymorphisms in 28 cholesterol-related genes for association with AD. The genes HMGCS2, FDPS, RAFTLIN, ACAD8, NPC2, and ABCG1 were associated with AD at a significance level of P < or = 0.05 in this sample.
17531353 SLC17A7 Protein expression decrease
Loss of VGLUT1 and VGLUT2 in the prefrontal cortex is correlated with cognitive decline in Alzheimer disease. . .We quantified VGLUT1 and VGLUT2 in the prefrontal dorsolateral cortex (Brodmann area 9) of controls and AD patients using specific antiserums. A dramatic decrease in VGLUT1 and VGLUT2 was observed in AD using Western blot
19863188 HPX SERPINF1
Cerebrospinal fluid concentration
Five differentially-expressed proteins with potential roles in amyloid-beta metabolism and vascular and brain physiology [apolipoprotein A-1 (Apo A-1), cathepsin D (CatD), hemopexin (HPX), transthyretin (TTR), and two pigment epithelium-derived factor (PEDF) isoforms] were identified. Apo A-1, CatD and TTR were significantly reduced in the AD pool sample, while HPX and the PEDF isoforms were increased in AD CSF
However, this might lead to a decline in retrieval preci-sion. Additionally, some medical diagnosis scores are very specific and often do not occur in the large publicly available resources such as MeSH and UMLS.
The flexibility of the biomarker terminology in relation to different query formulations and different biomarker classes should be tested in future investigations.
Conclusions
The work presented in this paper is a first step towards developing a search engine for literature-based retrieval and in-silico validation of biomarker candidates. It was shown that the development and application of a dedi-cated biomarker terminology could enhance the retrieval performance significantly through combined search for genes and selected classes of the biomarker retrieval ter-minology. The experimental results, obtained in the course of this study, demonstrate the effectiveness of the proposed approach that provides a foundation in seman-tic indexing and retrieval.
Additional file
Additional file 1:List of the PMIDs of the abstracts used for evaluation of the system.
Abbreviations
MeSH: Medical Subject Headings; NER: Names Entity Recognition; OMIM: Online Mendelian Inheritance in Man; UMLS: Unified Medical Language System; NSCLC: Non-Small-Cell Lung Carcinoma; AD: Alzheimer’s Disease; MS: Multiple Sclerosis; PMID: PubMed Identifier.
Competing interests
The authors declare that they have no competing interests.
Authors’contributions
EY carried out text annotations, participated in the terminology design, contributed to evaluations and drafted the manuscript. LT contributed to the study conception and design as well as data acquisition and analysis. BM carried out statistical analyses and maintained the softwares. CMF revised the results critically. NN participated in the design of the study, coordinated the expert annotations, and provided the use case scenario. AS conceived of the study. MHA participated in the design of the study, verified the terminology and revised the paper critically. JF participated in the design of the study and analysis of the results, coordinated the study, participated in evaluations and helped to draft the manuscript. All authors read and approved the final manuscript.
Acknowledgements
We wish to thank Caroline Kant from Merck Serono for her support and discussion in the generation of the terminology and Merck Serono experts for delivering the annotations. We would like to acknowledge Heinz Theodor Mevissen from Fraunhofer SCAI for ProMiner support, BIOBASE KL for disclosure of details in the article, and Dr. Karl Kirschner for proofreading the manuscript.
Author details 1
Department of Bioinformatics, Fraunhofer Institute for Algorithms and Scientific Computing (SCAI), Schloss Birlinghoven, Sankt Augustin 53754, Germany.2Bonn-Aachen International Center for Information Technology (B-IT), University of Bonn, Bonn, Germany.3Knowledge Management,
Operational Excellence & Site Coordination, Merck Serono, Merck KGaA, Darmstadt, Germany.4Informatics & Knowledge Management, Merck Serono,
Merck KGaA, Geneva, Switzerland.5Department of Computer Science, University of Applied Science and Arts, Dortmund, Germany.
Received: 3 February 2012 Accepted: 10 December 2012 Published: 18 December 2012
References
1. Ghosh D, Poisson LM:Omics data and levels of evidence for biomarker discovery.Genomics2009,93:13–16.
2. Group BDW:Biomarkers and surrogate endpoints: preferred definitions and conceptual framework.Clin Pharmacol Ther2001,69:89–95. 3. Perera FP, Weinstein IB:Molecular epidemiology: recent advances and
future directions.Carcinogenesis2000,21:517–524.
4. Mayeux R:Biomarkers: potential uses and limitations.NeuroRx2004,
1:182–188.
5. Timbrell J:Types of biomarker and challenges for new biomarkers.Toxicol Lett2006,164(Suppl 1):S315.
6. Altar CA:The biomarkers consortium: on the critical path of drug discovery.Clin Pharmacol Ther2008,83:361–364.
7. Wagner JA:Strategic approach to fit-for-purpose biomarkers in drug development.Annu Rev Pharmacol Toxicol2008,48:631–651. 8. Marrer E, Dieterle F:Impact of biomarker development on drug safety
assessment.Toxicol Appl Pharmacol2010,243:167–179.
9. Bakhtiar R:Biomarkers in drug discovery and development.J Pharmacol Toxicol Methods2008,57:85–91.
10. Hurko H, Jones GK:Valuation of biomarkers.Nat Rev Drug Discov2011,
10:253–254.
11. Ongenaert M, Dehaspe L:Integrating automated literature searches and text mining in biomarker discovery.BMC Bioinforma2010,11(Suppl 5):O5. 12. Krallinger M, Valencia A:Text-mining and information-retrieval services for
molecular biology.Genome Biol2005,6:224.
13. Harsha HC, Kandasamy K, Ranganathan P, Rani S, Ramabadran S, Gollapudi S, Balakrishnan L, Dwivedi SB, Telikicherla D, Selvan LDN, Goel R, Mathivanan S, Marimuthu R, DeCaprio JA, Srivastava S, Hanash SM, Htuban RH, Pandey A:A compendium of potential biomarkers of pancreatic cancer.PLoS Med2009,6:e1000046.
14. BioCreAtIvE workshop. [http://www.biocreative.org].
15. Blaschke C, Hirschman L, Valencia A, Yeh A:A critical assessment of text mining methods in molecular biology.BMC Bioinforma2004,
6(Suppl 1):S1–S23.
16. Hirschman L, Krallinger M, Wilbur J, Valencia A:The BioCreAtIvE II - critical assessment for information extraction in biology challenge.Genome Biol 2008,9(Suppl 2):S1–S14.
17. Pennings JL, Koster MP, Rodenburg W, Schielen PC, de Vries A:Discovery of novel serum biomarkers for prenatal down syndrome screening by integrative data mining.PLoS One2009,4:e8010.
18. Deng X, Geng H, Bastola DR, Ali HH:Link test–a statistical method for finding prostate cancer biomarkers.Comput Biol Chem2006,30:425–433. 19. Bundschus M, Dejori M, Stetter M, Tresp V, Kriegel HP:Extraction of
semantic biomedical relations from text using conditional random fields.
BMC Bioinforma2008,9:207.
20. Elkin PL, Tuttle MS, Trusko BE, Brown HB:BioProspecting: novel marker discovery obtained by mining the bibleome.BMC Bioinforma2009,
10(Suppl 2):S9.
21. Islam MT, Shaikh M, Nayak A, Ranganathan S:Biomarker Information Extraction Tool (BIET) development using natural language processing and machine learning. InProceedings of the International Conference and Workshop on Emerging Trends in Technology: 26–27 February 2010. Edited by
Table 5 Evaluation of genes not found in AD gold standard but retrieved using the biomarker terminology
No. of genes/ proteins retrieved by SCAIView but not contained in gold standard
No. of genes with at least one biomarker evidence in Medline
No. of abstracts with lack of relevance either to the disease or to being a biomarker
Mishra BK, Kekre HB, Thampi GT, Gharpure P, Mukherji A, Lohani RB. Mumbai: ICWET; 2010:121–126.
22. Friedrich CM, Dach H, Gattermayer T, Engelbrecht G, Benkner S, Hofmann-Apitius M:@neuLink: a service-oriented application for biomedical knowledge discovery. InProceedings of HealthGrid 2008; 2–4 June 2008. Edited by Solomonides T, Silverstein JC, Saltz J, Legre Y, Kratz M, Foster I, Breton V, Beck JR. Chicago: IOS Press; 2008:165–172.
23. Benkner S, Arbona A, Berti G, Chiarini A, Dunlop R, Engelbrecht G, Frangi AF, Friedrich CM, Hanser S, Hasselmeyer P, Hose RD, Iavindrasana J, Köhler M, Iacono LL, Lonsdale G, Meyer R, Moore B, Rajasekaran H, Summers PE, Wöhrer A, Woods S:@neurIST: infrastructure for advanced disease management through integration of heterogeneous data, computing, and complex processing services.IEEE Trans Inf Technol Biomed2010,
14:1365–1377.
24. Hanisch D, Fluck J, Mevissen HT, Zimmer R:Playing biology's name game: identifying protein names in scientific text.Pac Symp Biocomput2003,
8:403–14.
25. Hanisch D, Fundel K, Mevissen HT, Zimmer R, Fluck J:ProMiner: rule based protein and gene entity recognition.BMC Bioinforma2005,6(Suppl 1):S14. 26. Morgan AA, Lu Z, Wang X, Cohen AM, Fluck J, Ruch P, Divoli A, Fundel K,
Leaman R, Hakenberg J, Sun C, Liu HH, Torres R, Krauthammer M, Lau WW, Liu H, Hsu CN, Schuemie M, Cohen KB, Hirschman L:Overview of BioCreAtIvE II gene normalization.Genome Biol2008,9:S3.
27. Kullback S, Leibler R:On information and sufficiency.Ann Math Stat1951,
22:79–86.
28. Büttcher S, Clarke CLA, Cormack GV:Information retrieval: implementing and evaluating search engines.Cambridge, Mass. MIT Press, 296–298. 29. Smeeton NC:Early history of the kappa statistic.Biometrics1985,41:795. 30. BIOBASE BKL Proteome database. [http://www.biobaseinternational.com/
index.php?id=proteomedatabases].
31. Subramanian A, Tamayo P, Mootha VK, Mukherjee S, Ebert BL, Gillette MA, Paulovich A, Pomeroy SL, Gloub TR, Lander ES, Mesirov JP:Gene set enrichment analysis: a knowledge-based approach for interpreting genome-wide expression profiles.Proc Natl Acad Sci2005,
102:15545–15550.
32. Goutte C, Gaussier E:A probabilistic interpretation of precision, recall and F-score, with implication for evaluation.Advances in Information Retrieval. Lecture Notes in Computer Science2005,3408:345–59.
33. Szabo E:MUC1 expression in lung cancer. InLung Cancer, Methods in Molecular Medicine. 3rd edition. Edited by Driscoll B. New Jersey: Humana Press; 2003:251–258. Volume 74.
34. Petty RD, Nicolson MC, Kerr KM, Collie-Duguid E, Murray GI:Gene expression profiling in non-small cell lung cancer, from molecular mechanisms to clinical application.Clin Cancer Res2004,10:3237.
doi:10.1186/1472-6947-12-148
Cite this article as:Younesiet al.:Mining biomarker information in biomedical literature.BMC Medical Informatics and Decision Making2012 12:148.
Submit your next manuscript to BioMed Central and take full advantage of:
• Convenient online submission
• Thorough peer review
• No space constraints or color figure charges
• Immediate publication on acceptance
• Inclusion in PubMed, CAS, Scopus and Google Scholar
• Research which is freely available for redistribution