R E S E A R C H A R T I C L E
Open Access
The validation of a new measure quantifying the
social quality of life of ethnically diverse older
women: two cross-sectional studies
Luciana Laganà
1*, Maria L Bratly
1and Ioakim Boutakidis
2Abstract
Background:To our knowledge, the available psychometric literature does not include an instrument for the quantification of social quality of life among older women from diverse ethnic backgrounds. To address the need for a tool of this kind, we conducted two studies to assess the initial reliability and validity of a new instrument. The latter was created specifically to quantify the contribution of a) social networks and resources (e.g., family, friends, and community) as well as b) one’s perceived power and respect within family and community to subjective well-being in non-clinical, ethnically diverse populations of older women.
Methods:In Study 1, we recruited a cross-sectional sample of primarily non-European-American older women (N= 220) at a variety of community locations. Participants were administered the following: a short screener for
dementia; a demographic list; an initial pool of 50 items from which the final items of the new Older Women’s Social Quality of Life Inventory (OWSQLI) were to be chosen (based on a statistical criterion to apply to the factor analysis findings); the Single Item Measure of Social Support (SIMSS); and the Medical Outcome Study 36-item Short-Form Health Survey (MOS SF-36). Study 2 was conducted on a second independent sample of ethnically diverse older women. The same recruitment strategies, procedures, and instruments as those of Study 1 were utilized in Study 2, whose sample was comprised of 241 older women with mostly non-European-American ethnic status.
Results:In Study 1, exploratory factor analysis of the OWSQLI obtained robust findings: the total variance explained by one single factor with the final selection of 22 items was over 44%. The OWSQLI demonstrated strong internal consistency (a= .92, p< .001), adequate criterion validity with the SIMSS (r= .33;p < .01), and (as expected) moderate concurrent validity with the MOS SF-36 for both physical (r= .21;p < .01) and mental (r= .26; p< .01) quality of life. In order to confirm the validity of the 22-item OWSQLI scale that emerged from Study 1 analyses, we replicated those analyses in Study 2, although using confirmatory factor analysis. The total variance accounted for by one factor was about 42%, again quite high and indicative of a strong single-factor solution. Study 2 data analyses yielded the same strong reliability findings (i.e.,a= .92, p< .001). The 22-item OWSQLI was correlated with the SIMSS (r= .27,p < .001) in the expected direction. Finally, correlations with the MOS SF- 36 demonstrated moderate concurrent validity for physical (r= .14;p < .01) and mental (r= .18;p< .01) quality of life, as expected.
Conclusions:The findings of these two studies highlight the potential for our new tool to provide a valid measure of older women’s social quality of life, yet they require duplication in longitudinal research. Interested clinicians should consider using the OWSQLI in their assessment battery to identify older women’s areas of lower versus higher social quality of life, and should establish the maximization of patients’ social quality of life as an important therapeutic goal, as this variable is significantly related to both physical and mental health.
* Correspondence: [email protected] 1
Department of Psychology, California State University Northridge, 18111 Nordhoff Street, Northridge, California, USA
Full list of author information is available at the end of the article
Background
The growing diversity of aging populations and corre-sponding expectations of successful aging have moti-vated multidisciplinary investigations of quality of life (abbreviated as QofL herein). Several researchers have highlighted the need to develop assessment tools to properly quantify psychosocial variance in older age [1-4]. Research on social facets of QofL in later life may contribute to an increased understanding of protective social resources that could enhance the biopsychosocial health of older adults. In turn, this process could assist in addressing the aging population’s health care impact on public resources, leading to a more cost-effective use of the health care system [5-7]. The social QofL of older women in particular should be a topic of focused inves-tigation because this population, compared to older men, typically seeks medical help more often, experi-ences less than adequate assistance with basic life activ-ities, and reports fewer financial resources [8-10]. Considering the aforementioned disadvantages, maxi-mizing older women’s social QofL (assessed using a methodologically appropriate measure) is critical.
The focus of the present research is the initial valida-tion of a new social QofL tool, which is intended for use with older women from diverse ethnic backgrounds. Ethnic minorities in general are understudied in QofL research for a variety of reasons. Several researchers have identified factors such as low socioeconomic status [11,12] (a characteristic of many ethnically diverse older women [10]) and limited English-language proficiency [13] as barriers to the inclusion of ethnic minority groups in QofL studies. Also, scarcity of culturally-com-petent (preferably same-culture) researchers is often problematic [14]. In addition, older women’s limited financial means can present difficulties regarding trans-portation to research sites [15]. We have minimized these challenging issues in the current research, as described in the Methods section. There is ample evi-dence on the contribution of social variables (such as the need to feel loved [16,17] as well as respected and valued by others [18,19]) to the well-being of older women (and men). Many such issues hold unique rele-vance among older individuals from ethnic minority backgrounds due to the emphasis placed upon family, friends, and the community at large, as they typically favor a collectivistic orientation [20].
In research on older women, a satisfying social life has been related to better physical health. For instance, in a study on 471 women over the age of 60 living with car-diac disease, respondents in recovery from carcar-diac events who had satisfactory social resources displayed fewer depressive symptoms and better coping skills [21]. Moreover, those who reported greater social support
exhibited enhanced emotional well-being, lower symp-tom impact, and greater perceived health. Social net-works could produce satisfying and trusting relationships with family and close friends and, impor-tantly, enhance older women’s ability to compensate for physical functioning deficits by reducing levels of dis-tress [23]. Indeed, mental health is significantly related to satisfaction with one’s social life and resources. Numerous studies have confirmed the positive role of social support, integration, and engagement in providing psychosocial benefits for improved mental well-being and QofL in later life [5,24-26]. Additionally, Jang, Haley, Small, and Mortimer [22], in a study of 406 women (60 years old and older) diagnosed with cardiac disease, discovered that social resources enhanced psy-chological resilience. Social integration may also protect older adults from cognitive decline by positively influen-cing social competence and mood [27]. Furthermore, emotional and social expectations attached to social interactions afford a perception of continued value, meaningful connections to others, and emotional sup-port for reassurance and affection, which contribute to morale and satisfaction in older age [28,29]. In addition, social resources are associated with enhanced feelings of self-esteem, which may strengthen older adults’coping skills and lessen the impact of negative life events, losses, and functional decline [22,30].
The Need for a Measure of Older Women’s Social QofL
assessing social QofL in the target population of the present research.
Researchers Must Be Able to Discriminate Between Physical and Social QofL
Most of the commonly used measures confound socio-emotional QofL with physical/medical health. For exam-ple, the utilization of the Medical Outcome Study 36-Item Short-Form Health Survey (MOS SF-36)[32] allows the quantification of both physical and mental health components of QofL. While researchers who implemen-ted this measure have reporimplemen-ted good sensitivity as well as cross-cultural generalizability [33-35], the MOS SF-36 was constructed mainly to quantify limitations in social (and other) activities caused by health problems, thus confounding general health status and functional loss with QofL. Similarly, the Quality of Life Index - Generic Version (QLI)[36] and theWorld Health Organization’s QofL assessment (WHOQofL-100)[37] confound social aspects of QofL (such as social and family functioning) with health status.
Assessment Tools Must Allow Generalization of Findings to Non-Clinical Populations
Measures designed specifically for use with clinical populations (including individuals with acute mental dis-orders or medical diagnoses) may not be sensitive to minor changes in status within non-clinical populations. To offer an example, one of the earliest QofL assess-ments, the Spitzer QL-Index [38] has been shown to effectively assess general health, social support, and psy-chological outlook. However, this assessment tool was validated on cancer patients in palliative care. A scale designed to be relevant to individuals with terminal ill-ness may not be sufficiently discriminatory or applicable to healthy–or relatively healthy–populations. Similarly, the 46-itemSchedule for the Evaluation of Individual Quality of Life (SEIQoL) [39] and the SEIQoL-DW15 -item version [40] were originally created to assess QofL in palliative care settings. Although empirical evidence seems to indicate that both measures are psychometri-cally sound, the appropriateness of their application for routine use in non-palliative care settings or with indivi-duals without serious illness is dubious [41]. Similar cri-ticism can be applied to theNottingham Health Profile (NHP)[42] and the Quality of Well-Being Scale (QWS)
[43,44], which primarily assess the impact of disease and illness, making their applicability to fairly healthy popu-lations questionable.
Measures Need to Be Validated on Ethnically Diverse Older Adult Populations
Few QofL measures have been explicitly normalized or psychometrically validated on ethnically diverse
populations, which limits their external validity. Indeed, researchers have challenged assumptions of the univers-ality of health-related assessment tools such as the MOS SF-36 [45]. In particular, Staniszewska, Ahmed, and Jen-kinson discovered that cultural influences in White and Indian cardiac patients’ descriptions of their physical health were similar, yet greater avoidance of terms such as“mental”and“emotional”surfaced among Indian par-ticipants. Additionally, different religious perceptions affected the interpretation of disease by these two groups. Deyo conducted a study [46] comparing the ori-ginal English language version of the Sickness Impact Profile (SIP) [47] (a well-established self-report measure of physical QofL/functional health status) to a Spanish language version within a sample of non-Hispanic and Mexican-American participants with low back pain. The SIP produced results with English-speaking individuals that seemed highly valid, while findings for Mexican-American participants who used the English language SIP measure were poor. Mexican-American patients using the Spanish version of the SIP obtained the poor-est results. This suggpoor-ests that simply producing an ade-quate translation of the SIP does not address culturally unique responses to symptoms, such as the reluctance of some cultures to answer personal questions and the general effects that acculturation may produce in the comfort level experienced by individuals responding to scale items [45].
social aspects of QofL. However, although it has been administered to older populations, it was not designed for older adults or older women in particular. Further-more, all of the studies that we were able to identify on this scale covered clinical populations that presented some form of mental illness or disability [50-52].
The Social QofL Measure Proposed Herein
The literature summarized above regarding available tools for the assessment of social QofL demonstrates a gap in the psychometric research on this topic concern-ing non-clinical populations of older women. An instru-ment constructed specifically for use with community-dwelling, ethnically diverse older women is critical to capturing the impact of familial and community support systems on these women’s QofL, as well as their percep-tion of power, respect, understanding, and honor within their family and community–all of which are concepts that are critical to social well-being in older age, as mentioned earlier. Before describing our two studies on this measure, it is appropriate to briefly illustrate their conceptual foundations. In a classic theorization (adopted as the conceptual framework of the present research), Engel [53,54] argued that the boundaries between health and disease are intertwined with social, medical, and psychological factors. Thus, one’s percep-tion of social well-being represents an essential compo-nent of health and should not be neglected in research; based on this theoretical approach, we compiled original items that could best assess social QofL in older women from diverse ethnic backgrounds. We focused on includ-ing in this measure items coverinclud-ing topics that emerged from the review of the existing literature on older women’s social resources, particularly aspects of life related to their social ties (with family, extended family, friends, peers, neighbors, church members, and the community at large) that have been associated with QofL, yet not assessed via a single measure.
It should be noted that the new instrument proposed herein does not assess health-related QofL (to avoid confounding social QofL with health status), unlike most of the aforementioned tools such as the MOS SF-12/36, the QLI, the SIP, and the NHP, among others. Our social QofL measure quantifies instead the percep-tions and reacpercep-tions of older women to several facets of their environment (e.g., social and emotional). A similar conceptual framework provided the foundation for the
Life Satisfaction in the Elderly Scale[55,56]. However, the latter scale is not gender-specific and confounds health status with QofL. To our knowledge, our new measure is the first tool created specifically to assess community-dwelling older women’s social QofL beyond health status. We hypothesized that, in both studies, the new instrument would show strong factor analysis,
reliability, and initial validity findings. Concerning the latter, we expected that scores on our measure would be moderately related to the size of respondents’ support network. Moreover, we anticipated a significant relation-ship between social QofL and both kinds of QofL that have been most commonly targeted in prior studies, i.e., physical and mental. However, only a modest associa-tion with these two facets of QofL was hypothesized, given the specific social focus of the new tool.
Methods
Sample Characteristics
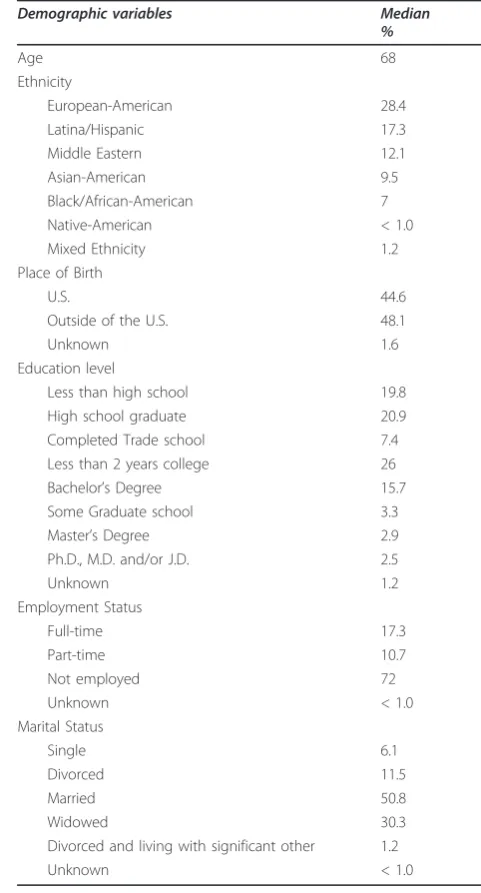
The ethnically diverse sample of Study 1 consisted of 220 older women who resided in several urban and suburban communities in Los Angeles County; each respondent self-identified as a member of one of seven ethnic/pan-ethnic groups. The demographic characteristics of the sample are displayed in Table 1. Participants ranged in age from 60 to 97 years, with a reported median age of 71 and an inter-quartile range of 66.25 to 78.00 years of age. A little over one-third of the sample was European-American; more than half indicated being born outside of the United States (U.S.). About 51% of the participants had a high school education or less. Most of the respondents were retired (and, therefore, unemployed) and mainly married or widowed. For Study 2, we recruited 241 older women who resided in the same urban and suburban communities of Los Angeles County as Study 1 participants. These women reported a median age of 68 years, with a total range of 60 to 90 years and an interquartile range of 64.00 to 75.00 years of age. In this second sample, women self-identified as belonging to one of seven ethnic/pan-ethnic groups. Table 2 illustrates the demographic characteristics of this sample. Approximately 40% of the participants identified as European-American and indicated an educational level equal to or lower than high school completion. Nearly half reported being born outside of the U.S. Inclusion criteria for both studies were as follows: 60 years of age or older (based on the age of many of the aforementioned studies’ samples), English fluency (to minimize confounding the results with acculturation levels), ability to provide informed consent, and independent living status. Excluding individuals in assisted living facilities decreased the possibi-lity of recruiting participants with significant cognitive impairment (who are often found in such institutions).
Recruitment Strategies
and alignment of research goals with those of ethnic minority populations [57,58]. Additionally, we employed face-to-face recruitment to encourage research participa-tion (as most ethnic minority older adults do not respond to advertisements of research studies in the media [59]) and refrained from asking participants to travel to a research center. Recruitment (for both stu-dies) was challenging, as we attempted to recruit as many older women as possible from a vast variety of ethnic backgrounds; several of the women originally contacted were wary of research efforts and uninterested in participating in these two investigations. We allowed
for flexible interview scheduling and assigned ethnicity-matched interviewers to establish initial contact and conduct interviews. Moreover, we tailored our recruit-ment strategies for inclusion of women from all income levels, as socio-economic factors often affect willingness of ethnic minority older adults to engage in research [60]. The utilization of this selection of recruitment tac-tics and sites maximized the number of ethnic minority participants in the two studies.
Procedure
Study 1 was conducted in three years (from 2002 to 2005), with two years of data collection, while Study 2
Table 1 Demographics Characteristics of Study 1 Sample (N= 220)
Demographic variables Median
%
Age 71
Ethnicity
European-American 37.3
Latina/Hispanic 28.2
Middle Eastern 12.7
Asian-American 8.2
Black/African-American 6.8
Native-American 3.2
Mixed Ethnicity 3.2
Place of Birth
U.S. 46.2
Outside of the U.S. 53.8
Unknown 3.6
Education level
Less than high school 31.4
High school graduate 20.5
Completed Trade school 5.9
Less than 2 years college 17.7
Bachelor’s Degree 13.2
Some Graduate school 1.8
Master’s Degree 6.4
Ph.D., M.D. and/or J.D. 1.8
Unknown 1.4
Employment Status
Full-time 12.7
Part-time 10.4
Not employed 76.9
Unknown 3.6
Marital Status
Single 6.8
Divorced 12.7
Married 40.5
Widowed 35.9
Divorced and living
with significant other 0.9
Unknown 3.2
Table 2 Demographics Characteristics of Study 2 Sample (N= 241)
Demographic variables Median
%
Age 68
Ethnicity
European-American 28.4
Latina/Hispanic 17.3
Middle Eastern 12.1
Asian-American 9.5
Black/African-American 7
Native-American < 1.0
Mixed Ethnicity 1.2
Place of Birth
U.S. 44.6
Outside of the U.S. 48.1
Unknown 1.6
Education level
Less than high school 19.8
High school graduate 20.9
Completed Trade school 7.4
Less than 2 years college 26
Bachelor’s Degree 15.7
Some Graduate school 3.3
Master’s Degree 2.9
Ph.D., M.D. and/or J.D. 2.5
Unknown 1.2
Employment Status
Full-time 17.3
Part-time 10.7
Not employed 72
Unknown < 1.0
Marital Status
Single 6.1
Divorced 11.5
Married 50.8
Widowed 30.3
Divorced and living with significant other 1.2
spanned four years (2006-2010), three of which were dedicated to data collection. The last year of funding of each study was dedicated to data entry, verification, and analyses. This federally-funded research was approved by the Institutional Review Board of California State University Northridge. All research assistants (RAs)/ interviewers were extensively trained by the first author prior to participating in data collection. Weekly mentor-ing group meetmentor-ings were convened to ensure that all of them were well-trained. We asked RAs to start each assessment session by explaining the purpose of the research and addressing any of the respondents’ ques-tions. Informed consent was obtained prior to adminis-tering the assessment battery. Participants were clearly instructed regarding their right to withdraw from the research at any time, as specified in the consent form. The first part of the assessment procedure involved the solicitation of basic demographic information from each participant and the administration of the brief screener to determine research eligibility. RAs read all items in the test battery aloud and were instructed to complete the assessment in two sessions, with a short break between sessions to minimize fatigue. We also asked them to write all responses to the measures in legible hand-writing in the assessment packets. RAs allowed flexible scheduling of assessment sessions and accom-modated location preferences to maximize participants’ comfort level. Typically, respondents chose to be assessed in their homes or at community locations including libraries and senior centers. We took great care to exercise patience and preserve the dignity of the older women participating in this research.
Assessment Tools
RAs were instructed to first administer an original
Screening tool to verify research eligibility. This short measure employs a combination of items from a stan-dardized tool as well as demographic items (i.e., age and living arrangement) required to determine eligibility. Specifically, it contains a brief portion of theSurvey Psy-chiatric Assessment Schedule (SPAS) [61], a 51-item instrument with strong psychometric properties that was used exclusively for screening purposes (as its find-ings were not included in the data analyses). Our screener comprised only the first five items of the lengthy SPAS, thus excluding the SPAS section“Other survey questions about general health of subject.” This choice allowed for the assessment of factors that are potentially indicative of gross cognitive impairment/ dementia such as participants’ability to: spell their own name, remember their own birthday, and exhibit an awareness of spatial orientation. RAs were instructed to recruit only women with perfect scores in these three areas.
We used a brief Demographics list(created by the first author) to assess variables such as ethnicity, place of birth, education, and income, as well as marital and employment status. An indicator of social support, i.e., the number of people in one’s social network, was quan-tified via the Single Item Measure of Social Support (SIMSS). Although extremely short, this instrument is a strong predictor of morbidity and has good psycho-metric properties [62]. This single item is comprised of the question “How many people do you have near you that you can readily count on for help in times of diffi-culty such as watch over children or pets, give rides to hospital or store, or help when you are sick?” Response options are 0, 1, 2-5, 6-10, or more. Responses of 0 or 1 indicate low tangible assistance; 6-10 or more indicate high tangible assistance. Use of this short measure allowed us to avoid utilizing one of the much longer questionnaires on social support, thus rendering the assessment process less cumbersome for older women.
To assess physical and mental QofL, we utilized the
Medical Outcome Study 36-item Short Form Health Sur-vey (MOS SF-36). This tool was developed to assess gen-eral health status and functional loss [63] and quantifies eight health constructs, namely: 1) limitations in physi-cal activities due to health problems; 2) limitations in social activities resulting from physical or emotional problems; 3) limitations in usual role activities due to physical health problems; 4) bodily pain; 5) general mental health (psychological distress and well-being); 6) limitations in usual role activities because of emotional problems; 7) vitality (energy and fatigue); and 8) general health perceptions. Subtotals for physical and mental health provided a quantification of physical QofL and mental QofL; clinical tests of the validity of this tool have achieved excellent results [64]. We utilized the MOS software to conduct all the analyses relative to physical and mental QofL.
knowledge”and “My children fully understand my social needs.”
Analytic Strategy
We implemented all data analyses through the Statistical Package for the Social Sciences, version 17.0 (SPSS Inc., Chicago, IL). For both studies, we first calculated the sample’s descriptive statistics. In Study 1, we conducted an exploratory factor analysis (EFA) of the new tool; moreover, we computed the internal consistency/Cron-bach’s a value for the OWSQLI through a reliability analysis. Additionally, we validated the OWSQLI by relating its scores to those of instruments that measure social support (SIMSS), as well as physical and mental QofL (MOS SF-36). In cases in which a question was not applicable to a given respondent (e.g., for items referring to participant’s children, if they were childless, or for questions assuming the availability of at least one friend, if respondents reported that they had none), this question was excluded from the analysis and from any scale construction for that given participant. This is pre-ferable to a listwise deletion that would exclude the per-son in question from all analyses due to non-applicable responses to a few items. Once the results of the EFA in Study 1 were examined, we conducted a confirmatory factor analysis (CFA) using Study 2 sample. The CFA was implemented specifically to ascertain whether the 22 items that emerged in Study 1 continued to represent a single strong factor from the original 50-item pool in Study 2. Furthermore, we repeated the reliability and validity procedures employed in the previous study and examined (preliminarily) potential ethnic group differ-ences in OWSQLI scores.
Results
Concerning the EFA in Study 1, our statistical consul-tant set the criterion of item retention at a factor load-ing of .32 or higher, which is generally accepted as the minimum value for an item loading on a given factor [65]. A .32 loading is approximately equal to 10% over-lapping variance with the other items on that factor. This provided a means to shorten the measure and, con-sequently, avoid burdening older women with a lengthy instrument in future research in this area. Based on this criterion, 22 of the original 50 items were retained. With 22 items, the mean of the OWSQLI was 39.13 and the standard deviation 20.78. Scores on one item were reversed, as this item is negatively worded (other nega-tively phrased items did not satisfy the statistical criter-ion for incluscriter-ion). The factor analysis of the OWSQLI obtained robust findings. Based on the 50 original items, the percentage of total score variance explained by one single factor was 44.04% (l= 9.17). Thus, the compara-tive weight of this factor is strong. Examinations of the
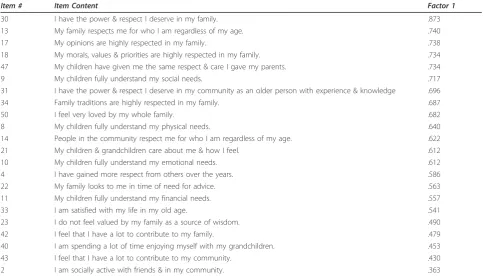
Eigen values also pointed to a single-factor solution with a clear drop in size between the first and second factor (9.69 to 1.76). Furthermore, the 7.99% total variance gained in moving to a 2-factor solution was not deemed sufficient, in view of the practical disadvantages of a longer scale and the related greater difficulty in inter-pretability. Table 3 contains the matrix with the factor loading, which illustrates the degree to which each of the 22 items loaded on one factor, with the most highly loaded items displayed first. To further confirm this 22-item, single factor solution, we conducted a CFA using Study 2 sample. Given the nature of this analysis, Princi-pal Axis Factoring was chosen as the extraction method. All 22 items met the .32 loading threshold with this sec-ond independent sample. The OWSQLI yielded a mean of 40.41 and a standard deviation of 19.15. The single factor of the OWSQLI had a strong comparative weight, as it explained a high percentage of total score variance (41.90%,l= 9.22). The matrix with Study 2 factor load-ing is displayed in Table 4 with the most highly loaded OWSQLI items appearing first.
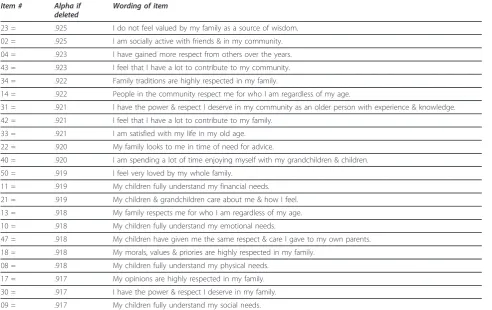
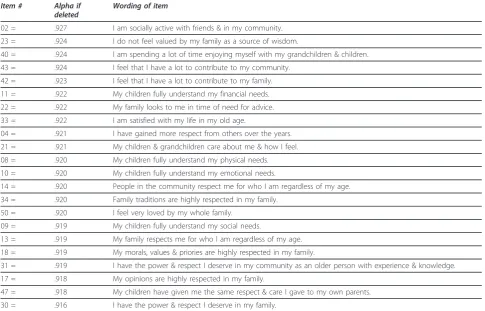
Tables 5 and 6 illustrate the item-total statistics for Study 1 and Study 2; the 22 items correlated very well with each other for both samples, which was to be expected, given that they assess facets of one construct, social QofL. In these two tables, we displayed the con-tent of each item next to its original number (out of 50 items).
The new measure demonstrated the same high inter-nal consistency in both studies (a = .92, p < .001). Moreover, as reported in Table 7 (which contains valid-ity information pertinent to both studies), we conducted a preliminary validity test of the OWSQLI by relating its scores to those on size of social support network, as well as to MOS SF-36 total scores. Good (yet modest, as hypothesized) criterion validity was observed when OWSQLI scores were related to scores on the number of people in the respondents’social network (SIMMS) for both samples. Concurrent validity of the OWSQLI was assessed by comparing its scores in both Study 1 and 2 to those on physical and mental QofL. As expected, correlations among these scales were signifi-cant, although modest.
Table 3 Study 1 Factor Loading
Item #
Item Content Factor 1
09 My children fully understand my social needs. .805
21 My children & grandchildren care about me & how I feel. .794
08 My children fully understand my physical needs. .768
30 I have the power & respect I deserve in my family. .764
50 I feel very loved by my whole family. .748
13 My family respects me for who I am regardless of my age. .748
17 My opinions are highly respected in my family. .747
18 My morals, values & priorities are highly respected in my family. .729
47 My children have given me the same respect & care I gave my parents. .713
10 My children fully understand my emotional needs. .710
40 I am spending a lot of time enjoying myself with my grandchildren. .705
11 My children fully understand my financial needs. .661
22 My family looks to me in time of need for advice. .653
33 I am satisfied with my life in my old age. .584
42 I feel that I have a lot to contribute to my family. .584
34 Family traditions are highly respected in my family. .555
23 I do not feel valued by my family as a source of wisdom. .466
31 I have the power & respect I deserve in my community as an older person with experience & knowledge. .463
14 People in the community respect me for who I am regardless of my age. .448
43 I feel that I have a lot to contribute to my community. .447
02 I am socially active with friends & in my community. .379
04 I have gained more respect from others over the years. .379
Extraction Method: Principal Axis Factoring. One factor extracted. No rotation.
Table 4 Study 2 Factor Loading
Item # Item Content Factor 1
30 I have the power & respect I deserve in my family. .873
13 My family respects me for who I am regardless of my age. .740
17 My opinions are highly respected in my family. .738
18 My morals, values & priorities are highly respected in my family. .734
47 My children have given me the same respect & care I gave my parents. .734
9 My children fully understand my social needs. .717
31 I have the power & respect I deserve in my community as an older person with experience & knowledge .696
34 Family traditions are highly respected in my family. .687
50 I feel very loved by my whole family. .682
8 My children fully understand my physical needs. .640
14 People in the community respect me for who I am regardless of my age. .622
21 My children & grandchildren care about me & how I feel. .612
10 My children fully understand my emotional needs. .612
4 I have gained more respect from others over the years. .586
22 My family looks to me in time of need for advice. .563
11 My children fully understand my financial needs. .557
33 I am satisfied with my life in my old age. .541
23 I do not feel valued by my family as a source of wisdom. .490
42 I feel that I have a lot to contribute to my family. .479
40 I am spending a lot of time enjoying myself with my grandchildren. .453
43 I feel that I have a lot to contribute to my community. .430
2 I am socially active with friends & in my community. .363
one-way ANOVA, which was followed by Tukey post-hoc comparisons. Neither the overall omnibus test,F(5, 385) = 1.53, p = .135, nor any paired comparison between pan-ethnic groups was statistically significant, indicating the general absence of significant pan-ethnic between-group variation in OWSQLI scores.
Discussion
The findings of Study 1 analyses indicate that the new tool presented herein is characterized by a strong single factor and high internal consistency. These findings were confirmed in Study 2 analyses, whose results were nearly identical to those of Study 1. Furthermore, as expected, the OWSQLI demonstrated adequate criterion validity with a social support indicator, as well as mod-erate concurrent validity with both physical and mental QofL. These validity results are noteworthy, because they confirm that our measure advances beyond assess-ment of social support as well as physical and assess-mental QofL to quantify social QofL.
Upon examining specific items loading on the single factor explaining a large part of the OWSQLI’s score variance, we discovered that our samples’social QofL scores were affected primarily by satisfying relations with family members. Friends and the community at
large were also valued, but their contribution to perso-nal sense of well-being was less critical than familial relationships. This finding substantiates evidence reported in prior literature that the family network is typically the primary social resource available for emo-tional and financial support in older age, although sup-port from friends and community can provide similar protective effects [66,67]. It also corroborates the notion, reinforced in a recent literature review [68], that family ties are particularly important for non-European-Ameri-can older adults (as most of our participants had an eth-nic minority status). Interestingly, the notion of respect appears in the items that have some of the highest load-ings in the scale, which highlights the importance of respect and of one’s role in the family in older age, espe-cially considering compelling research relating family role to mortality in older age [69-71].
The fact that issues such as being loved and cared for by family and friends were strongly related to total OWSQLI scores suggests that it is imperative for mental health providers to encourage older patients to focus on ties with family and friends in order to strengthen such ties and, in turn, possibly enhance biopsychosocial func-tioning in later life. In particular, the“friends-related” finding offers supportive empirical evidence for Yeh and
Table 5 Study 1 Item-Total Statistics
Item # Alpha if
deleted
Wording of item
23 = .925 I do not feel valued by my family as a source of wisdom.
02 = .925 I am socially active with friends & in my community.
04 = .923 I have gained more respect from others over the years.
43 = .923 I feel that I have a lot to contribute to my community.
34 = .922 Family traditions are highly respected in my family.
14 = .922 People in the community respect me for who I am regardless of my age.
31 = .921 I have the power & respect I deserve in my community as an older person with experience & knowledge.
42 = .921 I feel that I have a lot to contribute to my family.
33 = .921 I am satisfied with my life in my old age.
22 = .920 My family looks to me in time of need for advice.
40 = .920 I am spending a lot of time enjoying myself with my grandchildren & children.
50 = .919 I feel very loved by my whole family.
11 = .919 My children fully understand my financial needs.
21 = .919 My children & grandchildren care about me & how I feel.
13 = .918 My family respects me for who I am regardless of my age.
10 = .918 My children fully understand my emotional needs.
47 = .918 My children have given me the same respect & care I gave to my own parents.
18 = .918 My morals, values & priories are highly respected in my family.
08 = .918 My children fully understand my physical needs.
17 = .917 My opinions are highly respected in my family.
30 = .917 I have the power & respect I deserve in my family.
Lo’s recommendations to provide incentives within communities to engage older adults in social activities and enhance their social contacts and resources [72]. We also discovered that a sense of belonging and main-tenance of status as a contributing family member is positively linked to older women’s social QofL. These findings complement prior empirical evidence demon-strating that supportive relationships and activities that are perceived as important help maintain older women’s self-esteem and reduce stress [73], and that social con-tact and frequent social interaction produce higher life satisfaction in later life [74].
Another consistent result across both studies was that perceived size of social network was significantly related to OWSQLI scores, again indicating that the amount of
available help (i.e., individuals who are perceived as will-ing and able to provide practical assistance when in need) is an important factor with regard to older women’s social QofL. These findings are corroborated by prior literature on this topic [23]. Our results con-cerning the significant relationship between physical health and social QofL are also consistent with prior empirical evidence on this topic linking social resources to better physical health and a lessened impact of chronic disease [21]. Moreover, the significance of the relationship between mental and social QofL corrobo-rates the findings of other researchers [27,30]. As a whole, the results of our two studies indicate that the new measure of social QofL is a psychometrically sound instrument with desirable properties for utilization with
Table 6 Study 2 Item-Total Statistics
Item # Alpha if
deleted
Wording of item
02 = .927 I am socially active with friends & in my community.
23 = .924 I do not feel valued by my family as a source of wisdom.
40 = .924 I am spending a lot of time enjoying myself with my grandchildren & children.
43 = .924 I feel that I have a lot to contribute to my community.
42 = .923 I feel that I have a lot to contribute to my family.
11 = .922 My children fully understand my financial needs.
22 = .922 My family looks to me in time of need for advice.
33 = .922 I am satisfied with my life in my old age.
04 = .921 I have gained more respect from others over the years.
21 = .921 My children & grandchildren care about me & how I feel.
08 = .920 My children fully understand my physical needs.
10 = .920 My children fully understand my emotional needs.
14 = .920 People in the community respect me for who I am regardless of my age.
34 = .920 Family traditions are highly respected in my family.
50 = .920 I feel very loved by my whole family.
09 = .919 My children fully understand my social needs.
13 = .919 My family respects me for who I am regardless of my age.
18 = .919 My morals, values & priories are highly respected in my family.
31 = .919 I have the power & respect I deserve in my community as an older person with experience & knowledge.
17 = .918 My opinions are highly respected in my family.
47 = .918 My children have given me the same respect & care I gave to my own parents.
30 = .916 I have the power & respect I deserve in my family.
Table 7 Criterion and Concurrent Validity for Both Studies
OWSQLI
Study 1/Study 2
SIMSS MOS SF-36
Physical and Mental Total Scores
OWSQLI Pearson Correlation 1 -
-SIMSS Pearson Correlation .33*/.27** 1
-MOS Physical Pearson Correlation .21*/.14* - 1
MOS Mental Pearson Correlation .26*/.18* - 1
older women from diverse ethnic backgrounds. More-over, the items comprising the OWSQLI employ rather simple language, which is a strength of the measure, given the modest educational level of both samples.
These two investigations have several limitations that could be addressed in future studies. Among them, our findings do not imply causation, because their design was correlational. Longitudinal research is needed to verify the present results. Also, the OWSQLI was not validated against a previously established socially-related QofL instrument. Yet, because, to our knowledge, this is the first tool of its kind, such a limitation was unavoid-able. However, it would have been ideal to validate the OWSQLI against a measure of social support that was more lengthy and in-depth than the SIMSS. A focus on keeping the assessment battery short (to reduce fatigue among research participants) prevented us from using a lengthier social support instrument. In future studies, researchers could compare scores on the OWSQLI to those on other well-established social support measures such as the Q-LES-Q [49].
Another limitation of our research was that we recruited women exclusively; men’s social QofL should also be studied using our tool, as the latter could be validated and modified accordingly for use with ethni-cally diverse older men. Furthermore, a few of the items in the OWSQLI are worded somewhat vaguely, espe-cially given that the scale was administered to women as young as 60 (many of whom were still working). For instance, the meaning of“... regardless of my age” could be unclear; we meant that, no matter how old the parti-cipant was, she felt respected (or not) by the people in her community and by her family members. Having a few items with words that could be assigned different meanings is a shortcoming of most of the aforemen-tioned tools. Special attention should be paid to clarify-ing the meanclarify-ing of unclear items and encouragclarify-ing research participants to raise questions if items are not understandable (although, in our research, none of the respondents asked to clarify the meaning of any of the scale’s items). Moreover, the sample sizes of specific eth-nic groups did not allow for the testing of national groups –although we did attempt to unveil different social relationship patterns via mean comparisons across pan-ethnic groupings, but found no significant differ-ences in mean OWSQLI scores. Interested researchers could identify how older adults from different ethnic minorities respond to this tool and develop culture-spe-cific norms based on their findings. In this regard, the meaning of words such as “having power in one’s family” could vary across ethnic groups. Ideally, these issues should be explored via in-depth qualitative inter-views (in addition to administering paper-and-pencil measures) to clarify item comprehension and
assignment of meaning to complex concepts like power. Including collection of qualitative data to study social QofL would allow a more in-depth study of this topic via mixed methods procedures.
Concerning additional limitations of these two research endeavors, all participants in both studies were fluent in English; interested investigators should con-sider using and validating this new tool in other lan-guages. Also, our two cohorts were not based on random community sampling, so our findings may not be fully generalizable to our catchment area. However, about half of both our samples reported holding a high school degree at best, similarly to findings on the gen-eral Los Angeles County population (47.3%) [75]. Jud-ging from those statistics, the two samples utilized in this research are possibly representative of their catch-ment area. Nonetheless, our results could be due, at least partially, to variables not assessed herein such as medication use and/or acculturation. Further psycho-metric evaluation, such as testing for differences on a subset of the items of the OWSQLI (e.g., family items) across a stratified sample, may be warranted, but was beyond the scope of this preliminary test of our sure. Additionally, the exclusive use of self-rated mea-sures, although implemented in most of the aforementioned investigations, is a limitation. Overall, in spite of multiple limitations, our studies represent a necessary step in the direction of properly quantifying the social QofL of ethnically diverse older women, thus making a needed contribution to the growing area of ethnogeriatric psychometrics.
Conclusions
social activities that the older patients in question find personally meaningful. Interested investigators should test the psychometric properties of the OWSQLI further; currently, in our laboratory, we are collecting data utilizing this measure on ethnically diverse older men in order to refine this tool for use with older male populations.
As a final consideration, researchers interested in clin-ical applications of the OWSQLI could relate its scores to those on adjustment to challenges commonly experi-enced in older age, including chronic impairments such as vision problems. Utilization of the OWSQLI, given its “family and friends” focus, could be ideal with clinical populations similar to the one targeted in a recent study [76] in which family was found to provide social support during the initial adaptation of older individuals to vision impairment, while friends provided support in long-term adaptation. Given the differences between our studies’non-clinical population and the clinical one in question, the factor structure of the OWSQLI for patients with progressive physical impairments could look significantly different (at different stages of their adaptation to the visual impairment) than the structure obtained herein.
Acknowledgements
These two investigations were supported by two grants from the National Institutes of Health and the National Institute of General Medical Sciences, award numbers GM 48680 and 5SC3GM094075, Luciana Lagana’, Principal Investigator. We thank Prof. Sun-Mee Cheng for her consultation on some of Study 1 statistical analyses, as well as the first author’s students who gathered the data. The content of this article is solely the responsibility of the authors and does not necessarily represent the official views of the National Institutes of Health or the National Institute of General Medical Sciences.
Author details
1Department of Psychology, California State University Northridge, 18111
Nordhoff Street, Northridge, California, USA.2Department of Child and Adolescent Studies, California State University Fullerton, 800 State College Boulevard, Fullerton, California, USA.
Authors’contributions
LL, the principal investigator, created the OWSQLI, designed the two studies, conducted Study 1 analyses, and wrote most of the paper. MLB wrote some parts of the literature review and a first draft of a portion of this paper. IB wrote some parts of the literature review, contributed to the writing of all sections, verified the accuracy of the methodological parts of the paper, and conducted Study 2 data analyses. All authors read and approved the final manuscript.
Competing interests
The authors declare that they have no competing interests.
Received: 31 January 2011 Accepted: 8 October 2011 Published: 8 October 2011
References
1. Borglin G, Edberg AK, Hallberg IR:The experience of quality of life among older people.J Aging Stud2005,19:201-220.
2. Bowling A:What things are important in people’s lives? A survey of public’s judgments to inform scales of health related quality of life.Soc Sci Med1995,41(10):1447-1462.
3. Browne JP, O’Boyle CA, McGee HM,et al:Individual quality of life in the healthy elderly.Qual Life Res1994,3:235-244.
4. Grewal I, Lewis J, Flynn T,et al:Developing attributes for a generic quality of life measure for older people: Preferences or capabilities?Soc Sci Med
2006,62(8):1891-101.
5. Bowling A, Banister D, Sutton S,et al:A multidimensional model of the quality of life in older age.Aging Ment Health2002,6(4):355-371. 6. Bowling A, Gabriel Z:An integrational model of quality of life in older
age. Results from the ESRC/MRC HSRC Quality of Life Survey in Britain.
Soc Indic Res2003,69(1):1-36.
7. O’Boyle CA:Measuring the quality of life of later life.Philos Trans Royal Soc Lond1997,352:1871-1879.
8. Jans L, Stoddard S:Chartbook on Women and Disability in the United States. An infoUse Report.Washington (DC): U.S. National Institute on Disability and Rehabilitation Research; 1999.
9. Kaplan RM, Erickson J:Quality adjusted life expectancy for men and women in the United States. Behavior, health, and aging. Perspectives in behavioral
medicineMahwah, NJ: Lawrence Erlbaum; 2000.
10. U.S. Census Bureau:Disability Status 2000 - Census 2000 Brief.2000 [http://www.census.gov/prod/2003pubs/c2kbr-17.pdf].
11. Arean PA, Gallagher-Thompson D:Issues and recommendations for the recruitment and retention of older ethnic minority adults into clinical research.J Consult Clin Psychol1996,64(5):875-880.
12. Ngo-Metzger Q, Sorkin DH, Mangione CM,et al:Evaluating the SF-36 Health Survey (Version 2) in older Vietnamese Americans.J Aging Health
2008,20(4):420-436.
13. Frayne SM, Burns RB, Hardt EJ,et al:The exclusion of non-English-speaking persons from research.J Gen Intern Med1996,11:39-43. 14. Ballard EL, Nash F, Raiford K,et al:Recruitment of Black elderly for clinical
research studies of dementia: The CERAD experience.Gerontologist1993,
33:561-565.
15. Mindel CH, Kail BL:Issues in research on the older woman of color.J Drug Iss1989,19:191-206.
16. Becker DG, Blumenfield S, Gordon N:Voices of the eighties and beyond: Reminiscences of nursing home residents.J Gerontol Soc Work1984,
8(1):83.
17. Saul S, Saul SR:The application of joy in group psychotherapy for the elderly.Int J Group Psych1990,40(3):353-363.
18. Cutrona C, Russell D, Rose J:Social support and adaptation to stress by the elderly.Psychol Aging1986,1(1):47-54.
19. Scott CB, Moneyham L:Perceptions of senior residents about a community-based nursing center.IMAGE: J Nurs Scholarship1995,
27(3):181-186.
20. Triandis HC:Individualism-collectivism and personality.J Pers2001,
69(6):907-924.
21. Janevic MR, Janz NK, Dodge JA,et al:Longitudinal effects of social support on the health and functioning of older women with heart disease.Int J Aging Hum Dev2004,59(2):153-175.
22. Jang Y, Haley WE, Small BJ,et al:The role of mastery and social resources in the associations between disability and depression in late life.
Gerontologist2002,42(6):807-813.
23. Plach SK, Heidrich SM:Social role quality, physical health, and psychological well-being in women after heart surgery.Res Nurs Health
2002,25:189-202.
24. Cohen S, Syme SL:Issues and application of social support.InSocial support and health.Edited by: Cohen S, Syme SL. New York: Academic Press; 1985:3-22.
25. Cohen S, Wills TA:Stress, social support, and the Buffering Hypothesis.
Psychol Bull1985,98(2):310-357.
26. Farquhar M:Elderly people’s definition of quality of life.Soc Sci Med1995,
10(4):1429-1446.
27. Zunzunegui MV, Alvarado BE, Del Ser T,et al:Social networks, social integration, and social engagement determine cognitive decline in community dwelling Spanish older adults.J Gerontol B Psychol Sci Soc Sci
2003,58(2):93-100.
28. Blieszner R:Resource exchange in the social networks of elderly women.
Converse, Törnblom KY, Foa EB. San Diego, CA: Academic Press; 1993:165-195.
29. Tikkainen P, Heikkien R, Leskinen E:The structure and stability of perceived togetherness in elderly people during a 5 year follow-up.J App Gerontol2004,23(3):279-294.
30. Taylor MG, Lynch SM:Trajectories of impairment, social support, and depressive symptoms in later life.J Gerontol B Psychol Sci Soc Sci2004,
59(4):238-246.
31. Evans S, Huxley P:Studies of quality of life in the general population.
Intern Rev of Psych2002,14:203-211.
32. Ware JE, Snow KK, Kosinski M,et al:SF-36 Health Survey Manuel and Interpretation GuideBoston: New England Medical Center, The Health Institute; 1993.
33. Brazier JE, Harper R, Jones NMB,et al:Validating the SF-36 health survey questionnaire: new outcome measure for primary care.Brit Med J1992,
305:160-164.
34. Haywood KL, Garratt AM, Fitzpatrick R:Quality of life in older people: a structure review of generic self-assessed health instruments.Qual Life Res
2005,14:1651-1668.
35. Wagner A, Gandek B, Aaronson NK:Cross-cultural comparison of the content of SF-36 translations across 10 countries: Results from the IQOLA project.J Clin Epidem1998,51(11):925-932.
36. Ferrans CE, Powers MJ:Psychometric assessment of the quality of life index.Res Nurs Health1992,15:29-38.
37. Power M, Bullinger M, Harper A, The World Health Organization Quality of Life Group (WHO-QOL) group:The World Health Organization WHOQOL-100: Tests of the Universality of Quality of Life in 15 Different Cultural Groups Worldwide.Health Psych18:495-505.
38. Spitzer WO, Dobson AJ, Hall J, Chesterman E,et al:Measuring the quality of life of cancer patients: a concise QL-index for use by physicians.J Chronic Dis1981,34(12):585-597.
39. O’Boyle CA, McGee HM, Hickey A,et al:Individual quality of life in patients undergoing hip replacement.Lancet1992,339:1088-1091. 40. O’Boyle CA, Browne J, Hickey A,et al:Manual for the SEIQoL-DWDublin:
Department of Psychology, Royal College of Surgeons in Ireland; 1996. 41. O’Boyle CA, Waldron D:Quality of life issues in palliative medicine.Eur J
Neurol1997,244(4):18-25.
42. Hunt SM, McEwen J, McKenna J:The development of a subjective health indicator.Soc Health Ill1980,2:231-246.
43. Kaplan RM, Anderson EM:A general health policy model: update and applications.Health Serv Res1988,23:203-235.
44. Kaplan RM, Anderson JP, Patterson TL,et al:Validity of the quality of well-being scale for persons with human immunodeficiency virus infection.
Psychosom Med1995,57:138-147.
45. Staniszewska S, Ahmed L, Jenkinson C:The conceptual validity and appropriateness of using health-related quality of life measures with minority ethnic groups.Ethn Health1999,4(1/2):51-62.
46. Deyo RA:Pitfalls in measuring the health status of Mexican Americans: Comparative validity of the English and Spanish Sickness Impact Profile.
Amer J Pub Health1984,74(6):569-573.
47. Bergner M, Bobbitt RA, Carter WB:The Sickness Impact Profile: development and final revision of a health status measure.Med Care
1981,19:787-805.
48. McKenna MC:Development and validation of the Quality of Life Scale for the Elderly (QLSE).Dissertation Abstracts International2002, 62(11-B):5383.
49. Endicott J, Nee J, Harrison W,et al:Quality of life enjoyment and satisfaction questionnaire: A new measure.Psychopharm Bull1993,
29(2):321-326.
50. Mick E, Faraone S, Spencer T,et al:Assessing the validity of the quality of life enjoyment and satisfaction questionnaire–Short form in adults with ADHD.J Attent Dis2008,11(4):504-509.
51. Ritsner M, Kurs R, Gibel A,et al:Validity of an abbreviated Quality of Life Enjoyment and Satisfaction Questionnaire (Q-LES-Q-18) for
schizophrenia, schizoaffective, and mood disorder patients.Qual Life Res
2005,14:1693-1703.
52. Wisniewski SR, Rush AJ, Bryan C,et al:Comparison of quality of life measures in a depressed population.J Nerv Ment Dis2007,
195(3):219-225.
53. Engel GL:The need for a new medical model: a challenge for biomedicine.Science1977,196:129-136.
54. Engel GL:The clinical application of the biopsychosocial model.Amer J Psych1980,137(5):535-544.
55. Salamon MJ:A clinical application for life satisfaction.Clin Gerontol1985,
3(4):60-61.
56. Salamon MJ:Clinical use of the Life Satisfaction in the Elderly Scale.Clin Gerontol1988,8(1):45-54.
57. McNeilly M, Musick M, Efland JR,et al:Minority populations and psychophysiologic research. Challenges in trust building and recruitment.J Ment Health Aging2000,6:91-102.
58. Miller FG, Rosenstein DL, DeRenzo EG:Professional integrity in clinical research.J Am Med Assoc1998,280:1449-1454.
59. Arean PA, Miranda J:The prevalence and implications of mental disorders in disadvantaged and elderly medical patientsPaper presented at the eighth International conference on Mental Health Services Research, Bethesda, MD; 1995.
60. Brown DR, Topcu M:Willingness to participate in clinical treatment research among older African Americans and Whites.Gerontol2003,
43:62-72.
61. Bond J, Brooks P, Carstairs V,et al:The reliability of a Survey Psychiatric Assessment Schedule for the elderly.Br J Psych1980,137:148-162. 62. Blake R Jr, McKay DA:A single-item measure of social supports as a
predictor of morbidity.J Fam Prac1986,22(1):82-84.
63. Ware JE, Sherbourne CD:The MOS 36-item short-form health survey (SF-36): I. Conceptual framework and item selection.Med Care1992,
30(6):473-483.
64. McHorney CA, Ware J Jr, Raczek AE:The MOS 36-Item Short Form Health Survey (SF-36). II. Psychometric and clinical tests of validity in measuring physical and mental health constructs.Med Care1993,31(3):247-63. 65. Tabachnick BG, Fidell LS:Using Multivariate Statistics.5 edition. Pearson/
Allyn and Bacon, Boston, Massachusetts; 2007.
66. Krause N, Liang J, Keith V:Personality, social support, and psychological distress in later life.Psychol Aging1990,5(3):315-326.
67. Newsom JT, Schultz R:Social Support as a mediator in the relation between functional status and quality of life in older adults.J Psychol Aging1996,11(1):34-44.
68. Gallant MP, Spitze G, Grove JG:Chronic illness self-care and the family lives of older adults: A synthetic review across four ethnic groups.J Cross Cult Gerontol2010,25(1):21-43.
69. Okamoto K, Tanaka Y:Subjective usefulness and 6-year mortality risks among elderly persons in Japan.J Gerontol B Psychol Sci Soc Sci2004,
59:246-249.
70. Gruenewald TL, Karlamangla AS, Greendale GA, Singer BH, Seeman TE:
Feelings of usefulness to others, disability, and mortality in older adults: The MacArthur study of successful aging.J Gerontol B Psychol Sci Soc Sci
2007,62(1):28-37.
71. Zunzunegui MV, Béland F, Sanchez MT, Otero A:Longevity and relationships with children: the importance of the parental role.BMC Public Health2009,9:351.
72. Yeh SCJ, Lo SK:Living alone, social support, and feeling lonely among the elderly.Soc Beh & Pers2004,32(2):129-138.
73. Farquhar M:Elderly people’s definition of quality of life.Soc Sci & Med
1995,10(4):1429-1446.
74. Lang FR, Baltes MM:Being with people and being alone in late life: costs and benefits for everyday functioning.International J Beh Dev1997,
21(4):729-746.
75. Los Angeles County Department of Health Services:Los Angeles County Health Survey. Los Angeles, 2002-2003.Office of Health Assessment and Epidemiology, Los Angeles County.
76. Reinhardt JP, Boerner K, Horowitz A:Personal and social resources and adaptation to chronic vision impairment over time.Aging Ment Health
2009,13(3):367-375.
Pre-publication history
The pre-publication history for this paper can be accessed here: http://www.biomedcentral.com/1471-2318/11/60/prepub
doi:10.1186/1471-2318-11-60
Cite this article as:Laganàet al.:The validation of a new measure quantifying the social quality of life of ethnically diverse older women: