Abstract
The present investigation aims to verify whether cadmium (Cd2+), a metal possibly accumulated in body tissues from air and food, affects cell volume regulation capability in cultured human embryon-ic kidney (HEK 293 Phoenix) cells. The osmotembryon-ic phase (OP), whembryon-ich is the expected cell swelling due to aquaporins involvement after hyposmotic challenge, and regulatory volume decrease (RVD), bring-ing cell volume back to control values through Ca2+-dependent ion efflux (K+and Cl–), have been monitored in HEK 293 cells treated with Cd2+(1-10-100 µM) for different time intervals (30 min, 3 h, overnight) and then submitted to 15 % hyposmotic shock. The results show that both 1 and 10 µM Cd2+significantly reduced OP, whereas 100 µM impaired Cd2+ RVD mechanisms. The use of glutathione (GSH, 200 µM) confirmed that Cd2+elicited its effect viaoxidative damage, being RVD inhibition after Cd2+ treatment prevented by this
antioxidant compound. Our findings show that: i) HEK 293 cells are a suitable model to assay the effect of xenobiotics on cell homeosta-sis; ii) Cd2+, depending on its concentration, affects cell homeostasis at different levels, i.e.water and ion permeability, responsible for, respectively, OP and RVD mechanism, adding thus more information to the knowledge of Cd2+toxicology.
Introduction
Heavy metals and their toxic effects on cells and tissues have been widely investigated, as they can be accumulated through respiration, adsorption and ingestion.1,2 In this regard, cadmium (Cd2+) accumu-lates in the atmosphere being produced, from one hand, by natural processes such as erosion and abrasion of rocks and soils, forest fires and volcanic eruptions3and, from another hand, by anthropogenic fac-tors due to industrial development4 concerning production of pig-ments, electronic compounds and rechargeable nickel-cadmium bat-teries. Hence, Cd2+accumulation in humans may result from water, food and air contaminations. In this regard, cigarette smoking should be also considered as a source of intoxication, due to high Cd2+ con-centrations in cigarettes.5
Cd2+ in humans may provoke acute or chronic intoxication effects, as already observed in liver, lungs, thyroid, bones, testis and immunity system. Its detrimental effects, reviewed elsewhere,6-8 could be associated to its low renal excretion rate, thus contributing to its accumulation in the organism. The effect of Cd2+on cells has been already described,9-12though this issue has not been complete-ly clarified.
One of the most critical feature for cell survival is the ability of a cell to regulate its volume under osmotic perturbations.13,14 In a hyposmotic environment, after the expected initial swelling, termed osmotic phase (OP), cells undergo a regulatory shrinkage through the loss of intracellular solutes, mainly K+ and Cl–, along with osmotically obliged water, leading then to regulatory volume decrease (RVD).13,15 RVD mechanisms are highly conserved and
common to many cells from evolutionary distant species.14,16-18 Similarly, the uptakeof osmolytes, followed by gain of osmotically obliged water occurs under hypertonic shrinkage, leading to regula-tory volume increase (RVI), a process exhibited by many cell types and mainly due to Na+influx.13,14,19
Studies on the volume sensor transduction pathway for volume reg-ulation20,21provide evidence for intracellular Ca2+involvement, pro-tein phosphorylation, arachidonic acid and phosphoinositide turnover, as well as mechanical sensors, such as stretch-activated channels and Correspondence: Angela Marino, Department of Chemical, Biological,
Pharmaceutical and Environmental Sciences, University of Messina, viale F. Stagno D’Alcontres 31, 98166 Messina, Italy.
Tel: +39.090.6765214 - Fax: +39.090.394030. E-mail: [email protected]
Key words: Cd2+; HEK 293 Phoenix cells; Osmotic phase; Regulatory volume decrease; GSH.
Contributions: RM, AR, RC performed the experiments; SD collected and analyzed data; GLS checked the manuscript; AM wrote the manuscript and sought the references.
Conflict of interest: the authors declare no potential conflict of interest. Received for publication: 27 November 2015.
Revision received: 19 February 2016. Accepted for publication: 21 March 2016.
©Copyright R. Morabito et al., 2016
Licensee PAGEPress, Italy
Journal of Biological Research 2016; 89:5650 doi:10.4081/jbr.2016.5650
This article is distributed under the terms of the Creative Commons Attribution Noncommercial License (by-nc 4.0) which permits any noncom-mercial use, distribution, and reproduction in any medium, provided the orig-inal author(s) and source are credited.
Cadmium affects osmotic phase and regulatory volume decrease in cultured
human embryonic kidney cells
Rossana Morabito,
1Alessia Remigante,
1Roberta Costa,
2Silvia Dossena,
2Giuseppa La Spada,
1Angela Marino
11
Department of Chemical, Biological, Pharmaceutical and Environmental Sciences, University of
Messina, Messina, Italy;
2Institute of Pharmacology and Toxicology, Paracelsus Medizinische
Privatuniversität, Salzburg, Austria
Non-commercial
cytoskeleton. These pathways may work together producing an inte-grated and effective volume regulatory response,22which allows cell adaptation to osmolarity changes of the external medium. Both RVD and RVI processes account for cell viability and homeostasis23and, as already shown in other cell types,24they can be affected by exogenous compounds like pollutants.
On this basis and in an attempt to consolidate RVD response as a tool to monitor cell function under perturbations of the external medium, the aim of the present investigation is to verify whether OP and/or RVD are affected by Cd2+in human embryonic kidney (HEK 293 Phoenix) cells, chosen as a model of renal cells continuously exposed to hyposmotic and hyperosmotic conditions during the process of urine production, and, therefore, capable of adaptive mechanisms to regulate cell volume.14
Materials and Methods
Human embryonic kidney cells culture
Human renal HEK 293 Phoenix cells25 were kindly provided by Paracelsus Medizinische Privatuniversität (Salzburg, Austria) and frozen in liquid nitrogen before culturing. Cells were seeded in 100 mm diameter Petri dishes containing 10 mL of Minimum Essential Eagle Medium (MEM; Sigma Aldrich, St. Louis, MO, USA) supplemented with 10% fetal bovine serum (FBS; Cambrex Bio Science, East Rutherford, NJ, USA), 2 mM l-glutamine, 100 µg/mL streptomycin, 100 U/mL peni-cillin and 1 mM pyruvic acid (sodium salt). Subcultures were routinely established every second to third day by seeding cells into 100 mm diameter Petri dishes following trypsin/ethylenediaminetetraacetic acid (EDTA) treatment. Cultured cells were placed in an incubator chamber (humidified 95% air, 5% CO2, 37°C). Confluent cells were detached with 1 mL trypsin-EDTA solution, re-suspended in 10 mL of fresh medium and then seeded in 60 mm diameter Petri dishes, as described below.
In order to perform RVD test, HEK 293 cells were seeded on 18x18 mm coverslip glasses, previously placed into 60 mm diameter Petri dishes, and then grown for 24 h (humidified 95% air and 5% CO2at 37°C) before the experiment.
At the end of incubation, cells were used for either control or exper-imental tests after Cd2+treatment. With regard to control experiments, a single coverslip glass with adherent cells, taken from the 60 mm diameter Petri dish, was mounted on a slide and used for RVD test. For experimental tests, after 24 h incubation in 60 mm diameter Petri dish, Cd2+at different concentrations (1-10-100 M) was added to the medi-um and cells incubated for, alternatively, 30 min, 3 h or overnight. Coverslips with adherent cells were then mounted on a slide and used for RVD tests.
Chemicals
The hyposmotic solution was composed by NaCl 125 mM, CaCl22.5 mM, MgCl2 2.5, HEPES 10 mM, at pH 7.4 and osmotic pressure 275 mOsm/KgH2O. Isosmotic physiological solution was obtained by adding mannitol to the hyposmotic medium (pH 7.4, osmotic pressure, 325 mOsm/KgH2O). pH was measured with an Orion pH-meter. Osmolality of solutions was measured with a Fiske OS osmometer. Stock solutions for either CdSO4or glutathione (GSH) were dissolved in distilled water. The compound was then added to the experimental solution to yield the final concentrations (1-10-100 µM for CdSO4, 200 µM for GSH), used on HEK 293 cells. All chemicals were purchased from Sigma Aldrich.
Regulatory volume decrease tests
To perform RVD tests, a make-shift perfusion chamber was prepared
by placing at first two strips of double sided tape (Scotch 3M; 3M, St. Paul, MN, USA) on the long edges of a glass slide, then a 18x18 mm cov-erslip with adherent cells and, finally, a 24x32 mm covcov-erslip. This allowed either isosmotic or hyposmotic solution to be added at one side and absorbed at the other side of the coverslip 24x32 mm with strips of filter paper, so that they could be rapidly exchanged.
Control tests
With regard to control RVD tests, the experimental design consisted of three periods: period 1: pH 7.4, isosmotic physiological solution for 5 min; period 2: pH 7.4, hyposmotic physiological solution (15% hypos-motic shock) for 30 min; period 3: pH 7.4 isoshypos-motic physiological solu-tion for 5 min. Cell volume measurements were taken from cells strongly adherent to the slide. About 40 images/cell were taken, minute-by-minute during the whole experiment, with a phase contrast microscope (Leica DMLS; Leica Microsystems GmbH, Wetzlar, Germany) connected to a video camera (charge-coupled device digital camera) and a computer equipped with suitable software (Movie Maker; Microsoft, Redmond, WA, USA). Since each chosen cell was con-sidered as a sphere, the diameter (needed to calculate cell volume) of each recorded image was measured (Image J; http://imagej.net/) as a function of time. The results were then expressed as the relative vol-ume – V/V0– where V and V0represent, respectively, the volume of a cell at a given time and the average of volume of the same cell in isosmotic physiological solution.
Regulatory volume decrease test on cadmium-treated
cells
RVD tests on Cd2+-treated cells were performed upon cell viability assessment by Trypan blue dye exclusion test (Sigma Aldrich). Concentrations and time of exposure to this metal have been chosen according to what reported by Bertin and Averbeck.6As no cell damage was seen, treated cells, after incubation with Cd2+(1 or 10 or 100 µM) for, respectively, 30 min - 3 h - overnight, were used for RVD test according to the following protocol: pH 7.4, isosmotic physiological solution for 5 min (period 1); pH 7.4, hyposmotic physiological solution (15% hyposmotic shock) for 30 min (period 2); pH 7.4 isosmotic phys-iological solution for 5 min (period 3). Image analysis was performed as described for control tests.
Regulatory volume decrease test on
glutathione-cadmium-treated cells
To possibly counteract the effect of Cd2+ on RVD, cells were pre-treated with the antioxidant GSH (reduced glutathione, 200 µM). With this aim, HEK 293 cells, after overnight incubation, were treated with 200 µM GSH for 20 min before adding either 1 or 10 or 100 µM Cd2+. After incubation for 30 min - 3 h - overnight, RVD test and image analysis were performed according to the protocol reported above for control tests.
Statistical analysis
Statistical analysis was performed using GraphPad Prism (version 5.03; GraphPad Software Inc., San Diego, CA, USA). The results are expressed as means±standard error of means. Comparisons among groups were performed with Student’s ttest and, for multiple compar-isons, with two-way analysis of variance (ANOVA), followed by Bonferroni’s post-hoctest. Statistically significant differences were assumed at P<0.05 (*P<0.05 low significance, **P<0.01 medium sig-nificance, ***P<0.001 high significance). Nrepresents the number of independent experiments. Statistical analysis was reported in Table 1 and, accordingly, on graph panels and legends.
Non-commercial
Results
Control tests
Untreated cells exposed to the hyposmotic shock (Figure 1) exhibited the expected swelling, reaching a V/V0peak value of 1.294±0.025, within 4 min of the hyposmotic challenge. This V/V0value was significantly higher than that observed in the isosmotic period (1st period, ***P<0.001), consistent with the OP. After the peak value, being unchanged the external medium, cell volume decreased towards the con-trol values, reaching, at the end of the hyposmotic period a V/V0value of 1.030±0.016, significantly lower than the V/V0peak value (2ndperiod, §§§P<0.001) and comparable to the V/V0observed in the isosmotic period, thus showing 90% RVD capability. Once replaced the hyposmotic medi-um with an isosmotic one, to restore the control conditions (3rdperiod), cell volume was brought back to the initial values. No post-RVD RVI was detected within the observation time chosen for the test.
Cadmium treatment
Cell integrity assessment by Trypan blue dye exclusion test was per-formed on Cd2+-treated cells before RVD experiments, to exclude any possible cell damage. Neither cells exposed for 30 min, nor for 3 h or overnight to Cd2+ at all concentrations (1-10-100 M) exhibited damage.
Treatment with 1 µM cadmium
HEK 293 cells treated with 1 M Cd2+for 30 min (Figure 2a), 3 h (Figure 2b) or overnight (Figure 2c) exhibited the OP after the hypos-motic challenge, reaching a V/V0 peak value of, respectively, 1.158±0.015 (2ndperiod, Figure 2a), 1.192±0.016 (2ndperiod, Figure 2b), 1.180±0.021 (2ndperiod, Figure 2c). This is significantly higher than the V/V0measured in isosmotic conditions (***P<0.001), while it is significantly lower than the V/V0peak value observed in untreated
cells (°°°P<0.001, Figure 2a; °°P<0.01, Figure 2b and c). The V/V0peak value observed in both treated and control cells, at any time of incuba-tion, was observed within 5 min of hypotonic shock application (2nd period). At the end of the hyposmotic period (2ndperiod) in each exper-imental condition (30 min, 3 h, overnight), cell volume decreased to a V/V0 value of, respectively, 1.030±0.009 (30 min treatment, 2ndperiod, Figure 2a), 1.025±0.0025 (3 h treatment, 2nd period, Figure 2b), 1±0.002 (overnight treatment, 2ndperiod, Figure 2c), which is
signifi-Table 1. Relative volume in human embryonic kidney cells measured in control conditions or treated with either cadmium at different concentrations (1-10-100 µM), with or without 200 µM glutathione, and at different incubation times (30 min, 3 h, overnight).
V/V0
Experimental condition 1stperiod (isotonic) 2ndperiod (hyposmotic) 2ndperiod (hyposmotic) N
- peak value - last value
Control 1.000±0.015 1.294±0.025*** 1.030±0.016§§§ 15
1 µM Cd2+
30 min 1.000±0.015 1.158±0.025***,°°° 1.030±0.009§§§ 13
3 h 1.000±0.002 1.192±0.016***,°° 1.025±0.025§§§ 14
Overnight 1.000±0.001 1.180±0.021***,°° 1.000±0.002§§§ 16
10 µM Cd2+
30 min 1.000±0.001 1.119±0.0025**,°°° 1.030±0.009§§§ 13
3 h 1.000±0.005 1.138±0.013***,°°° 1.043±0.007§§§ 14
Overnight 1.000±0.001 1.138±0.012***,°°° 1.010±0.0014§§§ 14
100 µM Cd2+
30 min 1.000±0.003 1.210±0.0025***,° 1.033±0.009§§§,ns 18
3 h 1.000±0.003 1.213±0.013***,° 1.131±0.007§§,## 17
Overnight 1.000±0.002 1.246±0.012***,ns 1.178±0.014§§,### 16
200 µM GSH + 100 µM Cd2+
30 min 1.000±0.002 1.229±0.002***,ns,^^^ 1.063±0.005§§§,+++ 17
3 h 1.000±0.002 1.262±0.002***,ns,^^^ 1.071±0.020§§§,+++ 19
Overnight 1.000±0.002 1.253±0.005***,ns,^^^ 1.112±0.007§§§,+++ 15 V/V0, relative volume; V, volume of a cell at a given time; V0, the volume of a cell at a given time and the average of volume of the same cell in isosmotic physiological solution; N, number of independent experiments; GSH, glutathione; ns, not significant. Data are presented as means±standard error of mean from separate Nexperiments, where: ***P<0.001 significantly different compared to isotonic; §§§P<0.001 or §§P<0.01
sig-nificantly different compared to peak value; °°°P<0.001 and °°P<0.01 significantly different compared to control; ^^^P<0.001 significantly different compared to 100 µM Cd2+-treated cells; 200 µM GSH + 100 µM Cd2+
30 min ns compared to peak value after 100 µM Cd2+; +++P<0.001 significantly different compared to Cd2+-treated cells; ###P<0.001 significantly different compared to last hyposmotic value in untreated cells, as
determined by two way ANOVA followed by Bonferroni’s post-hoctest or paired Student’sttest.
Figure 1. Relative volume (V/V0) of cells measured after exposure to
isosmotic (1stand 3rdperiod) and hyposmotic (2ndperiod) solution
(15% shock). The peak value in hyposmotic solution was signifi-cantly higher than in isosmotic solution (***P<0.001), while it was significantly lower at the end of the 2ndperiod (§§§P<0.001).
Non-commercial
cantly lower than V/V0peak value observed in each experimental condi-tion (§§§P<0.001), thus showing, respectively, 80.3, 87, 100% RVD capa-bility. Once restored the isosmotic medium (3rdperiod), cell volume was totally recovered (Figure 2a-c).
Treatment with 10 µM cadmium
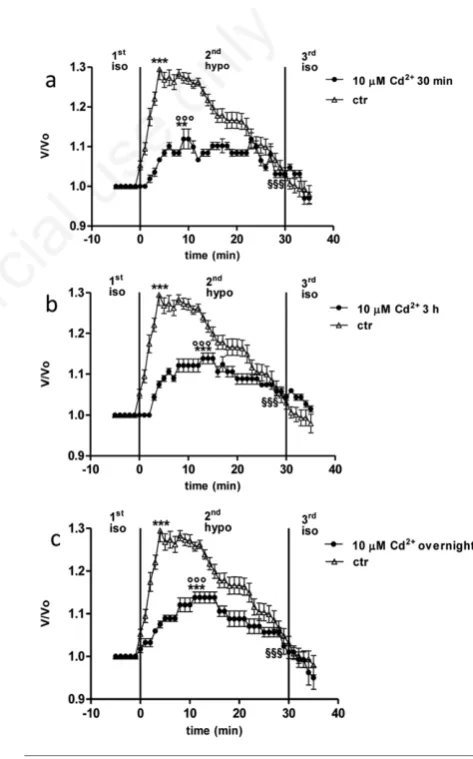
After exposure of HEK 293 cells to 10 µM Cd2+for 30 min, 3 h and overnight, OP was observed after hyposmotic challenge, reaching a V/V0 value of, respectively, 1.119±0.0025 (2nd period, Figure 3a), 1.138±0.013 (2ndperiod, Figure 3b), 1.138±0.012 (2ndperiod, Figure 3c), i.e.significantly higher than values observed in the isosmotic peri-od (**P<0.01, Figure 3a; ***P<0.001, Figure 3b and c), and significant-ly lower than the V/V0 peak value observed in untreated cells (°°°P<0.001). At the end of the hyposmotic period (2ndperiod), cell vol-ume decreased to a V/V0value of, respectively, 1.030±0.009 (Figure 3a),
1.043±0.007 (Figure 3b), 1.010±0.0014 (Figure 3c), which is signifi-cantly lower than the peak value (§§§P<0.001), showing, respectively, 74, 69 and 93% RVD capability. The V/V0peak value observed in Cd2+ -treated cells (at any incubation time) was reached within 10 min of hypotonic shock, significantly later than in untreated cells. Once restored the isosmotic medium (3rdperiod), cell volume was brought back to control values (Figure 3a-c).
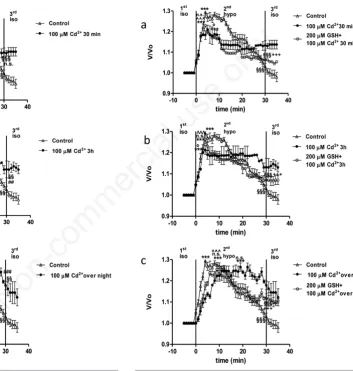
Treatment with 100 µM cadmium
HEK 293 cells exposed to 100 µM Cd2+for 30 min, 3h or overnight exhibited OP after the hyposmotic challenge, reaching a V/V0value of, respectively, 1.210±0.0025 (2nd period, Figure 4a), 1.213±0.013 (2nd period, Figure 4b), 1.246±0.012 (2ndperiod, Figure 4c), significantly higher than values observed in isotonic period (***P<0.001) and sig-nificantly lower than the V/V0peak value observed in untreated cells
Figure 2. Relative volume (V/V0) of cells exposed to 15%
hypos-motic shock after treatment with 1 µM Cd2+for 30 min (a), 3 h
(b), or overnight (c). Comparison with control cells (ctr) is also
provided. The peak value in hyposmotic medium (2ndperiod) was
significantly higher than in isosmotic solution (***P<0.001), and significantly lower than in control cells (°°°P<0.001). At the end of the 2ndperiod, V/V
0in treated cells was significantly lower than
the peak value (§§§P<0.001) at any incubation time.
Figure 3. Relative volume (V/V0) of cells exposed to 15%
hypos-motic shock after treatment with 10 µM Cd2+for 30 min (a), 3 h
(b), or overnight (c). Comparison with control cells (ctr) is also
provided. The peak value in hyposmotic medium (2ndperiod) was
significantly higher than in isosmotic solution (**P<0.01 at 30 min, ***P<0.001 at both 3 h and overnight), and significantly lower than in control cells (°°°P<0.001). At the end of the same
period, V/V0 was significantly lower than the peak value
(§§§P<0.001) at any incubation time.
Non-commercial
(°P<0.05, Figure 4a and b). V/V0peak value observed in overnight 100 M Cd2+-treated cells was not significant with respect to control cells. At the end of the hyposmotic period (2ndperiod), cell volume decreased to a V/V0 value of, respectively 1.033±0.009 (Figure 3a), 1.131±0.007 (Figure 3b), 1.178±0.014 (Figure 3c) significantly lower than the V/V0 peak value (Figure 3a, §§§P<0.001; Figure 3b and c,§§P<0.01) and sig-nificantly higher than that one measured in untreated cells only after 3 h and overnight treatment (##P<0.01 and ###P<0.001, respectively), showing, respectively, 74, 69 and 93% RVD capability. The V/V0peak value in Cd2+-treated cells was reached within 5 min of hypotonic shock at 30 min or 3 h, comparable to control conditions, while, on the other hand, it was reached within 10 min of hypotonic shock after overnight
treatment, significantly later than in untreated cells. Once restored the isosmotic medium (3rdperiod), cell volume was not brought back to control values (Figure 4a-c) within the time of observation chosen for the present protocol.
Treatment with 200
µ
M glutathione
In a separate set of experiments, 200 µM GSH as an antioxidant com-pound was used to possibly counteract the inhibitory action of Cd2+ (10-100 µM) on OP and/or RVD. Since cell response of both 10 and 100 Cd2+-treated cells to GSH application was comparable, data from 100 µM Cd2+plus 200 µM GSH experiments have been depicted in Figure 5. GSH alone (200 µM) did not damage HEK 293 cells and both OP and
Figure 4. Relative volume (V/V0) of cells exposed to 15%
hypos-motic shock after treatment with 100 µM Cd2+for 30 min (a), 3
h (b), or overnight (c). Comparison with control cells (ctr) is
pro-vided. The peak value in hyposmotic medium (2ndperiod) was
significantly higher than in isosmotic solution (***P<0.001). V/V0
at the end of the 2ndperiod in treated cells was significantly lower
than the peak value (a, §§§P<0.001; b,c, §§P<0.01), while it was
significantly higher than the last value in untreated cells
(###P<0.001). In cells treated for both 30 min and 3 h, the peak
value was significantly lower than in control (a,c, °P<0.05), while, after overnight treatment, it was not significantly different with respect to control (b, ns).
Figure 5. Relative volume (V/V0) of cells exposed to 15%
hypos-motic shock after treatment with 200 µM glutathione (GSH) plus
100 µM Cd2+ for 30 min (a), 3 h (b), or overnight (c).
Comparison with both control cells (ctr) and Cd2+-treated cells is
also provided. Peak value of GSH-Cd2+-treated cells at any time
of incubation was significantly different with respect to Cd2+
-treated cells (^^^P<0.001), while not significantly different with
respect to untreated cells. At the end of the hyposmotic challenge
in GSH-Cd2+-treated cells, V/V
0was significantly lower than peak
value (§§§P<0.001) and significantly different with respect to
what observed in both Cd2+-treated and control cells
(+++P<0.001).
Non-commercial
RVD exhibited after hyposmotic shock application were comparable to those observed in untreated cells, at any time of incubation (30 min, 3 h or overnight; data not shown). HEK 293 cells exposed to 200 µM GSH plus 100 µM Cd2+ for 30 min, 3 h or overnight, after hyposmotic shock application swelled reaching a V/V0 peak value of, respectively, 1.229±0.002 (Figure 5a), 1.262±0.002 (Figure 5b), 1.253±0.005 (Figure 5c), significantly higher than V/V0observed in isosmotic conditions (***P<0.001). The V/V0peak value of GSH-Cd2+treated cells, at any time of incubation was significantly higher than that one observed in Cd2+-treated cells (^^^P<0.001) while not significant with respect to V/V0peak value of control cells. At the end of the hyposmotic challenge in GSH-Cd2+-treated cells, cell volume decreased to a V/V0value of, respectively, 1.063±0.005 (Figure 5a) 1.071±0.020 (Figure 5b), 1.112±0.007 (Figure 5c), significantly lower than peak value (§§§P<0.001) and significantly different with respect to what observed in both Cd2+-treated cells and control condition (+++P<0.001), showing, respectively 72.5, 73.3 and 50% RVD capability. Once restored isosmotic conditions (3rdperiod), V/V0was only partially recovered in both GSH-10 µM Cd2+- and GSH-100 µM Cd2+-treated cells.
Discussion
It has been shown that long-term environmental exposure of cells to Cd2+results in high blood levels of this metal, which is associated with organ-specific toxic effects and distinct pathologies in a variety of tis-sues and organs, including kidney.26In this regard, the proximal tubule as well as renal glomeruli, exposed to circulating metals during plasma filtration, have been recognized as a major target in Cd2+-induced effects.27-29
On this basis, cultured human embryonic kidney (HEK 293 Phoenix) cells have been chosen as a model to define whether heavy metals like Cd2+, deriving from environmental pollution,4may affect cell volume regulation under hyposmotic shock, a homeostatic parameter recog-nized to be essential for survival of many cells.13,30Being renal cells continuously exposed to physiological changes in the osmolarity of the external medium,31 cell lines derived from kidney are a suitable model for monitoring homeostatic cell functions, such as the regulation of cel-lular volume, in the presence of xenobiotics.32,33
Our results show that HEK 293 cells exhibit the expected OP within 4 min of 15% hyposmotic challenge, leading to water influx, as shown in other cell types.18After OP, RVD phase occurs and is completed with-in 30 mwith-in of hyposmotic shock application, with cell volume recoverwith-ing, due to both K+and Cl–outflow, resulting in water efflux.18,30
Here we demonstrate that time exposure comprised between 30 min and overnight did not induce cell death under either 1 or 10 or 100 µM Cd2+. Furthermore, both 1 and 10 µM Cd2+-treated HEK 293 cells did not exhibit a peak value comparable to that observed in untreated cells. This result provides evidence for an inhibition of OP inhibition pre-sumptively due to aquaporins,18,34,35rather than an inhibition of RVD mechanisms, suggesting thus a possible action of the metal on water flux. On the other hand, OP was preserved in 100 µM Cd2+-treated HEK 293 cells, while RVD inhibited, suggesting a possible action of the metal on ion transport, namely both K+and Cl–flux, playing a major role in RVD response.13
The evidence that sensitivity to Cd2+varies from one cell type to another and that Cd2+toxic effect highly depends on its concentration, duration of exposure and tissues/cells target, has been already demon-strated.6 This point implies that multiple effects on cells after Cd2+ exposure can be considered. In this regard, Cd2+, at concentrations above 1 µM,36has been described to affect cell cycle progression, pro-liferation, differentiation, DNA replication and repair as well as
apop-totic pathways.37 However, at lower concentrations, it seems to enhance DNA synthesis and cell proliferation.38
As concerns the inhibition of OP and/or RVD phase after Cd2+ expo-sure, some authors have already correlated the effect of heavy metals to cell membrane transport, hence supporting our hypothesis that both ion and water movement may be modified after exposure to Cd2+. Metals have been shown to inhibit epithelial Na+channels (ENaC),39 mainly through Cys and His, possibly after internalization of this metal. In this respect, it has been reported that Cd2+ may compete with Ca2+ uptake through Ca2+ channels40and not through Cd2+-specific uptake pathways, being Cd2+ uptake reduced by Ca2+ channel blockers in sev-eral cell types.9Moreover, Cd2+ has been demonstrated to enter mito-chondria via Ca2+ transport pathways,41 so that the site of action of Cd2+ seems to be inside the mitochondria, the major source of reactive oxygen species (ROS) production.42As a matter of fact, Cd2+toxicity may be associated to ROS induction,43even though the mechanism of their formation, not occurring via Cd2+ triggered fenton-like reaction, is yet unknown.44
It has been already shown that Cd2+ doses lower than 50 µM lead to increased H2O2levels as early as 5 min after exposure with a maximum at 15 min, affecting membranes permeability. On this basis, we may suggest that Cd2+-induced inhibition of RVD mechanisms may rely on an oxidative damage targeting HEK 293 cell membrane. Investigations on Cd2+-induced ROS also reveal an increase in both superoxide anion (O2–) and H2O2levels in HeLa and bovine endothelial cells, under 1-20 µM Cd2+ concentrations.43 Shih and co-authors45 confirmed these results and assessed that in normal human lung fibroblasts (MRC5) H2O2is 2.9-fold elevated after 3 h of Cd2+treatment.
Previous data obtained on HEK 293 cells treated with H2O2in isos-motic conditions46clearly show a cell volume decrease, putatively due to ion loss and obliged water efflux, considered as an early stage of the apoptotic process.47 Since in the present investigation an impaired swelling capacity under hyposmotic challenge was seen under both 1 and 10 µM Cd2+ treatment, an oxidative effect of the metal comparable to what observed by H2O2-treated HEK 293 cells may be even suggested. In addition to its role as a generator of ROS, Cd2+ may also affect antioxidative enzymes that play an important role in ROS elimination. In this respect, in normal rat liver cell line, high concentrations of Cd2+ (100-300 µM), after 4 or 8 h exposure, have been demonstrated to reduce the activity of antioxidant enzymes such as catalase and glu-tathione reductase as well as reduced and oxidized gluglu-tathione. The reduction in glutathione levels after Cd2+ administration has been also shown in mice.48Other studies demonstrate a relationship between Cd2+ exposure and lipid peroxidation, as reported in skeletal muscle cells C2C12, where oxidation of lipids occurs at concentrations of Cd2+>7.5 µM.49Lipid peroxidation may cause cross-linking and poly-merization of membrane components,50affecting thus lipid composi-tion of cell membranes and, in turn, cell funccomposi-tions.
As reviewed by Bertin and Averbeck6, metallothioneins and glu-tathione can mainly detoxify Cd2+ in cells. Reduced-glutathione levels, observed after intoxication, may be brought about by the affinity of Cd2+ to thiol groups and may be responsible for the decrease in cellular antioxidant activities. Both events, i.e.the reduction of both metalloth-ionein expression and glutathione levels, enhance cellular injury due to Cd2+exposure. On this basis, GSH has been here used as an antiox-idant compound to treat cells before Cd2+ application, similarly to what already performed in H2O2-treated HEK 293 cells.46In this latter case 200 µM GSH was effective in impairing cell shrinkage due to H2O2. Since in the present experiments 200 µM GSH impairs the inhibitory effects of Cd2+ (at both 10 and 100 µM, at any time of Cd2+ treatment), we may support the hypothesis that Cd2+may affect cell function acting via oxidizing events such as glutathione levels reduction.
Non-commercial
Conclusions
The present investigation would add information about the effect that heavy metals, such as Cd2+, may exert on a cell target, demonstrat-ing that: i) renal cells, usually exposed to metabolites and toxicants, are confirmed as a good model for investigating the impact of heavy metals at cellular level; ii) RVD capability has been revealed as a suit-able tool to verify the effect of both short and long term exposure to the metal; iii) the effect of Cd2+ on HEK 293 cells depends on both time of exposure to the metal and on metal concentration; iv) both OP, depend-ing on aquaporins involvement, and RVD, dependdepend-ing on K+and Cl– fluxes, are affected by Cd2+; v) though no mechanism of action is here proposed to explain Cd2+ effect, the use of GSH as antioxidant com-pound significantly reduced RVD alterations due to Cd2+exposure.
References
1. Manriquez AR, Magaña PI, López V, Guzmán R. Biosorption of Cu by Thiobacillus ferrooxidans. Bioprocess Eng 1998;18:113-8. 2. Zhou JL, Salvador SM, Liu YP, Sequeria M. Heavy metals in the
tis-sues of dolphins (Delphinus delphis) stranded on the Portuguese coast. Sci Total Environ 2001;273:61-76.
3. Marcano LBC, Carruyo IM, Montiel XM, et al. Effect of cadmium on cellular viability in two species of microalgae (Scenedesmussp. and Dunaliella viridis). Biol Trace Elem Res 2009;130:86-93.
4. Jarup L. Hazards of heavy metal contamination. Brit Med Bull 2003;68:167-82.
5. Tsutsumi R, Hiroi H, Momoeda M, et al. Induction of early decidu-alization by cadmium, a major contaminant of cigarette smoke. Fertil Steril 2009;91:1614-7.
6. Bertin G, Averbeck D. Cadmium: cellular effects, modifications of biomolecules, modulation of DNA repair and genotoxic conse-quences (a review). Biochimie 2006;88:1549-59.
7. Jancic SA, Stosic BZ. Cadmium effects on the thyroid gland. Vitam Horm 2014;94:391-425.
8. Marettová E, Maretta M, Legáth J. Toxic effects of cadmium on testis of birds and mammals: a review. Anim Reprod Sci 2015;155:1-10.
9. Souza V, Bucio L, Gutiérrez-Rui MC. Cadmium uptake by a human hepatic cell line (WRL-68 cells). Toxicology 1997;120:215-20.
10. Foulkes EC. Transport of toxic metal across cell membranes. P Soc Exp Biol Med 2000;223:234-40.
11. Gobe G, Crane D. Mitochondria, reactive oxygen species and cad-mium toxicity in the kidney. Toxicol Lett 2010;198:49-55. 12. Hernández-García A, Romero D, Gómez-Ramírez P, et al. In vitro
evaluation of cell death induced by cadmium, lead and their binary mixtures on erythrocytes of common buzzard (Buteo buteo). Toxicol In Vitro 2014;28:300-6.
13. Lang F. Mechanisms and significance of cell volume regulation. J Am Coll Nutr 2007;26;613-23.
14. Hoffman EK, Lambert IH, Pedersen SF. Physiology of cell volume regulation in vertebrates. Physiol Rev 2009;89:193-277.
15. Pasantes-Morales H, Lezama RA, Ramos-Mandujano G, Tuz KL. Mechanisms of cell volume regulation in hypo-osmolality. Am J Med 2006;119:4-11.
16. La Spada G, Marino A, Sorrenti G. Anatomical and physiological characteristics of tentacular nematocytes isolated by different methods from Aiptasia diaphana (Cnidaria: Anthozoa) of the brackish pond Faro (Messina, Italy). In: Faranda FM, Guglielmo L, Spezie G, eds. Structure and processes in the Mediterranean ecosystems. Berlin: Springer Verlag; 2001. pp 297-303.
17. Marino A, Morabito R, La Spada G, et al. Mechanisms of hyposmotic volume regulation in isolated nematocytes of the anthozoan Aiptasia diaphana. Cell Physiol Biochem 2010;26:209-18.
18. Marino A, Morabito R, La Spada G, et al. Evidence for aquaporin-mediated water transport in nematocytes of the jellyfish Pelagia noctiluca. Cell Physiol Biochem 2011;28:1211-8.
19. Marino A, La Spada G. Regulatory volume increase in nematocytes isolated from acontia of Aiptasia diaphana(Cnidaria, Anthozoa). Cell Mol Biol 2004;50:533-42.
20. Stutzin A, Hoffmann EK. Swelling-activated ion channels: function-al regulation in cell-swelling, proliferation and apoptosis. Acta Physiol 2006;187:27-42.
21. Wehner F. Cell volume-regulated cation channels. Contrib Nephrol 2006;152:25-53.
22. Pedersen SF, Kapus A, Hoffmann EK. Osmosensory mechanisms in cellular and systemic volume regulation. J Am Soc Nephrol 2011;22:1587-97.
23. Lang F, Ritter M, Völkl H, Häussinger D. The biological significance of cell volume. Renal Physiol Bioch 1993;16:48-65.
24. Morabito R, Marino A, La Spada G. Heavy metals affect Regulatory Volume Decrease (RVD) in nematocytes isolated from the jellyfish Pelagia noctiluca. Comp Biochem Phys A 2013;165:199-206. 25. Di Ciommo DP, Duckett A, Burcescu I, et al. Retinoblastoma protein
purification and transduction of retina and retinoblastoma cells using improved alphavirus vectors. Invest Ophth Vis Sci 2004;45: 3320-9.
26. Teeyakasem W, Nishijo M, Honda R, et al. Monitoring cadmium tox-icity in a Thai population with high level environmental exposure. Toxicol Lett 2007;169:185-95.
27. Uriu K, Kaizu K, Komine N, et al. Renal hemodynamics in rats with cadmium-induced nephropathy. Toxicol Appl Pharm 1998;150:76-85. 28. Nordberg GF. Historical perspectives on cadmium toxicology.
Toxicol Appl Pharm 2009;238:192-200.
29. Templeton DM, Liu Y. Multiple roles of cadmium in cell death and survival. Chem-Biol Interact 2010;188:267-75.
30. Hoffmann EK, Pedersen SF. Cell volume homeostatic mechanisms: effectors and signaling pathways. Acta Physiol 2011;202:465-85. 31. Zarogiannis SG, Ilyaskin AV, Baturina GS, et al. Regulatory volume
decrease of rat kidney principal cells after successive hypo-osmotic shocks. Math Biosci 2013;244:176-87.
32. Prozialeck WC, Edwards JR. Mechanisms of cadmium-induced proximal tubule injury: new insights with implications for biomon-itoring and therapeutic interventions. J Pharmacol Exp Ther 2012;343:2-12.
33. Fujiwara Y, Lee JY, Tokumoto M, Satoh M. Cadmium renal toxicity via apoptotic pathways. Biol Pharm Bull 2012;35:1892.
34. Carbrey JM, Agre P. Discovery of the aquaporins and development of the field. Handb Exp Pharmacol 2009;190:3-28.
35. Ishibashi K, Kondo S, Hara S, Morishita Y. The evolutionary aspects of aquaporin family. Am J Physiol-Reg I 2011;300:566-76. 36. Misra UK, Gawdi G, Pizzo SV. Induction of mitogenic signalling in
the 1LN prostate cell line on exposure to submicromolar concentra-tions of cadmium. Cell Signal 2003;15:1059-70.
37. Dong S, Shen HM, Ong CN. Cadmium-induced apoptosis and phe-notypic changes in mouse thymocytes. Mol Cell Biochem 2001;222:11-20.
38. Von Zglinicki T, Edwall C, Ostlund E, et al. Very low cadmium con-centrations stimulate DNA synthesis and cell growth. J Cell Sci 1992;103:1073-81.
39. Yu L, Douglas CE, Helms MN. Effect of divalent heavy metals on epithelial Na+ channels in A6 cells. Am J Physiol-Renal 2007;293: 236-44.
40. Gagnon E, Hontela A, Jumarie C. Reciprocal inhibition of Cd and
Non-commercial
Ca uptake in isolated head kidney cells of rainbow trout (Oncorhynchus mykiss). Toxicol In Vitro 2007;21:1077-86. 41. Martelli A, Rousselet E, Dycke C, et al. Cadmium toxicity in animal
cells by interference with essential metals. Biochimie 2006;88: 1807-14.
42. Raha S, Robinson S. Mitochondria, oxygen free radicals, disease and ageing. Trends Biochem Sci 2000;25:502-8.
43. Szuster-Ciesielska A, Stachura A, Slotwinska M, et al. The inhibito-ry effect of zinc on cadmium-induced cell a poptosis and reactive oxygen species (ROS) production in cell cultures. Toxicology 2000; 145:159-71.
44. Ercal N, Gurer-Orhan H, Aykin-Burns N. Toxic metals and oxidative stress part I: mechanisms involved in metal-induced oxidative damage. Curr Top Med Chem 2001;1:529-39.
45. Shih CM, Ko WC, Wu JS, et al. Mediating of caspase-independent apoptosis by cadmium through the mitochondria-ROS pathway in MRC-5 fibroblasts. J Cell Biochem 2004;91:384-97.
46. Morabito R, La Spada G, Dossena S, Marino A. Oxidative stress affects responsiveness to hypotonicity of renal cells. J Biol Res 2014;87:4811.
47. Antico S, Lionetto MG, Giordano ME, et al. Cell volume regulation and apoptotic volume decrease in rat distal colon superficial ente-rocytes. Cell Physiol Biochem 2013;32:1551-65.
48. Karmakar R, Banerjee A, Datta S, Chatterjee M. Influence of cad-mium intoxication on hepatic lipid peroxidation, glutathione level, and glutathione S-transferase and gamma-glutamyl transpeptidase activities: correlation with chromosome aberrations in bone mar-row cells. J Environ Pathol Tox 1999;18:277-87.
49. Yano CL, Marcondes MC. Cadmium chloride-induced oxidative stress in skeletal muscle cells in vitro. Free Radical Biol Med 2005;39:1378-84.
50. Spatz L. Introduction. In: Spatz L, Bloom AD, eds. Biological conse-quences of oxidative stress. New York, NY: Oxford University Press; 1992. pp 3-22.