www.solid-earth.net/7/673/2016/ doi:10.5194/se-7-673-2016
© Author(s) 2016. CC Attribution 3.0 License.
Assessment of combating-desertification strategies
using the linear assignment method
Mohammad Hassan Sadeghravesh1, Hassan Khosravi2, and Soudeh Ghasemian2
1Department of Environment, College of Agriculture, Takestan Branch, Islamic Azad University, Takestan, Iran 2Department of Arid and Mountainous Reclamation Region, Faculty of Natural Resources,
University of Tehran, Tehran, Iran
Correspondence to: Hassan Khosravi ([email protected])
Received: 20 December 2015 – Published in Solid Earth Discuss.: 18 January 2016 Revised: 2 April 2016 – Accepted: 5 April 2016 – Published: 27 April 2016
Abstract. Nowadays desertification, as a global problem, affects many countries in the world, especially developing countries like Iran. With respect to increasing importance of desertification and its complexity, the necessity of attention to the optimal combating-desertification alternatives is essen-tial. Selecting appropriate strategies according to all effective criteria to combat the desertification process can be useful in rehabilitating degraded lands and avoiding degradation in vulnerable fields. This study provides systematic and opti-mal strategies of combating desertification by use of a group decision-making model. To this end, the preferences of in-dexes were obtained through using the Delphi model, within the framework of multi-attribute decision making (MADM). Then, priorities of strategies were evaluated by using linear assignment (LA) method. According to the results, the strate-gies to prevent improper change of land use (A18), develop-ment and reclamation of plant cover (A23), and control over-charging of groundwater resources (A31) were identified as the most important strategies for combating desertification in this study area. Therefore, it is suggested that the afore-mentioned ranking results be considered in projects which control and reduce the effects of desertification and rehabili-tate degraded lands.
1 Introduction
Desertification is a significant global environmental and the socioeconomic problem in the world (Miao et al., 2015). Desertification is defined as a process of land degrada-tion in arid, semi-arid and sub-humid areas due to various
factors including climatic variations and human activities (Barbero-Sierra et al., 2015). Land degradation and its vi-cious form in arid and semi-arid lands, desertification, are still widespread – jeopardizing livelihoods and sustainable development (Fleskens and Stringer, 2014). They affect vul-nerable populations and fragile ecosystems with irreversible outcomes (Bisaro et al., 2014). According to the United Na-tions Conference on Desertification (UNCOD), the desertifi-cation process threatens more than 785 million people living in arid regions. Of this number, 60 to 100 million people are affected by this phenomenon directly due to the loss of land fertility and other desertification processes (Meshkat, 1998). There are 100 million hectares in Iran facing desertification, especially wind erosion, water erosion and physicochemi-cal destruction (Forest, Rangeland and Watershed Institute, 2005). Strong communication between scientific knowledge and stakeholders is needed to slow down and reverse the im-pacts of land degradation on drylands (Barbero-Sierra et al., 2015).
as-674 M. H. Sadeghravesh et al.: Assessment of combating-desertification strategies
signment (LA) method were used to rank desertification al-ternatives.
Managing desert ecosystems consist of various manage-ments to control desertification phenomenon and minimize economic, social and environmental loss. Making decisions about the management of desert areas becomes a complex process due to the existence of various indexes and various criteria for decision-making in such areas. There are several methods for managing desert regions, and each has differ-ent preferences for environmdiffer-ental, social, political, economic and organizational issues. Among these different methods, multi-attribute decision making (MADM) can provide the best answers in comparison to others. The purpose of this study, by considering limitation of inputs, is to assess de-sertification strategies to achieve the optimal strategies in the framework of sustainable management of desert area. To achieve this goal, the LA method, which is one kind of concordance method, was used in the framework of MADM to rank combating-desertification strategies. This method has a simple algorithm that can engage simultaneously a large number of quantitative and qualitative criteria in the decision-making process. Additionally, in different intervals of time and place, it is also capable of changing the input data and providing new assessments according to this change. Therefore, comparative studies would be easy to do (Asghar-pour, 1999).
LA has two advantages: first being descriptive and second being easy to understand. Therefore, it has been applied in various fields of science (Bernardo and Blin, 1977). Some of these studies include assessing environmental sustainabil-ity (Hosseinzadeh et al., 2011), assessing and ranking risks (Sayadi et al., 2011), monitoring sensitivity of desertifica-tion (Symeonakis et al., 2014), footprint of research in deser-tification management (Miao et al., 2015), characterization and interaction of driving factors in desertification (Xu and Zhang, 2014), identifying susceptible areas toward desertifi-cation (Vieira et al., 2015), evaluation of soil fertility in the succession of karst rocky desertification (Xie et al., 2014), assessing environmental sensitivity of areas toward desertifi-cation (Sobhand and Khosravi, 2015), financial assessment of companies (Mohammadi, 2011), assessing strategies of water supply (Mianabadi and Afshar, 2008), zoning water-sheds (Ramesht and Arabameri, 2012), assigning water re-sources in order to minimize the energy consumption (Joung et al., 2012), programming of robots (Ji et al., 1992), pro-gramming the dispatch of helicopters in emergency missions (Celi, 2007) and so on and so forth.
By studying the research literature using decision mod-els to provide optimal strategies in desert management is limited to research of Grau et al. (2010), Sadeghiravesh et al. (2010, 2013, 2014, 2016) and Sepehr and Peroyan (2011). In order to select the optimal strategies for providing an integrated plan to control erosion and desertification, Grau used three decision models in his research: Elimination and Choice Expressing Reality (ELECTRE), analytical
hierar-chy process (AHP) and Preference Ranking Organization Method For Enrichment Evaluation (PROMETHEE) (Grau et al., 2010). The results indicate the high efficiency of these models to provide an optimal strategy of desertifica-tion. Due to the use of complex methods in each model, the results were largely the same. Sadeghiravesh et al. prioritize the strategies in the Khezrabad region by using the follow-ing models: AHP (Sadeghiravesh et al., 2010), ELECTRE (Sadeghiravesh et al., 2014), weighted sum model (WSM) (Sadeghiravesh and Zehtabian, 2013), BORDA (Sadeghi-ravesh, 2014), PERMUTATION (Sadeghi(Sadeghi-ravesh, 2013), and PROMETHEE (Sadeghiravesh et al., 2016). The results of these studies are the same and largely similar to the results of previous research. Sepehr and Peroyan zoned the vulner-ability of desertification in the ecosystems of the Khorasan Razavi Province and evaluated these strategies to combat de-sertification (Sepehr and Peroyan, 2011).
All in all, determining effective combating-desertification alternatives and criteria is essential for achieving efficient projects to combat desertification. Hence, this research uses the linear assignment method to objectively select the opti-mal combating-desertification alternatives based on the re-sults of interviews with experts in the Khezrabad region in Yazd province, Iran, as the case study.
2 Material and methods
2.1 Study area
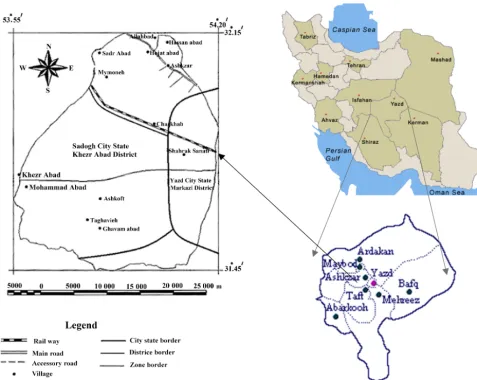
The Khezrabad region in Yazd province, central Iran, was chosen for optimal determination of alternatives to combat desertification. The study area is located nearly 10 km west of Yazd. The region extends from 53◦550to 54◦200E in lon-gitude and from 31◦450 to 32◦150N in latitude and covers an area of about 78 180 ha (Fig. 1). The climate of the study area is cold and arid, based on the Amberje climate classifica-tion method (Sadeghiravesh, 2008). About 12 930 ha (16 %) of the region is hilly, and a sand-dune area1, which is a part of the Ashkezar Great Erg2, is located in the northern part of the study area. About 9022 ha (12 %) of the area consists of bare lands, clay plain and desert pavement3(Sadeghiravesh, 2008; Kazemi Nejad, 1996). About 1995 ha (26.5 %) of all the agri-cultural land in the region consists of degraded or abounded lands with human activities such as traditional irrigation and natural processes like wind erosion and dust. The study area shows an absolutely typical condition of desertification, so effective solutions and optimal means of combating deserti-fication must be pursued.
1An isolated hill, knob, ridge, outcrop or small mountain. 2An erg (also sand sea or dune sea, or sand sheet if it lacks
dunes) is a broad, flat area of desert covered with wind-swept sand.
3A desert surface covered with closely packed, interlocking
Figure 1. Location of the study area.
2.2 Methodology
Linear assignment is one of the most important methods of MADM and a subset of concordance methods. LA can help decision makers choose the best option by combining qual-itative and quantqual-itative indexes and providing appropriate weighting for each criterion. The output of this model is a collection of ranks, so it provides the required coordination in the most suitable way. In this method, given choices of moot point are ranked according to their scores on each index and the final ranking of the alternatives will be characterized through linear compensation processing (for every possible interaction between indexes) (Asgharpour, 1999). Based on the property simplex solution space of LA, the optimum so-lution is extracted in a convex space simplex and by consid-ering all the arrangements implicitly. Moreover, the compen-sation property of the indexes is obtained from exchange be-tween ranks and options (Pomerol and Romero, 2000); how-ever, the weight vector of indexes has been obtained through expert opinion and the Delphi model.
2.2.1 Selection of criteria and effective strategies
676 M. H. Sadeghravesh et al.: Assessment of combating-desertification strategies
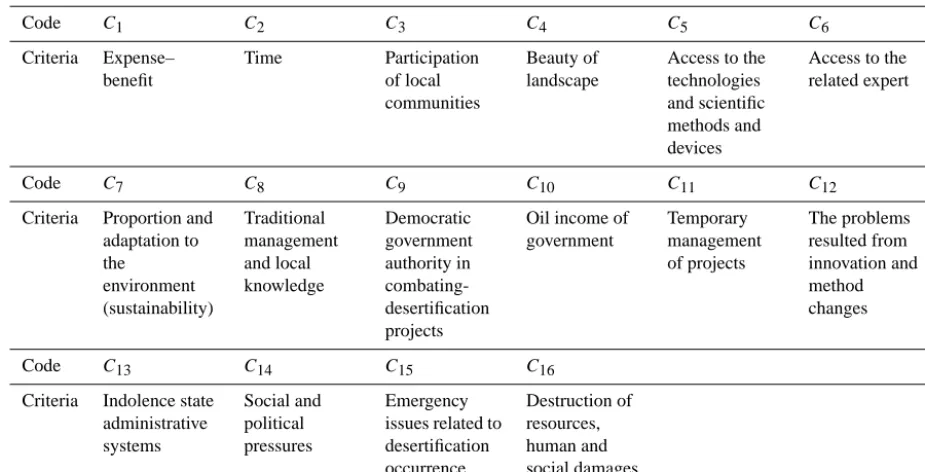
Table 1. The criteria and their importance mean according to the group.
Code C1 C2 C3 C4 C5 C6
Criteria Expense– benefit
Time Participation
of local communities
Beauty of landscape
Access to the technologies and scientific methods and devices
Access to the related expert
Code C7 C8 C9 C10 C11 C12
Criteria Proportion and adaptation to the
environment (sustainability)
Traditional management and local knowledge
Democratic government authority in combating-desertification projects
Oil income of government
Temporary management of projects
The problems resulted from innovation and method changes
Code C13 C14 C15 C16
Criteria Indolence state administrative systems
Social and political pressures
Emergency issues related to desertification occurrence
Destruction of resources, human and social damages
Table 2. Importance and priority degree according to the nine-point Saaty scale.
Score Importance degree Priority degree in pairwise comparison
1 Non-importance Equal
2 Very low Equal–moderately
3 Low Moderately
4 Relatively low Moderately–strongly
5 Medium Strongly
6 Relatively high Strongly–very strongly
7 High Very strongly
8 Very high Very strongly–extremely
9 Excellent Extremely
1/2, 1/3,1/4, . . . , 1/9 Mutual values
2.2.2 Calculation of local priority of criteria and alternatives and establishment of group pairwise comparison matrix
In order to achieve local priority, the structured questionnaire was designed based on literature and the nine-point Saaty scale: 1 (least important) to 9 (most important). They were used to measure the relative importance of criteria and prior-ity of combating-desertification alternatives (Table 2).
The questionnaire was distributed among experts familiar with the study area. Using geometric mean and assumption of expert’s opinion (considering all opinions have same value), pairwise comparisons matrixes were obtained according to Eq. (1) and formed in a group format (Table 3).
aij=
πkN=1aijk 1
N
(1)
Table 3. Pairwise comparisons matrix.
a11 a12 . . . a1n
A= a21 a22 . . . a2n A=[aij]i, j=1, 2 , . . . ,n
. .
. ... ... ...
an1 an2 . . . ann aijis the preference oficriteria tojcriteria.
In this equation,aijkis the component ofkexpert to com-parisoniandj. So,aij(geometric mean) for all correspond-ing components is obtained by Eq. (1) (Azar and Rajabzadeh, 2002; Ghodsipour, 2002).
2.2.3 Computation of the priorities based on group pairwise comparison tables
At this stage, the data of group pairwise comparison matrixes were imported in EC software to evaluate criterion, impor-tance and alternative priorities to each criterion (Godsipour, 2002). After normalization by using Eq. (2) importance and priorities percent were showed as bar graphs using the har-monic mean method or average of each level of normalized matrix (Tables 5 and 6).
rij= aij P
i=1aij
(2)
Table 4. Normalized decision matrix.
Alt Criterion
C1 C2 C3 . . . Cn
W1 W2 W3 . . . Wn
A1 P11 P12 P13 . . . P1n
A2 P21 P22 P23 . . . P2n
. .
. ... ... ... ... ...
Am Pm1 Pm2 Pm3 . . . Pmn
In this matrix,mis the number of choices or alternatives, nis number of criteria,Cis the title of criteria,Wis the weight value of related criteria andaijis the weight
value each alternative gains in relation to related criteria.
2.2.4 Formation of normalized decision matrix
The weight values of criterion importance (Wj) and alterna-tive priorities (Pij) are considered in the form of a decision matrix based on any criteria (Table 4).
2.2.5 Ranking each option for each index
After forming the decision-making matrix, we attempted to rank the alternatives (Ai) for each criteria (Ci) with respect to the increasing or decreasing trends andn×mmatrix frame-work (Table 7).
2.2.6 Forming two-dimensional gamma (γ) matrix
A two-dimensional (γ) matrix (assignment matrix) is formed according to the weight vector of the estimated criteria of group pairwise comparison. This matrix is a square matrix (γm×m) which has element i in its row and element k in its column. Matrix elements include the total weight of in-dexes, in which the alternative ofihas rankk. The (γ) ma-trix is a assignment mama-trix, so the optimal solution can be obtained by any kind of assignment methods such as the ship-ping method, Hungarian method, grid method and 1–0 linear programming method. The most common method for solv-ing the LA is the assignment programmsolv-ing method (Pomerol and Romero, 2000).
2.2.7 Calculating the final rank for each alternative (Ai)
The final ranking/optimal solution of alternatives is obtained by linear programming method and through the following model:
maximize m X
i=1 m X
k=1
γikhik, (3)
subject to m X
k=1
hik=1; i=1,2,3, . . ., m, (4) m X
i=1
hik=1be; k=1,2,3, . . ., m; hik
=
1
=0. (5)
After solving the linear programming model, a square ma-trix (Hm×m) is considered whereAi is given the finalkrank (hik=1); otherwisehik=0 (Burkard and Qela, 1999; Liu, 2000)
The obvious feature of this method is a simple ranking for alternatives that caused exchanged among indexes and have no complex calculations. Also, in this method there is no need for the unification scale (Saaty and Vargas, 2006; As-gharpour, 1999). Meanwhile, other methods such as MADM need both alternatives and indexes for calculating, but rank-ing process of LA can be done without an alternative (Tajod-dini, 2003).
3 Results and discussion
In the process of assessing combating-desertification alterna-tives in the study area, the Delphi method and questionnaire were used to identify the main criteria and alternatives among 16 criteria and 40 combating-desertification alternatives and establishing hierarchical structure (Saaty, 1995) according to the group format. Tables 8 and 9 show the average of alter-native priority and criterion importance, respectively.
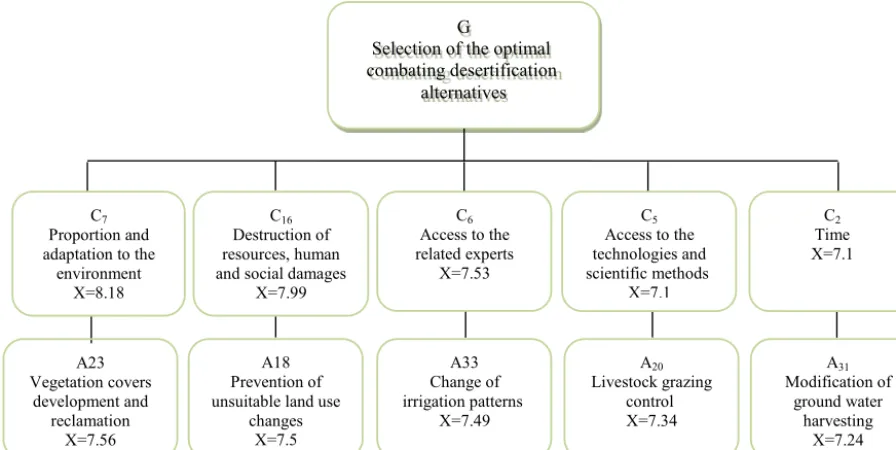
The obtained results of presented questionnaire (to deter-mine importance and priority of criteria and alternatives to establish decision hierarchical structure) show only criteria and alternatives with a group mean larger than 7. This con-sidered establishing decision hierarchical chart and provid-ing pairwise comparisons questionnaires. Figure 2 show hi-erarchical decision structure based on effective criteria and alternatives to combat desertification.
3.1 Calculating relative weight of criteria and alternatives and formatting the group decision matrix
In order to estimate the relative weight or priority of cri-teria and alternatives, a pairwise comparison questionnaire was prepared and distributed among the experts. The group pairwise comparison matrixes of criterion importance and al-ternative priorities to each criterion were formed by obtain-ing expert opinions and combinobtain-ing their ideas by geometric mean. To prevent the prolongation of the word, just matrixes of criterion importance (Table 10) and alternative priorities to each criteria calculated by this method are presented.
678 M. H. Sadeghravesh et al.: Assessment of combating-desertification strategies
Table 5. Comparison of proposed criterion importance to access the goal.
7 ij ā = group pair wise comparison component of i to j
Σāij = total column of group pair wise comparisons
2.2.4 Formation of Normalized Decision Matrix (NDM)
The weight values of criteria importance (Wj) and alternative priorities (Pij) is considered in the form of a decision matrix based on any criteria (Table 4).
5
Table4. Normalized Decision Matrix
10
15
In this matrix: m= the number of choices or alternatives, n= number of criteria, C= title of criteria, W= Weight value of related criteria, aij= weight value each alternative gains in relation to related criteria
Table5. Comparison of proposed criteria importance to access the goal 20
Criterion Preference degree
C7 33.3
C16 31.3
C6 15.7
C5 11
C2 8.9
Inconsistency ratio=0.01
Table6. Comparison of alternatives preference according to the criteria of proportion and adaptation to the environment
Alternative Degree
A18 26.6
A23 22.7
A31 19.2
A33 15.9
A20 15.5
Inconsistency Ratio=0.02
2.2.5 Ranking each option for each index
Criterion Alt Cn --- C3 C2 C1 Wn --- W3 W2 W1 P1n --- P13 P12 P11 A1 P2n --- P23 P22 P21 A2 ׃ ׃ ׃ ׃ ׃ ׃ Pmn ---Pm3 Pm2 Pm1 Am
Table 6. Comparison of alternative preference according to the criteria of proportion and adaptation to the environment.
7 ij ā = group pair wise comparison component of i to j Σāij = total column of group pair wise comparisons
2.2.4 Formation of Normalized Decision Matrix (NDM)
The weight values of criteria importance (Wj) and alternative priorities (Pij) is considered in the form of a decision matrix based on any criteria (Table 4).
5
Table4. Normalized Decision Matrix
10
15
In this matrix: m= the number of choices or alternatives, n= number of criteria, C= title of criteria, W= Weight value of related criteria, aij= weight value each alternative gains in relation to related criteria
Table5. Comparison of proposed criteria importance to access the goal 20
Criterion Preference Degree
C7 33.3
C16 31.3
C6 15.7
C5 11
C2 8.9
Inconsistency Ratio=0.01
Table6. Comparison of alternatives preference according to the criteria of proportion and adaptation to the environment
Alternative Degree
A18 26.6
A23 22.7
A31 19.2
A33 15.9
A20 15.5
Inconsistency ratio=0.02
2.2.5 Ranking each option for each index
Criterion Alt Cn --- C3 C2 C1 Wn --- W3 W2 W1 P1n --- P13 P12 P11 A1 P2n --- P23 P22 P21 A2 ׃ ׃ ׃ ׃ ׃ ׃ Pmn ---Pm3 Pm2 Pm1 Am
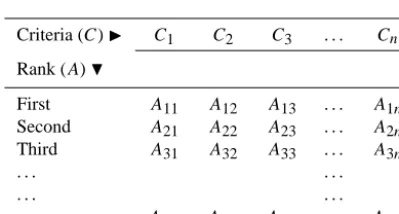
Table 7. Matrix ranking of each option against each index.
Criteria (C)I C1 C2 C3 . . . Cn
Rank (A)H
First A11 A12 A13 . . . A1n
Second A21 A22 A23 . . . A2n
Third A31 A32 A33 . . . A3n
. . . .
. . . .
m Am1 Am2 Am3 . . . Amn
In this matrix,mis the number of choices or alternatives,nis the number of criteria,Cis the title of criteria andaijis the each alternative
in relation to related criteria.
Considering these graphs, one can observe that the alter-natives are different based on each criterion. Therefore, the decision-making matrix of optimal combating-desertification alternatives according to the group (Table 12) was formed to select final alternatives and classification of their priorities in the general framework of MADM (Table 4).
3.2 Ranking each option for each index
After forming the decision-making matrix, we attempted to rank the alternatives (Ai) for each criteria (Ci) in a 5×5 matrix in which the rows represent rank and columns repre-sent the index (Table 13). The decision matrix of combating-desertification alternatives has an increasing trend, which means the allocated number of each alternative is more than the number of each criterion, so that alternative is more de-sirable than the others.
3.3 Formingγ5×5matrix according to criterion weights (W)
At this stage a 5×5γmatrix is formed, and it was estimated by the sum of index weights in which the alternative ofihas rankk. As mentioned, the weight of each index was calcu-lated by surveying experts and based on the Delphi method (Table 14).
Theγ matrix is an assignment matrix, and the optimal an-swer can be obtained by any of assignment methods. The most common method for solving the linear assignment method is linear programming.
3.4 Ranking alternatives
For final ranking of alternatives, linear programming was used (Eqs. 1 to 3), and a scoring table of options or optimal matrix was formed (Table 11). Since the decision variable contains 0 and 1 value, the output of this program is pro-vided only based on the number 1 in Table 15. Table 16 was formed according to Table 15.
Based on Table 17, the preference of alternatives was ob-tained as A18> A23> A31> A33> A20. After evaluating all alternatives,A18considered to be the best one.
4 Discussion
men-G
Selection of the optimal combating desertification
alternatives
C7 Proportion and adaptation to the
environment X=8.18
C16 Destruction of resources, human and social damages
X=7.99
C6 Access to the related experts
X=7.53
C5 Access to the technologies and scientific methods
X=7.1
C2 Time X=7.1
A18 Prevention of unsuitable land use
changes X=7.5
A33 Change of irrigation patterns
X=7.49
A20 Livestock grazing
control X=7.34
A31 Modification of
ground water harvesting
X=7.24 A23
Vegetation covers development and
reclamation X=7.56
Figure 2. Hierarchical decision structure to select optimal combating-desertification alternatives in study area.
Table 8. The criteria importance mean according to the group.
Code C1 C2 C3 C4 C5 C6 C7 C8 C9 C10 C11 C12 C13 C14 C15 C16
Average 5.38 7.1 5.78 5.1 7.1 7.53 8.15 5.23 5.28 5.72 2.39 2.84 2.29 5.35 6.34 7.99
values
tioned, that the LA method has the limitation of ignoring decision makers fuzzy judgment as well as aforementioned methods. Additionally, some criteria have qualitative or un-known structures that cannot be accurately measured. In such cases, fuzzy numbers can be used in order to achieve evalu-ation matrix, and the prioritizevalu-ation method can be developed using the fuzzy method. Another disadvantage of the LA method is regarding the amount of data and considering only the data ranks. Therefore, large amounts of data are lost and achieving high-accuracy results would not be possible (Mo-hammadi, 2011). Consequently, it is better to not use rating models such as ELECTRE and LA when accurate amounts of data are available. The following results were obtained us-ing pairwise comparisons questionnaires, the mean of expert opinions, group pairwise comparisons matrix of importance and priority of criteria and alternatives. According to the de-cision matrix’s table of optimal combating-desertification al-ternatives (Table 12), criteria of proportion and adaptation to environment (C7) and time (C2) have the highest and low-est importance, respectively. Criterion proportion and adap-tation to the environment (C7) with an importance degree of 33.6 % and destruction of resources, human and social dam-ages (C16) with 30.7 % were placed in first and second order, respectively. This indicates that experts are more concerned about environmental issues, and challenges rose in
680 M. H. Sadeghravesh et al.: Assessment of combating-desertification strategies
Table 9. The recommended alternatives to combat desertification and their priority according to the groups.
Code Alternative Value
A1 Reducing population growth rates 5
A2 Poverty alleviation 5.68
A3 Establishment and development of rural organizations 5.35
A4 Increasing employment 6.7
A5 Increasing participation of local community and supporting NGOs 6.1
A6 Application of local forces and technology in projects (local knowledge) 6.56
A7 Training people in utilization of new methods and use of new knowledge for optimal use of resources 6.47
A8 Approval, promotion and implementation of laws and adaptation punishments with the crime 5.73
A9 Providing needs of local residents 5.89
A10 Modification of unsustainable consumption patterns, changing and improving people’s livelihood patterns 5.6
A11 Considering the role of women and youth in combating-desertification process 4.5
A12 Organization of urban areas and prevent migration 5.23
A13 Coordination between responsible agencies and organizations in combating-desertification and environmental protection 6.86
A14 Raising the literacy rate 4.8
A15 Development of desert ecotourism 5.32
A16 Multi-utilization from desert instead of mono-utilization 5.27
A17 Allocation combating-desertification issue to the private sector 3.79
A18 Prevention of unsuitable land use changes 7.5
A19 Mapping land use planning and determination of desert and salt desert boundaries 6.44
A20 Livestock grazing control 7.34
A21 Forage production and increasing economic potential of sustainable husbandry 6.6
A22 Prevention of plant cutting 6.46
A23 Vegetation cover development and reclamation 7.56
A24 Protection of Haloxylon spp. 6.76
A25 Protection of gravel surfaces (Reg) 6.45
A26 Prevention and reduction in heavy agricultural and industrial machinery traffic 5.57
A27 Create living and non-living wind break for soil conservation 6.86
A28 Improvement of soil texture 4.66
A29 Modification of crop rotation and follow methods 5.42
A30 Modification of ploughing, fertilization and spraying methods 5.1
A31 Modification of groundwater harvesting 7.24
A32 Reduction in water consumption (water-optimal consumption in farms) 6.6
A33 Change of irrigation patterns 7.49
A34 Changing traditional irrigation systems with low to modern systems with high efficiency 6.53
A35 Optimal collecting and harvesting of water resources (including rivers isolating, qanat repairing and dredging, 6.64
utilization of canals and streams and desalination of salty waters)
A36 Groundwater feed 6.08
A37 Construction of flood broadcast networks and the use of its alluviums 5.3
A38 Creation of artificial precipitation to feed aquifers 3.47
A39 Promotion of greenhouse cultivation 6.2
A40 Introduction of new plant varieties, resistant to drought and dehydration stress by genetic engineering 6
Table 10. Pairwise comparisons matrix of the criterion importance to complete the goal of “offering optimal combating-desertification alternatives”.
Criterion C16 C6 C5 C2
C7 1.2 2.5 2.5 3.4
C16 2.3 3.1 3.1
C6 1.7 2
C5 1.3
streams with large pores in bed; therefore, more than 50 % of
water’s consumption is wasted and the efficiency of irrigation and transmission is estimated to be less than 40 %.
5 Conclusions
Table 11. Comparison of proposed criterion importance to access the goal.
12
Criterion Preference degree
C7 33.3
C16 31.3
C6 15.7
C5 11
C2 8.9
Inconsistency ratio=0.01
Considering these graphs, it is observed that the alternatives are different based on each criterion. Therefore, decision making matrix of optimal combating desertification alternatives according to the group (Table 12) was formed to select final alternatives and classification of their priorities in general framework of MADM (Table 4).
Table12. Decision matrix of optimal combating desertification alternatives according to group
5
Criteria importance (C) ► Alternatives priority (A) ▼
C2 C5 C6 C16 C7
0.0892 0.1095 0.1576 0.3074 0.3365
A23 0.2509 0.2387 0.2488 0.1805 0.2257
A18 0.1960 0.1635 0.1983 0.2383 0.2643
A33 0.1620 0.2565 0.2093 0.1510 0.1599
A20 0.2229 0.1762 0.1608 0.2209 0.1582
A31 0.1682 0.1633 0.1826 0.2092 0.1918
3.3 Ranking each option for each index
After forming the decision making matrix attempted to rank the alternatives (Ai) for each criteria (Ci) in a 5×5 matrix which the rows represent rank and columns represent the index (Table13). Decision matrix of combating desertification alternatives has increasing trend which means the allocate number of each alternative is more than the number of each criterion, so that alternative is more desirable among the others.
10
Table13. Matrix of alternative ranking
Criteria (C) ►
C7 C16 C6 C5 C2
Rank (A) ▼
First A18 A18 A23 A33 A23
Second A23 A20 A33 A23 A20
Third A31 A31 A18 A20 A18
Forth A33 A23 A31 A18 A31
Fifth A20 A33 A20 A31 A33
3.4 Forming γ5×5 matrix according to criteria weights (W)
Table 12. Decision matrix of optimal combating-desertification alternatives according to group.
Criterion importance (C)I C2 C5 C6 C16 C7
Alternatives priority (A)H
0.0892 0.1095 0.1576 0.3074 0.3365
A23 0.2509 0.2387 0.2488 0.1805 0.2257
A18 0.1960 0.1635 0.1983 0.2383 0.2643
A33 0.1620 0.2565 0.2093 0.1510 0.1599
A20 0.2229 0.1762 0.1608 0.2209 0.1582
A31 0.1682 0.1633 0.1826 0.2092 0.1918
Table 13. Matrix of alternative ranking.
Criteria (C)I C7 C16 C6 C5 C2
Rank (A)H
First A18 A18 A23 A33 A23
Second A23 A20 A33 A23 A20
Third A31 A31 A18 A20 A18
Fourth A33 A23 A31 A18 A31
Fifth A20 A33 A20 A31 A33
Table 14. The matrix of number time weight of ranking options.
Rank (C)I First Second Third Fourth Fifth
Alternative priority (A)H
A23 0.2468 0.446 0 0.3074 0
A18 0.6439 0 0.2468 0.1095 0
A33 0.1095 0.1576 0 0.3365 0.3966
A20 0 0.3966 0.1095 0 0.4941
A31 0 0 0.6439 0.2468 0.1095
Hence, in the framework of macro-strategies executive offers are recommended in the following:
– taking serious spatial planning and estimating ecolog-ical potential at national, regional and local levels and adapting the applications to the land potential
– avoiding land use changes in poor rangelands with low fertility
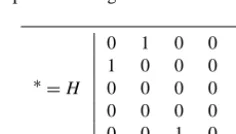
Table 15. The options scoring.
0 1 0 0 0
1 0 0 0 0
∗=
H 0 0 0 0 1
0 0 0 0 1
0 0 1 0 0
The optimal objective function=2.6245.
Table 16. The matrix of options optical order.
0 A18 0 0 0
A23 0 0 0 0
A=∗×H 0 0 0 0 A31
0 0 0 0 A33
0 0 A33 0 0
– avoid the development of industries in sensitive and fragile regions
– in terms of development and reclamation of vegetation, it is better to use endemic and resistant species and pres-surized irrigation systems
– balance the number of livestock and pasture capacity – avoid grazing off-season in desert rangelands (early and
682 M. H. Sadeghravesh et al.: Assessment of combating-desertification strategies
Table 17. The options ranking.
A18 A23 A31 A33 A20
regions are limited; thus, arid land managers should take the results of this research into account for preventing any waste of those limited investments.
Finally, it is recommended that all combating-desertification projects in the study area be done based on all aforementioned alternatives. In this case, less in-vestment would be wasted and the efficiency of such rehabilitation projects may increase. The results of this study will allow desert managers to apply limited investment and facilities in efficient ways to control the process of desertification. Hence, we can achieve better results and avoid wasting national investments.
Edited by: A. Cerdà
References
Asgharpour, M. J.: Multiple criteria decision making, University of Tehran, Tehran, p. 397, 1999.
Azar, A. and Memariani, A.: AHP new technique for group deci-sion, Knowledge Management Magazine, 28, 22–32, 2003. Azar, A. and Rajabzadeh, A.: Applied decision making, Tehran,
Ne-gahe Danesh, 1st Edn., p. 185, 2002.
Barbero-Sierra, C., Marques, M. J., Ruiz-Pérez, M., Escadafal, R., and Exbrayat, W.: How is Desertification Research Addressed in Spain? Land Versus Soil Approaches, Land Degrad. Dev., 26, 423–432, 2015.
Bernardo, J. J. and Blin, J. M.: A programming model of consumer choice among multi-attributed brands, J. Consum. Res., 4, 111– 118, 1977.
Bisaro, A., Kirk, M., Zdruli, P., and Zimmermann, W.: Global drivers setting desertification research priorities: Insights from a stakeholder consultation forum, Land Degrad. Dev., 25, 5–16, 2014.
Burkard, R. E. and Qela, E.: Linear assignment problems and ex-tensions, in Handbook of Combinatorial Optimization, Springer, 75–149, 1999.
Celi, R.: Rotorcraft dispatching in large-scale emergencies using sequential linear assignment techniques, Presented at the at the AHS 63rd Annual Forum, Virginia Beach, VA, 2–4 May, 2007. Fleskens, L. and Stringer, L. C.: Land management and policy
re-sponses to mitigate desertification and land degradation, Land Degrad. Dev., 25, 1–4, 2014.
Forest, Rangeland and Watershed Institute: summary of manage-ment program of Iran desert area (2005–2024), 61 pp., 2005. Ghodsipour, S. H.: Analytical Hierarchy Process (AHP), Amirkabir
University, Tehran, 220 pp., 2002.
Grau, J. B., Antón, J. M., Tarquis, A. M., Colombo, F., de los Ríos, L., and Cisneros, J. M.: An application of mathematical mod-els to select the optimal alternative for an integral plan to de-sertification and erosion control (Chaco Area – Salta Province
– Argentina), Biogeosciences, 7, 3421–3433, doi:10.5194/bg-7-3421-2010, 2010.
Hosseinzadeh, S. Y., Khosravibaygi, R., Istageldi, M., and Sham-sodini, R.: An assessment of environmental assessment of urban area Using the technique of linear allocation Multiple Criteria Decision Makin (Case study: Bandar-e Turkaman city, Iran), J. Geogr. Land., 16, 31–51, 2011.
Ivani, H. and Sofi, M.: Assessment of Regional Development Us-ing Taxonomy Model (A Case of Razavi Khorasan, Iran), Am. J. Eng. Res., 3, 12–17, 2014.
Ji, Z., Leu, M. C., and Wong, H.: Application of Linear Assignment Model for Planning of Robotic Printed Circuit Board Assembly, J. Electron. Packag., 114, 455–460, 1992.
Joung, J., Keong Ho, C., Hui Tan, P., and Sun, S.: Energy Min-imization in OFDMA Downlink Systems: A Sequential Linear Assignment Algorithm for Resource Allocation, IEEE Wireless Commun. Lett., 1, 300–303, 2012.
Kazemi Nejad, A.: The study of sand dune movement, M.Sc. thesis, University of Tehran, 1996.
Law Office of Environment and Parliamentary Affairs: International Contract, Laws and regulations the environment protection, Pub-lication of Environment Organization, 847 pp., 2004.
Liu, S. C.: A Fuzzy Multiple Attribute Decision Making Approach for Linear Assignment Problems, Fifth Asia Pacific Decision Sci-ences Institute Conference Waseda University, Tokyo, Japan, 24– 27 July, 2000.
Meshkat, M. A.: Integrated methods for monitoring and assessing desertification, publication of Forest, Rangeland and Watershed Institute, 145 pp., 1998.
Mianabadi, H. and Afshar, A.: Multi attribute decision making to rank urban water supply schemes, Water & Wastewater Journal, 19, 34–45, 2008.
Miao, L., Moore, J. C., Zeng, F., Lei, J., Ding, J., He, B., and Cui, X.: Footprint of Research in Desertification Management in China, Land Degrad. Dev., 26, 450–457, 2015.
Mohammadi, A.: A comparative applied study of linear alloca-tion TOPSIS method and Taxonomy in financial evaluaalloca-tion, Eco-nomic Research, 11, 273–302, 2011.
Pomerol, J. C. and Romero, S. B.: Multi-Criterion Decision in Man-agement: Principles and practice, International Series in Opera-tions Research & Management Science, the Netherlands, Kluwer Academic, Dordrecht, 2000.
Ramesht, M. H. and Arabameri, A. R.: Shahrood-Bastam Basin Zoning for the Purpose of Artificial Underground Aquifer Recharge by Using Linear Assignment Method and GIS Tech-nique, Geographic Space, 40, 134–149, 2012.
Saaty, T. L.: Decision making for leaders: The Analytic Hierarchy Process for Decision in a complex world, vo1 H, Rws, 1995. Saaty, T. L. and Vargas, L. G.: Decision, making with the Analytic
Network Process: Economic, Political, Social and Technological Applications with Benefits, Opportunities, Costs and Risks, New York, Springer, 2006.
Sadeghiravesh, M. H.: the research of desertification effective fac-tors in environmental destroy (case study: Khezr Abad Zone, En-vironmental Management thesis, Islamic Azad University, 395 pp., 2008.
Sadeghiravesh, M. H.: Evaluation of combat desertification alter-natives by using BORDA ranking model, Case study: Khezr Abad region, Yazd province, J. Environ. Plan. Manage., 1, 13– 24, 2014.
Sadeghiravesh, M. H. and Zehtabian, G.: Combat desertification al-ternatives classification with using of Multi Attribute Decision Making (MADM) view point and Weighted Sum Model (WSM), Case study: Khezr Abad region, Yazd province, Journal of Pa-jouhesh & Sazandeghi, 100, 1–11, 2013.
Sadeghiravesh, M. H., Ahmadi, H., Zehtabian, G. H., and Tahmores, M.: Application of analytical hierar- chy process (AHP) in as-sessment of dedesertification alternatives, case study: Khezrabad region, Yazd province, Iranian Journal of Range and Desert Re-search, 17, 35–50, 2010.
Sadeghiravesh, M. H., Zehtabian, G. R., Ahmadi, H., and Khos-ravi, H.: Using Analytic Hierarchy Process method and Order-ing Technique to Assess CombatOrder-ing desertification Alternatives (Case study: Khezrabad, Yazd, Iran), Carpath. J. Earth Env. Sci., 7, 51–60, 2013.
Sadeghiravesh, M. H., Zehtabian, G., and Khosravi, H.: Applica-tion of AHP and ELECTRE models for assessment of combating desertification alternatives, Desert, 19, 141–153, 2014.
Sadeghiravesh, M. H., Khosravi, H., Abolhasani, A., and Shekoohi, S.: Evaluation of Combating Desertification Alternatives using PROMETHEE Model, J. Geogr. Geol., 8, 28–41, 2016. Sayyadi, A. R., Hayati, M., and Azar, A.: Assessment and Ranking
of Risks in Tunneling Projects Using Linear Assignment Tech-nique, Int. J. Ind. Eng. P. Manage., 22, 27–38, 2011.
Sepehr, A. and Peroyan, N.: vulnerability Mapping of desertifica-tion and combat desertificadesertifica-tion alternative ranking in Korasan-e-razavi province ecosystems with application PROMETHEE model, J. Earth Sci. Res., 8, 58–71, 2011.
Sobhani, A. and Khosravi, H.: Assessing Environmental Sensitivity Areas to Desertification in North of Iran, Curr. World Environ., 10, 890–902, 2015.
Symeonakis, E., Karathanasis, N., Koukoulas, S., and Panagopou-los, G.: Monitoring sensitivity to land degradation and desertifi-cation with the environmentally sensitive area index: The case of lesvos island, Land Degrad. Dev., doi:10.1002/ldr.2285, 2014. Tajoddini, I.: Identification and prioritization of quality standard
Prerequisites in industry, Modiriat Farda, 2, 82–88, 2003. Vieira, R. M. S. P., Tomasella, J., Alvalá, R. C. S., Sestini, M. F.,
Affonso, A. G., Rodriguez, D. A., Barbosa, A. A., Cunha, A. P. M. A., Valles, G. F., Crepani, E., De Oliveira, S. B. P., De Souza, M. S. B., Calil, P. M., De Carvalho, M. A., Valeriano, D. M., Campello, F. C. B., and Santana, M. O.: Identifying areas sus-ceptible to desertification in the Brazilian northeast, Solid Earth, 6, 347–360, doi:10.5194/se-6-347-2015, 2015.
Xie, L. W., Zhong, J., Chen, F. F., Cao, F. X., Li, J. J., and Wu, L. C.; Evaluation of soil fertility in the succession of karst rocky desertification using principal component analysis, Solid Earth, 6, 515–524, doi:10.5194/se-6-515-2015, 2015.