The Use of Fundamental Color Stimulus to Improve the
Performance of Artificial Neural Network Color Match
Prediction Systems
Ameri, Farhadand Moradian, Siamak*+
Department of Polymer and Color Engineering, Amirkabir University of Technology, I.R. IRAN
Amani Tehran, Mohammad
Department of Textile Engineering, Amirkabir University of Technology, I.R. IRAN
Faez, Karim
Department of Electrical and Electronic Engineering, Amirkabir University of Technology, I.R. IRAN
ABSTRACT: In the present investigation attempts were made for the first time to use the fundamental color stimulus as the input for a fixed optimized neural network match prediction system. Four sets of data having different origins (i.e. different substrate, different colorant sets and different dyeing procedures) were used to train and test the performance of the network. The results showed that the use of fundamental color stimulus greatly reduces the errors as depicted by the MSE and ∆ Cave data and improves the performance of the neural network prediction system. Additionally the use of fundamental color stimulus makes provisions for predicting the concentrations of one data set whilst being trained by a second data set of completely different origin.
KEY WORDS: Color match prediction, Neural networks, Fundamental color stimulus, Matrix R.
INTRODUCTION
Conventional visual color match prediction procedures (using the eye/ brain combination) became obsolete in the twentieth century mainly because of their subjectivity. Therefore the early instrumental color match prediction counterparts were designed in order to assist the visual matcher, to do the same job more objectively. However these early instrumental systems did not find immediate and wide acceptance. The reason for this was
that they employed first generation devices for the color measurement, approximated models for the predictions and analogue computers for the calculations (COMIC being one of the first commercial systems) [1]. All the modern era color match prediction systems have become much more sophisticated. They use modern highly accurate abridged spectrophotometers for the color measurements. Additionally elaborate modifications of * To whom correspondence should be addressed.
+E-mail: moradian@ aut.ac.ir
the two or multi flux models for the prediction combined with high capacity, extremely fast digital computers for the necessary calculations have been made [2]. Insuch procedures the chosen model determines the exact relationship between the CIE specified color coordinates and the combinatorial concentration of known sets of colorants, and the selection of the colorant set is primarily determined by the optimization of the tolerable degree of metamerism, fastness properties and obviously the price.
In the start of the twenty first century however there has been tendencies to capitalize on the advantages of the eye/brain combination namely because it provides intelligence in addition to which, the eye/brain combi-nation is still the final judge. It seems that as a means to anend,arevisionof thought is taking place. Computerized instrumental color matchprediction of the next generation would be so designed that not only will it cumulatively combine the advantages of both the visual and the instrumental color match prediction techniques but that it would also provide objective decision making based on integrated super soft computed color matching network systems. This reversion of thought has not as yet been fully commer-ciallyrealized but would be achieved in the yearsto come.
Color match prediction based on artificial neural networks would have the following advantages:
-There is no requirement for the provision of a theory relating color to colorant concentration.
- There is no necessity to prepare a special data base for each colorant in order to use these techniques.
- The neural network approach may hopefully be able to learn the behavior of colorant systems where the mathematical descriptions are complex.
The neural networks shortcomings are as follows: - There is no guarantee that the neural network approach would provide a solution forthe color matching.
- Neural networks technique would require a sufficient number of training and test samples made from single and combinatorial colorations for each set of colorants and additionally for changing the substrate, the set of colorants and the dyeing procedure.
- The artificial neural network requires not only to be of a structurally optimized architectural design but also all the other variants (i.e. training algorithms, activation functions, etc.) must be of the right form.
- Different runs of the same neural network for the same data set would not provide the same predictions.
- The neural network cannot make one → many mappings.
- Time requirements for the predictions tend to be comparatively long.
Although the use of genetic and fuzzy logic algorithms have tended to reduce the disabilities and improve the capabilities of the neural networks but the shortcomings have by no means been completely eradicated [3-5].
Additionally there are some coloristic shortcomings inherent to the use of the neural network techniques, which are listed below:
i-There is a need for the preparation of a sufficiently large number of training samples to cover the color gamut and additionally in order to generalize the training of the optimized neural network.
ii-Each variation in the substrate and/or colorant set and/or coloration procedure would require its own training and test samples.
iii-By inputting reflectance into the neural network one would expect the output, i.e. the colorant concen-trations, to provide a spectral (i.e. non-metameric) match. However this is not the case since Wyszecki [6] hypothesized and Cohen and Kappauf [7] provided the means, that the measured reflectance data is composed of two components. A basic fundamental color stimulus component and a second metameric black component unique to each metamer and in every case having tristimulus values of zero.
Strictly speaking, the use of measured reflectance data would not be able to provide true spectrophotometric (non-metameric)matchesbecauseitcontainsthemetameric black component.
Based on this premise, that in order to produce true spectrophotometric matches the inputted reflectance function should be the fundamental color stimulus component, the present investigation was carried out in order to provide means by which to minimize some of the shortcomings of the artificial neural network techniques of color match predictions [8, 9].
Theoretical background
Table 1: Data sets preparations.
Variable Data set 1 Data set 2 Data set 3 Data set 4
Colorants
Terasil*(Yellow 6G, Red R, Blue BG, Blue GN, Violet BL, Brown
3R)
Lanaset* (Yellow 2R , Blue 2R Bordeaux B, Green B)
Lanaset* (Yellow 4GN , Blue 5G, Red 2B,Violet B,
Green B)
Terasil*(Yellow GWL, Red F B,
Blue 3RL)
Number of samples 383 107 183 142
Substrate Polyester Wool serge Wool serge Polyester
Dyeing method Thermosol Exhaustion Exhaustion High temperature
Type of
colorants Disperse
Reactive-metal complex 2:1
Reactive-metal
complex 2:1 Disperse
*) Ciba Specialty Chemicals
tristimulus values that these mentamers have in common and (b) a secondary distribution, unique to each metamer and in every case having tristimulus values of (0, 0, 0).
This second distribution or component necessarily involves negative values at some wavelengths along with positive values at others, and the net effect is that the distribution as a whole contributes nothing to the color specification or the perceived color.
Wyszecki saw the fundamental color stimulus function as a linear combination of color-mixture functions and therefore as lying within this color-stimulus space. He further noted that those functions that are metameric blacks must be in a space that is orthogonal to the space of the color-mixture functions.
Matrix R is based on the Wyszecki hypothesis and is an orthogonal projector matrix. Cohen and Kappauf [7] derived matrix R from a set of color matching functions, matrix A, as shown in equation (1):
Matrix R=A (A ′A) ¹ A′ (1)
Where A′ is the transposed of matrix A.
Theoretically, any set of color matching functions can be used. Any reflectance spectra (R) under any chosen observer-illuminant combination can be decomposed into two components, called fundamental color stimulus (RFCS) and metameric black (RMB) or residual stimulus using matrix R. If the matrix R is multiplied by the measured reflectance spectrum R, the fundamental color stimulus RFCS is obtained (i.e. RFCS= ((matrix R)×R) and the metameric black RMB is given by subtracting the
fundamentalcolorstimulus from the measured reflectance spectra i.e. RMB=R- RFCS .
EXPERIMENTAL
Sample preparation
Four different sets of data depicted in Table 1 were utilized in the present work. As can be seen from Table 1 the origins of the data are completely different.
The Texflash spectrophotometer from the Datacolor Company was used for the reflectance measurements of all samples. The measurements were carried out with the specular component included on four layers of folded fabric placed on the large sample port (i.e. 27 mm). The average of three measurements was used to obtain the reflectance data from which different color coordinates under different illuminant/observer combinations were calculated. In this way four sets of data (i.e. data set 1, data set 2, data set 3 and data set 4) were at hand, the origins of which were completely different and were made to create color centers covering as far as possible the gamut of available colors for the given set of colorants. These data could be utilized to test the effect of different substrates, different colorants and different method of dyeing on the predictions of artificial neural networks color match prediction systems.
Sample selection
color centers as data set 35-1 was selected from the entire data set 2, data set 3 and data set 4. Therefore, data set 35-1 and data set 35-234 formed 35 metameric close (but not exact) matches having parameric differences of less than 1.7 ∆ECIE1994 units under the reference conditions (i.e. illuminant D65 /CIE 1964 Supplementary Standard ColorimetricObserver).
Three hundred forty eight polyester samples being extractedfromdataset1dyed by thethermosolprocessand were used to train an optimized artificial neural network. Data set 35-1 was used to test the neural network. This would mean that if an artificial neural network trained by data set 1 (comprising of 383 polyester samples dyed by the thermosol process) correctly predicted the recipes (represented by small error factors i.e. mean square error, MSE and/or small ∆Cn=(│Cna-Cnp│/n). Where Cna and Cnp denote actual concentration of n colorants and predicted concentration of n colorants respectively. When this tested by the data set 35-1 (comprising of 35 polyester samples dyed by the same set of colorants and the same thermosol process), then most probably a well trained artificial neural network has been obtained. However if the same artificial neural network trained by the same data set, i.e. data set 1, could correctly predict the recipes (i.e. with low error factors as mentioned previously) whentested bythedataset35-234 (comprising of 35 samples of wool and polyester samples dyed with different colorants and different methods of dyeing). This would most probably be indicative ofa more intelligent artificialneural network insensitive to variables such as substrate, type of colorants and the dyeing process i.e. very much like the intelligent visual predictions. In order to test the above-mentioned premise,theinputfunctionof afixed genetically optimized neural network architecture was varied as is mentioned in the next section.
Neural network architecture
MATLAB 6.5 [12] was used as a tool for obtaining color recipes predicted on a fixed optimized 16×10×10×6 neural network architecture. The input layer consisted of the measured surface spectral reflectance (or one of its four transformations mentioned below) of the target color centers at 16 wavelengths of 20 nm intervals throughout the visible range of the spectrum between 400-700 nm. The output layer corresponded to the concentrations of the mentioned colorants. The network was trained using
the Scaled Conjugate Gradient Back Propagation algorithm [13]. A positive linear activation function was used in the output layer whilst the logsig function was used in the hidden layers. Training was made to continue over 100000 epochs. Each network was made to run three times and the network with the least MSE was selected for further analysis.
Neural networkinputs
Networks were trained separately as follows:
1-Trained with the untransformed original measured spectral reflectance i.e. R.
2-Trained with a transformation based on a weighted cube root coordinates [10]
{
}
{
}
{
}
[
2 2 2]
12CRC u L v L w L
R = ∑ × +∑ × +∑ ×
where
L =25(R )1/3-17 (2)
3-Trained with a transformation based on the Munsell value polynomial transformation [11]
RMVP = 1.2219×R-0.23111×R2+0.23951×R3
-
(3) 0.021009×R4+0.0008404×R54-Trained with an exponential transformation
REX=exp(R) (4)
5-Trained with the fundamental color stimulus transformation derived from previously mentioned matrix R (i.e. RFCS).
Error estimation
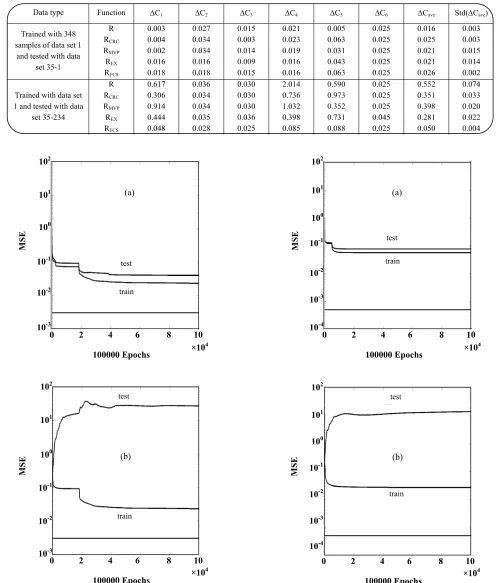
The five mentioned inputs produced five artificial neural networks trained by data set 1.These trained networks were first tested by selected samples of data set 35-1 and then subsequently tested by the second selected 35 samples of data set 35-234. The performance of the five input functions were expressed firstly as the MSE depicted in Figs. 1 to 5 and secondly as average absolute concentration difference between the actual and predicted concentration of individual colorants (i.e. ∆C1, ∆C2…
102 101 100 10-1 10-2 10-3 10-4 MS E 100000 Epochs
0 2 4 6 8 10 ×104 test
train
(b) Table 2: Colorant concentration error for various reflection functions.
Data type Function ∆C1 ∆C2 ∆C3 ∆C4 ∆C5 ∆C6 ∆Cave Std(∆Cave)
Trained with 348 samples of data set 1
and tested with data set 35-1 R RCRC RMVP REX RFCS 0.003 0.004 0.002 0.016 0.018 0.027 0.034 0.034 0.016 0.018 0.015 0.003 0.014 0.009 0.015 0.021 0.023 0.019 0.016 0.016 0.005 0.063 0.031 0.043 0.063 0.025 0.025 0.025 0.025 0.025 0.016 0.025 0.021 0.021 0.026 0.003 0.003 0.015 0.014 0.002
Trained with data set 1 and tested with data
set 35-234 R RCRC RMVP REX RFCS 0.617 0.306 0.914 0.444 0.048 0.036 0.034 0.034 0.035 0.028 0.030 0.030 0.030 0.036 0.025 2.014 0.736 1.032 0.398 0.085 0.590 0.973 0.352 0.731 0.088 0.025 0.025 0.025 0.045 0.025 0.552 0.351 0.398 0.281 0.050 0.074 0.033 0.020 0.022 0.004
Fig. 1: Train and test results for untransformed measured reflectance(R), a) for data set 35-1, b) for data set 35-234.
Fig. 2: Train and test results for RMVP, a) for data 35-1,
b) for data set 35-234.
102 101 100 10-1 10-2 10-3 MS E 100000 Epochs
0 2 4 6 8 10 ×104 test train (a) 102 101 100 10-1 10-2 10-3 MS E 100000 Epochs
0 2 4 6 8 10 ×104 test train (b) 102 101 100 10-1 10-2 10-3 10-4 MS E 100000 Epochs
0 2 4 6 8 10 ×104 test
train
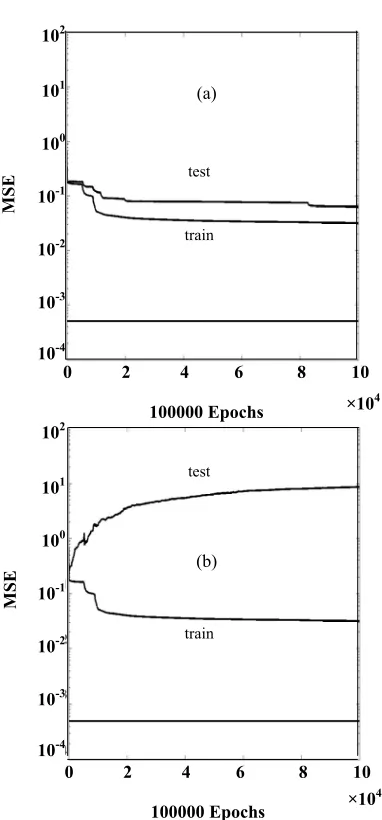
Fig. 3: Train and test results for RCRC, a) for data set 35-1,
b) for data set 35-234.
In the present work, the use of color differences has intentionally been avoided since color differences could give large errors as compared to visual assessments. In addition, to obtain color differences, the predicted recipes would have to first be dyed which would introduce further errors due to the repeatability of the dyeing procedure. Therefore, the performance of the network would be masked by these additional error sources. The use of MSE and concentration differences, most certainly, do not have these disadvantages and would only be indicative of the networks real performances.
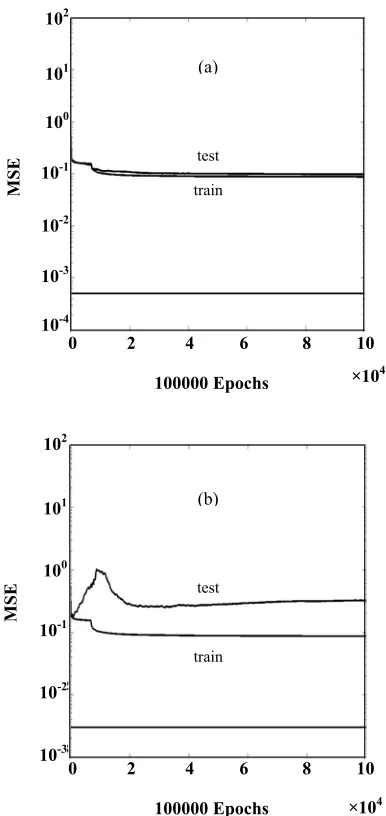
Fig. 4: Train and test results for REX, a) for data set 35-1,
b) for data set 35-234.
RESULTS AND DISSCUSSION
As can be seen from Figures 1 to 5, training with 348 samples of data set 1 and testing with data set 35-1, i.e. the data set of the same origin leads to small MSE for the training and test data. The MSE of the test data almost superimpose on the MSE of the train data being always a little bit higher than the training data irrespective of the input functions. This trend also holds good for concentrationdifferencesbetween the actual and predicted concentrationsasis illustratedinTable2.This is indicative of a well - trained artificial neural network giving
102
101
100
10-1
10-2
10-3
10-4
MS
E
100000 Epochs
0 2 4 6 8 10 ×104 test
train
(b)
102
101
100
10-1
10-2
10-3
10-4
MS
E
100000 Epochs
0 2 4 6 8 10 ×104 test
train
(b)
102
101
100
10-1
10-2
10-3
10-4
MS
E
100000 Epochs
0 2 4 6 8 10 ×104 test
train
(a)
102
101
100
10-1
10-2
10-3
10-4
MS
E
100000 Epochs
0 2 4 6 8 10 ×104 test
train
Fig. 5: Train and test results for RFCS, a) for data set 35-1,
b) for data set 35-234.
a maximum average concentration difference of 0.026 (i.e. default of the network's architecture) irrespective of the input function. However, the situationdramatically changes when the training is carried out by data set 1 and tested with data set 35-234, i.e. the data set of completely different origins. As can be seen from the right hand side graphs of Figs. 1 to 5, except for RFCS, the MSE of the test data for all the other input functions deviate (diverge) from the MSE of the training data; the deviation being maximum for the untransformed function R.
Similar previous work published elsewhere [8,9] determined the errors involved in such a neural networks
predictions by five statistical parameters namely CV%, γ [14], R2, E% [15] and performance factor (PF/4) [16]. Percentage errors depicted by the performance factor were reported to be up to 67 % for the input functions R, RCRC, RMVP and REX, showing very poor performance. On the other hand a PF/4 of less than a mere 10 percent (i.e. greater than 90 percent accurate predictions) for RFCS as the input function indicated excellent performance.
All the results favor the utilization of RFCS as the input function for artificial neural networks match the prediction systems as well as other prediction systems based on all models relating reflectance (color) to colorant concentrations.
This is for the simple reason that RFCS enhancesthe capability of such systems by increased generalization of the relationship (i.e. less variables hence more intelligence). How RFCS is able to increase the intelligence of prediction systems is the 64000 dollar question. It is obviously known that the reflectance data contains much more information than the tristimulus values.
However according to many workers [6,7] the reflectance data comprises of two different parts of data: One part giving the color stimulus component(i.e. part of the reflectance data required to calculate the tristimulus values) and the second part giving the corresponding metameric black component (i.e. part of the reflectance data required to calculate the degree of metamerism (RMB).
In early color match prediction systems, attempts were made to obtain spectral non-metameric matches but to no avail. The reason why the early and subsequent spectral match prediction systems were not successful is that the measured reflectance contains too much information (i.e. RFCS +RMB) giving rise to miscom-prehensions leading to erroneous miscalculations. The spectral match prediction procedures were soon set aside and tristimulus (metameric) match prediction systems became thenorm.
However, by the same line of reasoning the measured reflectance containsmorethan the necessary information required for a tristimulus match to be envisaged and again it would lead to erroneous miscalculations. Based on the same premise the artificial neural network prediction systems would also lead to similar erroneous miscalculations. In addition, to which, there is a further
102
101
100
10-1
10-2
10-3
MS
E
100000 Epochs
0 2 4 6 8 10
×104 test
train
(b)
102
101
100
10-1
10-2
10-3
10-4
MS
E
100000 Epochs
0 2 4 6 8 10 ×104 test
train
disadvantage of the artificial neural network not being able to make one→many mappings.
These disadvantages would no longer hold true for metameric samples since the metameric black component isextractedfromthemeasuredreflectance in the suggested RFCS transformation.
We truly believe that the only logical procedure out of such confusion is to split the measured reflectance into its components (i.e. RFCS and RMB). Utilizing RFCS as the input function for an artificial neural network or any other match prediction system would give outstanding performance as has been shown in the present paper because it produces a real spectral match making the changes in the substrate, set of colorants and dyeing procedures of secondary importance. This would mean vastly reduced number of training samples i.e. optimistically speaking, only one set of training samples covering the entire color gamut would suffice for all predictions irrespective of substrates, set of colorants and dyeing procedures. The predictions made by training with one set of data will hold good for all other sets of data. It would be hoped that the RFCS input function of this carefully prepared set of data might finally be used to optimize the artificial neural networks architecture itself giving optimized network performances, equal in intelligence to the visual system of match prediction, but with the added advantage of extreme objectivity.
CONCLUSIONS
The aim of the present investigation was to use a series of transformation of measured reflectance in order to enable an optimized artificial neural network system of color match prediction to predict the concentrations of a given set of colorants of one data set whilst the network was trained by a data set of a completely different origin. The preliminary results demonstrate that RFCS shows promise for the goals sough after. Should the trend hold true for other sets of data and the visual implications of the percentage errors in concentration differences be acceptable, then vast reduction of training samples can be visualized.
The idea could be extended into visualizing that substrates, sets of colorants and coloration procedures would have noorvastlyreduced effectson the predictions.
Received : 27th January 2005 ; Accepted : 25th April 2005
REFERENCES
[1] Davidson, H.R., Hemmendinger, H. and Landry, J. L. R., A system of instrumental color control for the textileindustry,J.Soc. Dyers Colour, 79, 577 (1963). [2] Alderson, J. V., Altherton, E. and Derbyshire, A. N., Modern physical techniques in colour formulation, J. Soc. Dyers Colour, 77, 657(1961).
[3] Mizutani, E., Takagi, H., Auslander, D. M. and Jang, J. R., Evolving color recipes, IEEE Transactions on Systems, Man and Cybernetics-Part c, 30, 537 (2000).
[4] Bezerra, C. M. and Hawkyard, C.J., Computer match prediction for florescent dyes by neural networks, J S D C, 116, 163(2000).
[5] Westland, S., Artificial neural networks and colour recipe prediction, in Proceedings of Colour Science 98, Leeds University, 3, 225(2001).
[6] Wyszecki, G., Valenzmetrische Untersuchung des Zusammenhanges zwischen normaler und anomaler Trichromasie, Die Farbe, 2, 39(1953).
[7] Cohen, J. B. and Kappauf, W. E., Metameric color stimuli, fundamental metamers and wyszecki's metameric blacks, Am. J. Psychol., 95, 537(1982). [8] Ameri, F., Moradian, S., Amani Tehran, M. and
Faez, K., The use of transformed reflection functions in artificialneural networkmatch prediction systems, presented at the Inter-Society Color Council (ISCC), Annual Meeting and Symposium, Gaithersburg, Maryland , U.S.A., May (2004).
[9] Ameri, F., Moradian, S., Amani Tehran, M. and Madgidi, N., The use of transformed functions of reflectance in the color match prediction of textiles, presented at the 4th AUTEX Conference, Roubaix, France, June (2004).
[10] Glasser, L. G., Mckinney, A. H. and Reilly, C. D., Cube root color coordinate system, J. Opt. Soc. Am., 48, 736(1958).
[11] Newhall, S. M., Nickerson, D. and Judd, D. B., Final report of the O.S.A. subcommittee on spacing of the munsell colors, J. Opt. Soc. Am., 33, 385(1943).
[12] Matlab, Version 6.5, Neural Networks Toolbox, The MathWorks Inc, (2002).
[14] Coates,E.,Fong,K.andRigg,B.,Uniform lightness
scales, J S D C, 97, 179(1981).
[15] Myers, R. H., Myers, S. L. and Walpole, R. E., "Probability and statistics for engineers and scientists", 6th edition: Prentice Hall International, U.S.A. (1998).