© Universiti Tun Hussein Onn Malaysia Publisher’s Office
IJIE
Journal homepage: http://penerbit.uthm.edu.my/ojs/index.php/ijie
The International
Journal of
Integrated
Engineering
ISSN : 2229-838X e-ISSN : 2600-7916
Analysis of Solid Waste Generation and Composition in
Malaysia TVET Campus
Rodzidah Mohd Rodzi
1,*, Zulkifli Mohd Nopiah
1, Noor Ezlin Ahmad Basri
21Centre of Engineering Education Research, Faculty of Engineering and Built Environment,
National University of Malaysia, 43600 Selangor, MALAYSIA
2Department of Civil and Structural Engineering, Faculty of Engineering and Built Environment,
National University of Malaysia, 43600 Selangor, MALAYSIA
*Corresponding Author
DOI: https://doi.org/10.30880/ijie.2019.11.01.017
Received 07 May 2018; Accepted 05 December 2019; Available online 15 May 2019
1.
Introduction
Malaysia has been experiencing rapid economic growth and urban transformation over the last decade. Municipal solid waste (MSW) is one of the 3 major environmental problems in Malaysia, apart from water and air pollution. The exponential growth of economic, urbanization, demographics and changing lifestyles are the key reasons behind the increase in the generation of MSW. Malaysia has targeted a recycling rate of 22.0% for commercial and industrial industries by 2020 as reported by Zaipul et al. [1]. It has been proven by other countries that the target is achievable, For example, England was able to recycle and reuse 52.8% of its commercial waste in 2009 [1]. According to SWCorp government of Malaysia, the total waste that is being generated keeps increasing. This was documented in 2005, to be 19,000 tons/day, 33,000 tons/day in 2012 and 38,200 tons/day in 2016. Based on the assumption factors of rapid population growth, the waste generation rate increased on average by 4% per year from 0.8 kg/cap/day to 1.12 kg/cap/day, while the recycling rate increased from 5.0% in 2005 to 17.5% in 2016 [2]. In the year 2015, the Malaysian Ministry of Urban Wellbeing, Housing and Local Government (KPKT) revealed two statistics:
• Malaysians produce an average of 49,670 tons of waste every day.
• Only 10.5 percent (10.5%) of this waste is recycled.
Abstract: Recycling, composting and the conversion of waste to energy go hand-in-hand in Malaysia, which striving for sustainable waste management. In order to assess what the best alternatives are, it is important to first understand the generation and composition of municipal solid waste (MSW). The objective of this study was to determine the generation rate and composition of MSW in Malaysia TVET campus. The survey was conducted at the Industrial Training Institute, Kuala Lumpur (ITI KL). In this study, the waste composition was categorized into 6 components, in reference to the 2014 World Bank Guidelines, namely organic/food, paper, plastic, glass, metal and others. The results from this study revealed that the rate of solid waste generation at the cafeteria was 0.141kg/capita/day (9,176.00kg per year) and 0.039kg/capita/day with an estimated 7,811.00kg per year at the dining hall. The highest composition for both sampling points was organic or food waste with cafeteria generating 82.87% (20.84kg/day) and dining hall 92.53% (19.80kg/day). This study recommends three effective practices that are suitable for improving commercial solid waste management at TVET campus in Malaysia, which are composting of food waste, giving a reward/merit/penalty as enforcement and providing adequate systematically segregated recycle bins.
Keywords: Composition, generation rate, Malaysia, municipal solid waste, TVET institutions
These two statistics indicate that the buildup of solid waste in the country is going to result in a tremendous increase in environmental pollution, health problems for communities and bottlenecks to economic growth. On the whole, the problem of poor waste management in Malaysia is one of the nation’s biggest issues to date. The increasing amount of solid waste is one of the most daunting challenges to regulatory authorities in maintaining clean cities [3-4]. Research study reported on Malaysia solid waste has been managed traditionally over 30 years by burying it in landfills and started from 2007. Detailed of the Malaysian government has been trying to curb the flow of garbage onto sidewalks, into landfills, over hillsides and through rivers, but Malaysia’s turbulent pace of change has made that process extremely difficult are available in literature [5]. Over period of 10 years from 2003 to 2013, the generation of MSW in Malaysia increased by more than 91.0%. Apart from that, the factors experimental of the increasing population, consumption and disposal rates are escalating faster than the utilities in Malaysia can handle also available [6]. Numerical investigations proved that urban development is largely responsible, with the country’s city dwellers (at 65.0% of the total population) being the biggest contributors to waste. This, combined with a metropolitan shopping culture and poor public understanding of resource conservation and recycling, accelerating Malaysia with quite a bit of garbage to deal with. As a result, most of the MSW is going into landfills. In 2017, about 26.5% of all MSW in Malaysia was incinerated, while 17.5% was recycled, leaving the remaining 56.0% to be dumped [7].
A good understanding of waste generation and composition is important for sound decision making that will lead to efficient solid waste management. The success of waste management requires accurate data on the generation and composition of waste which are pivotal for decisions with regard to an appropriate waste management system as reported in Thenmozhi et al. [8]. Data have been reported that an analysis of solid waste generation and composition is a critical first step towards developing a successful and effective plan for waste management services and strategies by several researchers [9]-[11]. Hence, for integrated solid waste planning, it is indispensable to indicate the generation of solid waste from the communities and its composition. A solid waste management system (SWMS) needs to be updated to suit the quality, quantity and composition of the waste. Special attention should be paid to the updated composition of the waste which differs according to their source as researched by Shadi et al. [11]. The lack of systematically updated data available on the composition of MSW suggests that there is a need to research and to document waste characterization in order to propose better handling and management alternatives for the generated MSW. Thus, this study was conducted with the intention of providing baseline data for improving the solid waste management system.
2.
Objective
Characterizing and analyzing the composition of generated solid waste is one of the critical first steps towards developing successful and effective strategies for reducing solid waste disposal. Therefore, the objective of the study was to determine the waste generation and composition of municipal solid waste at the ITI KL campus eateries.
3.
Methodology
3.1
Study Location
The study was conducted at a public vocational institute, namely the Industrial Training Institute, Kuala Lumpur (ITI KL). It is a Technical and Vocational Education and Training (TVET) Institution that is fully operated by the government under the Ministry of Human Resources Malaysia (MOHR). The ITI KL was established in 1964 on a 13.7 acre land located at coordinates 3°05'33.1"N and 101°41'13.5"E as shown in Fig. 1.
Currently, in 2018, the total staff population is 179 while the student population is 546. It has over 30 blocks of buildings with the capacity to accommodate 204 employees and 1100 students [12]. The area was selected since the ITI KL is situated in the town of Kuchai Lama, one of the old towns in Malaysia. Kuchai Lama is in the Seputeh district constituency in south-western Kuala Lumpur, Malaysia, located 8 km away from Kuala Lumpur City Centre (KLCC) [13]. As of 2011, DOSM reported that Kuchai Lama had an estimated population of 315,943 and an area of 16.25 km2 (6.18 sq. mi) [14].
3.2
Tables
The TVET institute is well equipped with training and campus facilities such as a guardhouse, main hall, auditorium (capacity for 400 people), mosque, cafeteria, two-level dining hall, student hostels, staff quarters, kiosk and library. There are also fields and courts for sports activities including soccer, netball, volleyball, futsal, tennis, ‘sepak takraw’ and badminton. The sampling and characterization were conducted on solid waste taken from 2 different dumpsite points in the area of the ITI KL. The selected sites were the cafeteria and dining hall. Both these sites were chosen based on their strategic locations near the staff building and student hostels. The cafeteria dumpsite as illustrated in Fig. 2 is located beside the auditorium building and next to the administration office.
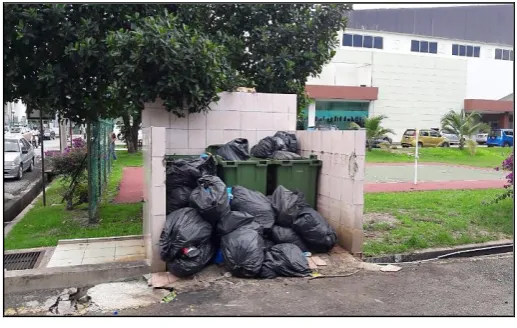
Fig. 2 - ITI KL cafeteria dumpsite
The cafeteria operates from 7:30 a.m. to 6.00 p.m., Monday to Friday. The café has a buffet-style approach where customers serve food onto their own plates and then pay at the end of the meal. It is open to the public where all the staff, students, contractors, visitors and members of the public can dine. They serve food and beverages for breakfast, lunch, tea break and provide a variety of snacks. A few servers are present at the beginning and end of the mealtimes to set up and then clear the tables. The servers dispose all the leftover food and trash into garbage bins. The café does not practice waste segregation or resource recovery.
Fig. 3 depicts the dining hall dumpsite. The dining hall of the ITI KL is a two-storey building which has a capacity for 300 students. It is located near the staff quarters and lies between the student hostels and the mosque. It operates from 7.00 a.m. to 8.00 p.m. every day except during the semester break. The dining hall on the campus managed by a contracted caterer appointed by the government. Meals are served 3 times a day in the dining hall only for students who are staying at the hostel. The mealtimes for breakfast, lunch and dinner are arranged by the warden in consultation with a committee. Since the food is prepared in bulk, no student is entitled to a special diet. The wardens supervise the serving and ensure that dining etiquette is followed. Students must bus their own table and ensure that the dining area is cleaned after each use. Students are required to gather the leftover food into waste bins and return their trays, dishes and utensils to the tray bussing window for cleaning. Fig. 4 illustrates the map of the 2 sampling point locations specifically, ITI KL café and dining hall. Both disposal sites were not practicing waste segregation. In addition, the waste recycling enforcement was at a minimal level.
Fig. 4 - Map of the sampling sites
3.3
Sampling and Characterization
The samples were taken from two different disposal site points. They were the ITI KL cafeteria and the campus dining hall. These dumpsites were selected because of their accessibility and the higher probability of students throwing municipal organic and inorganic waste into them. The collection and sorting out methods were conducted according to the 2014 World Bank Standard Guidelines for the Composition of Solid Waste [15].
The study on solid waste generation and composition at two different eateries in ITI KL consisted of three main stages: 1) weighing the waste, 2) recording the data, and 3) analyzing the data. The data sampling for each disposal site was conducted for 10 consecutive days, excluding Saturday and Sunday. The data were obtained by direct weighing of the solid waste generated throughout the day from both sites. The owners of the eateries separated the solid waste into 2 categories, particularly, wet waste (organic) and dry waste (inorganic). The wet waste composition comprised food waste while the dry waste included plastic, paper, cans and other materials. Goggles, gloves, rubber shoes and face masks were used for protection purposes during the sorting out process.
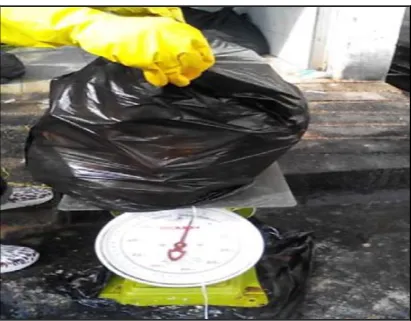
The total weight of the waste composition was determined by weighing the entire garbage using a 50 kg scale with a sensitivity of 0.1 kg as shown in Fig. 5. In order to have a precise reading, the samples were weighed 3 times and the average value was taken. Then, the inorganic waste was sorted and segregated accordingly into categories. For sampling purposes, the collected waste was segregated into 6 categories as listed in the World Bank Guidelines. The sorted samples were labelled as organic waste, paper, plastic, glass, metal and others. All the sorted waste from every category was weighed and the data were recorded in the standard form for analysis.
Fig. 5 - The weighing process
3.4
Waste Analysis
Windows version 19.0 spreadsheet. The statistical data on the quantification of the waste were by weight. The normality of the data collected was done by using a one-sample Kolmogorov-Smirnov test. A one-sample T-test was then performed to determine the evidence of statistical difference between the means of the two locations. The total weight of MSW generated at each disposal site was calculated by mathematically using Eq. (1) as follows:
(
))
0T MSW = w+Iw (1)
where, T(MSW) = Generated waste (kg), Ow = Organic wet waste (kg), Iw = Inorganic dry waste (kg). For statistical accuracy, the sample weighing procedure was repeated three times and an average value was taken using Eq. (2) as below: 1 1 n i i x x n =
=
(2)where, Σ = sum of, x= average weight of sample (kg), xi = weight of sample at each weighing (kg), n = number of
samples weight taken (kg), i = start adding with the first number (1, 2, 3…).
The weights of the waste compositions were recorded on the classification spreadsheet and illustrated in terms of percentages (see Eq. (3)). On the basis of the physical composition, the samples were segregated into 6 physical categories. The percentage composition of each waste category was calculated as follows:
(
)
Percentage Composition 100%
)
x T MSW
= (3)
where, T(MSW) = total weight of generated waste (kg), x = weight of each category (kg).
The per capita MSW generation rate was an estimation of the amount of waste created by the residents at ITI KL over a period of 10 days. The rate of waste generation (rw) was obtained by measuring the total weight of MSW (kg) collected for 10 days, and then using Eq. (4), the total weight T(MSW) was divided by the number of days and number of residents to obtain the rate per day per capita (kg/capita/day).
(
)
( )
w T MSW r d c = (4)where, T(MSW) = total waste generated (kg), rw = rate of waste generation (kg/capita/day), d = number of days (10
days), c = number of persons (179 staffs, 546 students)
The Kolmogorov-Smirnov 1-sample goodness-of-fit test was used to check the normality assumption in the analysis of variance. The empirical distribution function Fn for n observations of xi was defined by Eq. (5) as follows
( )
[ , ]( )
1
1 n
n x i
i
F x I X
n = −
=
(5)where, I[-∞,x](Xi) is the indicator function, which is equal to 1 if Xi ≤ x and equal to 0 of it is otherwise.
4.
Results
4.1
ITI KL Cafeteria
The data of solid waste samples collected from the ITI KL cafeteria dumpsite were segregated into 6 categories according to the 2014 World Bank Standard Guidelines. Table 1 presents the results of the total solid waste generated at the ITI KL cafeteria for 10 consecutive days excluding Saturday and Sunday.
A grand total amount of 251.44 kg of solid waste was generated over 10 days. The organic or food waste was 208.37 kg while paper waste amounted to 9.08 kg. This was followed by the generation of plastic, glass, metal and other waste at 16.22 kg, 3.42 kg, 10.73 kg and 3.62 kg respectively. From the table, the highest amount of generated waste was organic waste (208.37 kg) and the lowest was glass waste (3.42 kg). Based on Table 1, day 4 recorded the highest generation of solid waste (31.88 kg), while day 8 recorded the lowest generation of solid waste at 21.40 kg.
approximately 208.37 kg was produced with a mean of 20.84 kg/day and a standard deviation of 2.15. The lowest amount generated was glass waste (3.42 kg, mean = 0.34 kg/day, standard deviation = 0.08).
Table 1 - Generation of MSW at ITI KL cafeteria
Day Waste Generated (kg)
Daily Total Organic/Food Paper Plastic Glass Metal Others
1 25.71 21.14 0.95 1.70 0.36 1.22 0.34
2 23.34 19.65 0.86 1.68 0.24 0.61 0.30
3 27.84 22.28 1.02 1.84 0.48 1.76 0.46
4 31.88 25.70 1.18 2.13 0.40 1.89 0.58
5 26.18 21.97 0.94 1.61 0.34 0.93 0.39
6 22.68 19.01 0.80 1.50 0.31 0.71 0.35
7 23.14 19.32 0.83 1.62 0.32 0.78 0.27
8 21.40 18.51 0.77 1.03 0.23 0.58 0.28
9 23.20 19.45 0.82 1.52 0.32 0.86 0.23
10 26.07 21.34 0.91 1.59 0.42 1.39 0.42
GT 251.44 208.37 9.08 16.22 3.42 10.73 3.62
Table 2 - Statistical analysis of ITI KL cafeteria waste
Parameters Waste Composition (kg)
Daily Total Organic/Food Paper Plastic Glass Metal Others
Sum 251.44 208.37 9.08 16.22 3.42 10.73 3.62
Mean 25.14 20.84 0.91 1.62 0.34 1.07 0.36
SD 1.51 2.15 0.12 0.28 0.08 0.47 0.10
Variance 2.29 4.64 0.02 0.08 0.01 0.22 0.01
Minimum 22.59 18.51 0.77 1.03 0.23 0.58 0.23
Maximum 28.10 25.70 1.18 2.13 0.48 1.89 0.58
Percentage % 100.00 82.87 3.61 6.45 1.36 4.27 1.44
4.2
ITI KL Dining Hall
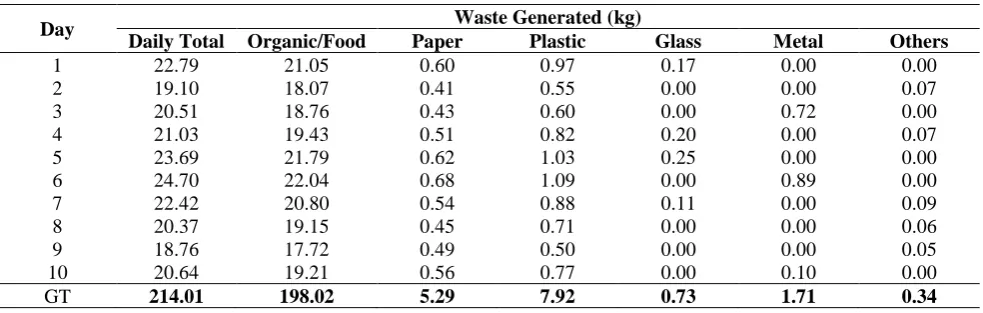
The results of the generated solid waste collected at the ITI KL dining hall are presented in Table 3. The generated solid waste collected over a period of 10 days totaled 214.01 kg. The highest waste amount of 24.74 kg was recorded on day 6, while the lowest amount of 18.76 kg was recorded on day 9. Organic waste, with a weight of 198.02 kg, comprised the highest amount of food waste generated, followed by plastic (7.92k g), paper (5.29 kg) and metal (1.71 kg). Meanwhile, the lowest amount of generated waste comprised glass waste (0.73 kg) and others (0.34 kg).
Table 3 - Generation of MSW at ITI KL dining hall
Day Waste Generated (kg)
Daily Total Organic/Food Paper Plastic Glass Metal Others
1 22.79 21.05 0.60 0.97 0.17 0.00 0.00
2 19.10 18.07 0.41 0.55 0.00 0.00 0.07
3 20.51 18.76 0.43 0.60 0.00 0.72 0.00
4 21.03 19.43 0.51 0.82 0.20 0.00 0.07
5 23.69 21.79 0.62 1.03 0.25 0.00 0.00
6 24.70 22.04 0.68 1.09 0.00 0.89 0.00
7 22.42 20.80 0.54 0.88 0.11 0.00 0.09
8 20.37 19.15 0.45 0.71 0.00 0.00 0.06
9 18.76 17.72 0.49 0.50 0.00 0.00 0.05
10 20.64 19.21 0.56 0.77 0.00 0.10 0.00
GT 214.01 198.02 5.29 7.92 0.73 1.71 0.34
Table 4 Statistical analysis of ITI KL dining hall waste
Parameters Waste Composition (kg)
Daily Total Organic/Food Paper Plastic Glass Metal Others
Sum 214.01 198.02 5.29 7.92 0.73 1.71 0.34
Mean 21.40 19.80 0.53 0.79 0.07 0.17 0.03
SD 2.18 1.52 0.09 0.20 0.10 0.34 0.04
Variance 4.76 2.32 0.01 0.04 0.01 0.11 0.00
Minimum 19.05 17.72 0.41 0.50 0.00 0.00 0.00
Maximum 24.74 22.04 0.68 1.09 0.25 0.89 0.09
Percentage % 100.00 92.53 2.47 3.70 0.34 0.80 0.16
4.3
MSW Generation
At the time of this study, the population of ITI KL was 725 people made up of 179 staff members and 546 students. The waste generation trend over 10 consecutive days at the ITI KL cafeteria dumpsite point is illustrated in
Fig. 6 (purple bar chart). The overall waste generated amounted to approximately 251.44 kg, with an average of 25.14 kg per day. Using Eq. (4), the result showed that the per capita rate of waste generation (rw) in the ITI KL cafeteria was 0.141 kg/capita/day with an estimated waste generation of 9,176.00 kg per year.
Fig. 6 - MSW generation trend at ITI KL cafeteria
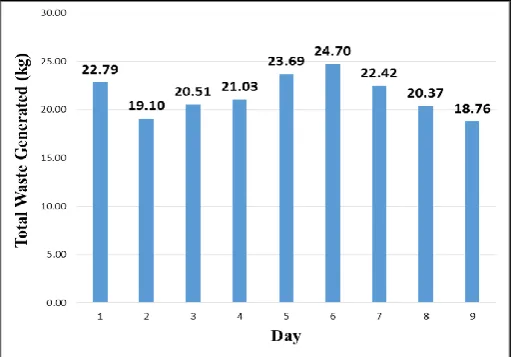
Meanwhile, the total waste generated at the ITI KL dining hall for 10 days was 214.01 kg, with an average of 21.40 kg per day. The per capita waste generation rate was rw = 0.043 kg/capita/day with an estimated waste generation of 7,811.00 kg per year (assumption of 90% of students). Fig. 7 displays the waste generation trend at the ITI KL dining hall sampling site.
4.4
MSW Composition
The percentage composition of the solid waste in the ITI KL cafeteria is illustrated the by the fraction pie chart in
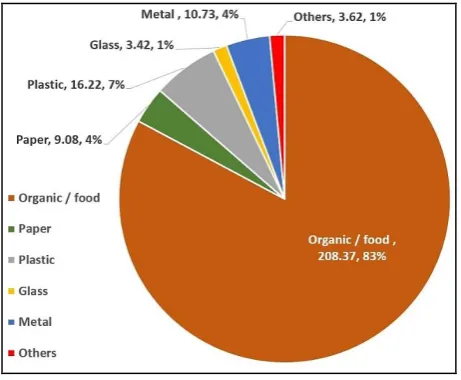
Fig. 8. The waste composition in the ITI KL cafeteria was comprised of approximately 82.87% of organic waste (food), followed by constituents of plastic, metal, paper, others and glass with percentages of 6.45%, 4.27%, 3.61%, 1.44% and 1.36% respectively.
Fig. 8 - Composition of MSW at ITI KL cafeteria
As for the ITI KL dining hall, Fig. 9 shows the composition of the solid waste generated. The biggest constituent was organic or food waste at 92.53% followed by plastic at 3.71%, paper at 2.47%, metal at 0.80%, glass at 0.34% and other waste at 0.16%.
Fig. 9 - Composition of MSW at ITI KL dining hall
4.5
Statistical Analysis
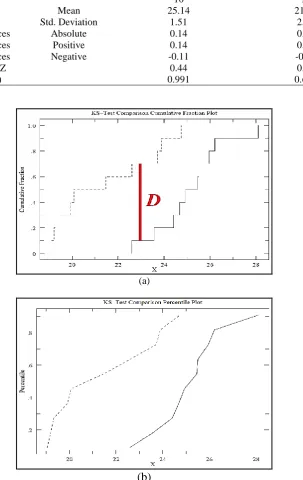
A Kolmogorov-Smirnov test (KS test) was carried out to measure the goodness-of-fit or normality of the recorded data distribution. Large significant values (>0.05) will indicate that the observed distribution corresponded to the theoretical distribution. The KS test results (see Table 5 and Fig. 10) showed that the data from both the sampling sites were normal. The p values for the ITI KL cafeteria and dining hall were p = 0.991 and p = 0.678 respectively where p > 005.
Fig. 10(a) and Fig. 10(b) show the KS comparison of the two data sets. The maximum difference between the cumulative distributions was D:0.7000 corresponding to p:0.007. It was found from the KS-test that the data for both locations were consistent with a normal distribution.
below, there was a significant difference between the two locations as p = 0.00 two-tailed at a significance level of α = 0.05. The mean total solid waste generated at the ITI KL cafeteria was 25.14 kg (refer to Table 2) and 21.40 kg at the dining hall (Table 4).
Table 5 - One-Sample Kolmogorov-Smirnov Test
Statistics K-S test ITI KL cafeteria ITI KL dining hall
N 10 10
Normal Parameters Mean 25.14 21.40
Normal Parameters Std. Deviation 1.51 2.18
Most Extreme Differences Absolute 0.14 0.23
Most Extreme Differences Positive 0.14 0.23
Most Extreme Differences Negative -0.11 -0.16
Kolmogorov-Smirnov Z 0.44 0.72
Asymp. Sig. (2 tailed) 0.991 0.678
(a)
(b)
Fig. 10 - (a) KS-test cumulative fraction, (b) KS-test percentile plot
Table 6 - One-sample test
Test Value = 1.000000 Statistics
t df Sig. (2-tailed) Mean
Difference
95% Confidence Interval of the Difference
Lower Upper
ITI KL cafeteria 50.48 9 0.000 24.14 23.06 25.23
Fig. 11 demonstrates the histogram (frequency distribution) of the total waste generation at the ITI KL cafeteria (Fig. 11 (a)) and dining hall (Fig. 11(b)). The histogram of the waste generation at the café shows a symmetrical data set with an edge peak distribution, while the pattern of the dining hall histogram was that of a bell-shaped curve with a normal distribution.
(a) (b)
Fig. 11 - Frequency distribution of waste generated (kg) at (a) ITI KL cafeteria, (b) ITI KL dining hall
5.
Discussion
5.1
MSW Generation Trend
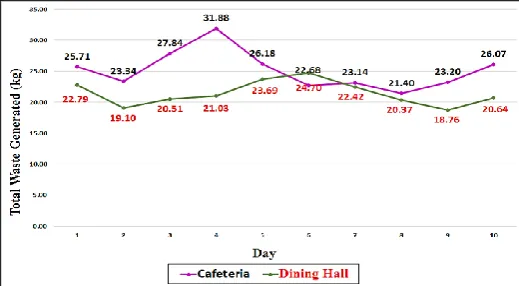
The findings of this study revealed the generation and composition of MSW from two dumpsites, the ITI KL cafeteria and campus dining hall. The dominant composition of the waste was compostable organic or food waste comprised of fresh vegetables, fruit scraps and peelings (café - 82.87%, dining hall - 92.53%). The line chart in Fig. 12
displays the time series quantitative data of the MSW generation between the two dumpsites sampling points for 10 consecutive days, excluding Saturday and Sunday. Based on the waste generation trends, the café (251.44 kg) produced greater total amount of waste everyday than the dining hall, except on day 6 (214.01 kg).
Fig. 12 - MSW Generation in ITI KL cafeteria and dining hall for 10 consecutive days
Using mathematical Eq. (4), the per capita rate of waste generation (rw) in the ITI KL cafeteria was calculated to be
0.12 kg/capita/day (9,176.00 kg per year), whereas the per capita rate of waste generation in the dining hall was rw = 0.043 kg/capita/day estimated at 7,811.00 kg per year. The cafeteria was responsible for providing full-service
However, referring to the line chart in Fig. 12, at the campus dining hall, there were 4 days when high waste generation was recorded, namely day 1 (Monday), day 5 (Friday), day 6 (Monday) and day 10 (Friday). The reason for this was that according to the class attendance records, the number of student absentees tends to increase slightly on Mondays and Fridays. Other reasons are that some students bring their own food containers for taking to-go-food, some are unable to return to the hostel after the weekend, skip meals and bring in food from the outside
5.2
MSW Composition Fraction
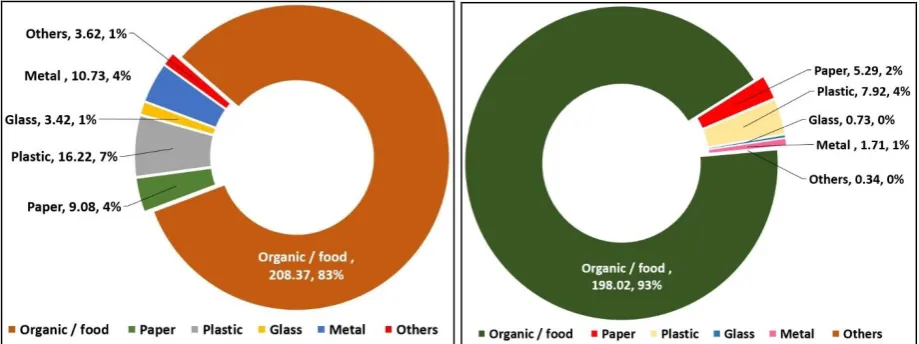
The overall results on the composition of the food waste from two different sampling points are summarized in
Fig. 13. The doughnut charts illustrate the percentages for the 6 classifications comprised of organic/food, paper, plastic, glass, metal waste and others. The organic/food fraction of the solid waste obviously was the dominant constituent of the generated solid waste (café – 83%, dining hall – 93%).
Fig. 13 - MSW Composition for 10 consecutive days (a)ITI KL cafeteria; (b) ITI KL dining hall
Composition of the waste from the ITI KL cafeteria, the highest amount comprised organic/food waste (83%) and the lowest amount was glass waste (1.36%). Besides serving food, the cafeteria also provides catering services for meetings and events. The types of events catered for by the café are business meetings, trainings, dinners, employee meals, social events, banquets and others. They provide buffet-style service and food packaging. The serving ware and tableware include a variety of plates/saucers (glass, plastic, paper), bowls (glass, plastic), drinkware (glass, paper, plastic), utensils/flatware (metal, plastic), drinking straws and tissue paper. Meanwhile, the food packaging ware consists of food containers (plastic), drink containers (plastic bottles, aluminium cans, boxes, paper cups, plastic straws), wrappers (paper, plastic), bags (HDPE/LLDPE plastic, paper), plastic utensils, and tissue paper.
Likewise, the highest constituent of the waste recorded in the ITI KL dining hall was organic/food waste (93%) and the lowest was other waste (0.16%). The residential students are provided with 3 meals a day (breakfast, lunch and dinner) in the campus dining hall every day of the week during a semester. Meal services are not provided during the semester break. In the dining hall, food is served in metal trays and plastic cups. When the meals are served, no utensils/flatware or tissue paper are provided. Nevertheless, bar soap is provided for hand washing at the sinks.
5.3
Current Campus Waste Management
Currently, solid waste management in ITI KL is basically controlled and managed by the Maintenance and Asset Management Unit, ITI KL. Two different contractors have been appointed to manage the cafeteria and dining hall. The licenses for these contractors are registered with the vendor database of the Federal Government. The frequency of the bulky waste collection services in the Kuchai Lama area is twice a week on days 1 and 4 (Monday and Thursday), scheduled from 9:00am – 10.30am, by Alam Flora Sdn Bhd (WPKL-15). Alam Flora which was incorporated in 1995, is one of the leading environmental management companies in Malaysia dedicated to serving communities to manage and reduce waste with minimal environmental impact. The collection services cover the regions of Kuala Lumpur, Putrajaya and Pahang. It is a wholly-owned subsidiary of DRB-Hicom Berhad, one of Malaysia’s leading companies listed on the main market of Bursa Malaysia Securities Berhad [16].
detergents, soap, aerosol bottles, grass trimmers and others. At present, the two sampling points do not practice the segregation of waste into recycle bins. All the waste is gathered in garbage plastic bags and disposed of directly into green dumpsters. No recycle bins are provided at the dumpsites. The substantial quantity of food waste that is dumped at these collection spots gets mixed with all other kinds of dry and wet waste. Consequently, resulting in a polluted landscape, (eyesore) with lots of dirt and bad smells (pungent). The nearest waste disposal segregation recycle bins are located at the Management building which is not easily accessible to students. This situation might deter their intention to practice waste segregation and recycling awareness.
6.
Summary
An analysis of the generation and composition of waste at the ITI KL eateries revealed that the MSW generation rate (rw) in the ITI KL cafeteria was 0.141 kg/capita/day (9,176.00kg per year) and rw = 0.039 kg/capita/day in the
dining hall, estimated at 7,811.00kg per year. This study provided an estimation of the solid waste generation and also an understanding of the habits and behavior of the residents with regard to the management of solid waste. The data analysis of the generation and composition of waste will facilitate in the making of projections of total waste generated trends and the residents’ habit patterns with regard to the dedicated eateries.
This paper highly recommends that food waste composting be conducted at both locations since food waste comprised the highest composition of the waste collected. Food waste (organic) has the potential for recovery to produce fertilizers. At the same time, as extra activities for the staff and students, the fertilizer can be used for planting and to reduce cost. The current practice of using waste segregation recycle bins does not seem to be well-planned due to the lack of quantity at the eateries and hostels. Recycle bins should be adequately provided and appropriately located at accessible areas to facilitate and encourage students to utilize the recycle bins.
Among the factors causing the disorganized situation are a lack of knowledge and awareness. Therefore, it is recommended that the TVET institute provide encouragement and enforcement to the employees, contractors and students such as a reward, penalty, merit/demerit system, campaigns and signages with the purpose of minimizing waste and also to improve recycling efforts. A well-organized solid waste management system will have a direct impact on the quality of life. Furthermore, to improve the lives of the campus residents through a ‘greener’, safer, fresher and environmentally sustainable living conditions
Acknowledgement
This research was supported by the Centre of Engineering Education Research (PeKA), Faculty of Engineering and Built Environment (FKAB), National University of Malaysia (UKM). Our sincere gratitude goes to the Department of Civil & Structural Engineering FKAB UKM for providing the research grant DCP-2017-006/3. The authors thank the National Solid Waste Management Department, Ministry of Housing and Local Government (JPSPN) for assisting in MSW information. Finally, our exclusive acknowledgment goes, in particular, to the invaluable support received from the public vocational TVET, Industrial Training Institute, Kuala Lumpur (ITI KL), where this research was implemented.
References
[1] Zaipul Anwar Z., and Ahmad Rahman S. (2017). Policies, challenges and strategies for municipal solid waste management in Malaysia. Journal of Science, Technology and Innovation Policy, 3, 18-22.
[2] Yiing Chiee M., and Latifah A. M. (2017). Solid waste management transformation and future challenges of source separation and recycling practice in Malaysia. Resources, Conservation and Recycling, 116, 1-14.
[3] Laws of Malaysia Act 672 (2007). Solid waste and public cleansing management act. Malaysian Attorney General’s Chamber, pp 71-77.
[4] National Solid Waste Management Department (2016). Solid waste management lab. Retrieved on June 12, 2015 from http://www.kpkt.gov.my/resources
[5] Budhiarta I., Siwar C., and Basri H. (2012). Current status of municipal solid waste generation in Malaysia. International Journal on Advanced Science, Engineering and Information Technology, 2, 129-134.
[6] Chua K. H., Sahid E. J. M., and Leong Y. P. (2011), Sustainable municipal solid waste management and GHG abatement in Malaysia. The 15th International Conference on ISO and TQM, 4, 1-8.
[7] Faridah Z., Zulkifli M. N., Noor Ezlin A. B., Cheng Jack K., and Siti Sarah J. (2017). Multilinear regression analysis on solid waste generation quantity in Malaysia towards sustainable development. International Journal of Advanced and Applied Sciences, 4, 46-52.
[8] Thenmozhi M. P., and Hameed S. (2014). Generation and composition of municipal solid waste (MSW) in Muscat, Sultanate of Oman. The 5th International Conference on Environmental Science and Development, Procedia, 10, 96-102.
[10] Seongwon S., Toshiya A., Yongwoo H., and Keisuke H. (2004). Environmental impact of solid waste treatment method in Korea. Journal of Environmental Engineering, 130, 81-89.
[11] Shadi Kafi. M., Mohd Bakri I., and Ahmad Fariz M. (2014). Waste minimization benefits and obstacles for solid industrial wastes in Malaysia. Journal of Environmental Science, Toxicology and Food Technology, 8, 43-52. [12] Industrial Training Institute (2018). ITI KL institute profile and accommodation. Retrieved on April 6, 2018 from
https://www.ilpkl.gov.my/2015/index.php/profile/pengenalan-institut.html
[13] Wikipedia (2018). Kuchai Lama Seputeh Kuala Lumpur, Malaysia. Retrieved on June 29, 2018 from https://en.wikipedia.org/wiki/Kuchai_Lama
[14] Department of Statistics Malaysia (2018). Taburan penduduk mengikut kawasan pihak berkuasa tempatan dan mukim e-CENCUS, Jabatan Perangkaan Malaysia. Retrieved on February 18, 2018 from https://www.mycensus.gov.my/banci/www/index.php
[15] Silpa K., Lisa Y., Perinaz B., and Frank Van W. (2018). What a waste 2.0: A global snapshot of solid waste management to 2050. Washington: The World Bank, pp 87-99.