[Seminar* et al., 4(11): November, 2017]
ISSN: 234-5197
Impact Factor: 2.715
I
NTERNATIONAL
J
OURNAL
OF
R
ESEARCH
S
CIENCE
&
M
ANAGEMENT
PROTOTYPE DEVELOPMENT OF A TRACEABILITY SYSTEM FOR COCONUT
PALM SUGAR SUPPLY CHAIN IN INDONESIA
Elgy Muhammad Rizqya1, Kudang Boro Seminar2*, Agus Buono3
1School of Business, Bogor Agricultural University (IPB)
Bogor, West Java, Indonesia, 16151
2Department of Mechanical and Biosystem Engineering, Bogor Agricultural University, Darmaga Campus, West Java, Indonesia, 16002
3Department of Computer Science, Bogor Agriculture University,
Darmaga Campus, West Java, Indonesia, 16680
DOI: 10.5281/zenodo.1066701
Keywords
:
coconut palm sugar, information technology, RFID, traceabilityAbstract
Implementation of international regulations on food traceability encourages companies to adapt to the established rules. Consumers are also considered to have the rights to receive safe products with quality as promised. Traceability system is one of the tools to guarantee the quality and safety of a product. The development of technology and information systems become one of the factors that support the development of traceability system, but there are still many companies that have not realized the importance of information and technology for the development and still utilizes paper-based traceability system. The purpose of this research is to design a traceability system using System Development Life Cycle (SDLC) approach utilizing barcode and Radio Frequency Identification (RFID) to be able to store and read products’ data. The users involved in this coconut sugar supply chain study are farmers, collectors, processors, transporter and retailers. The prototype traceability system that has been developed can be used by actors and consumers and other stakeholders, such policy makers or governmental officers to track and trace products from farmers to retailers.
Introduction
Indonesia is part of the Asian and Pasific Coconut Community (APCC) country which has the largest of coconut area of about 3.7 million hectares and the second largest producer of coconut commodities in the world. Coconut product of Indonesia has market share of 18% of all coconut commodities traded in the world [6]. Therefore, the coconut commodity in Indonesia is reprocessed to increase value-added of the product. One of the coconut commodity that is being processed is the coconut sugar. Currently, the demand on coconut sugar is increasing worldwide because it provides health benefits. Coconut sugar has a low glycemic index (GI) value of 35 ± 4. The glycemic index is a classification of food based on the glucose solution which has been proposed as a therapeutic principle for diabetes mellitus [10]. The lower the glycemic index, the better it is for consumers’ health.
[Seminar* et al., 4(11): November, 2017]
ISSN: 234-5197
Impact Factor: 2.715
I
NTERNATIONAL
J
OURNAL
OF
R
ESEARCH
S
CIENCE
&
M
ANAGEMENT
required in a business process, to develop a prototype of traceability system application, and to test and evaluate the prototype of the traceability system of the supply chain of coconut sugar products.
This research focused on the analysis of the information system required on managing data along the coconut sugar supply chain. The design of this traceability system is limited to coconut sugar supply chain in Mitra Niaga Indonesia, Bogor - Indonesia.
Research Method
Place and Framework of Study
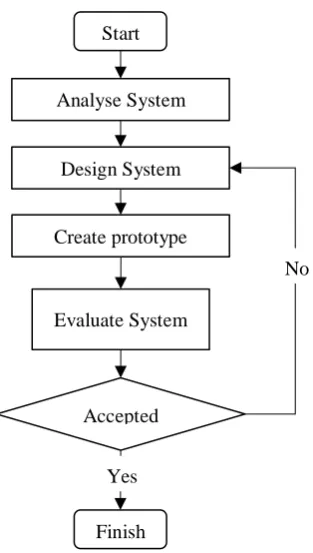
The study was conducted from January to June 2017 at Mitra Niaga Indonesia, Bogor, West Java and farmers (supplier) in the coconut plantation of Purwokerto Regency, Central Java Province. The steps of research were analysing the supply chain model, designing system, collecting information and resources required to create prototype, and evaluating the system. This traceability system design adopted conceptual framework research by System Development Life Cycle (SDLC) approach [5]. Figure 1 shows conceptual framework of this research.
Figure 1. The conceptual framework research
System Analysis
System analysis identified a detailed stage of business processes which exist in the traceability system. In addition, the analysis was conducted in order to illustrate the exchange of data in traceability system. At this stage, Data Flow Diagrams (DFD) was created based on the process occurs in the company's business processes by using a standard notation designed by Gane and Sarson [2]. System analysis also determined how to store data, the level of urgency, and adjusts the resources using Computer Based Information System (CBIS) approach which consist of hardware, software, dataware, netware, infoware, and brainware [9].
System Design
System design was conducted to select the information that was important to be documented. It included input data, output data, database design, and interface design. Input data was derived from the actors in business processes to record or document the condition of the product. The output data would be the traceability data that
Start
Analyse System
Design System
Create prototype
Evaluate System
Accepted
Finish Yes
[Seminar* et al., 4(11): November, 2017]
ISSN: 234-5197
Impact Factor: 2.715
I
NTERNATIONAL
J
OURNAL
OF
R
ESEARCH
S
CIENCE
&
M
ANAGEMENT
could be accessed by the involved actors and public. Database design was conducted by selecting important informations to be documented. Interface design was conducted to facilitate users when operating this system.
Prototype Developement
Prototype of the system was made by using data that was obtained from the previous steps by implementing the results of analysis and design through system development. At this step, prototype development was done by using the language of Javascript application programming. The system prototype was focused on the capability of documenting and tracing data. The developed traceability system was intended to update the product tracing system which was still paper-based. It proposed an integrated traceability system from the farmers up to retailers. Figure 2 shows the used treacability system scheme. All transactions made from farmers, collectors, processors, shippers and retailers are stored in a centralized database.
Figure 2. The used traceability system scheme
Evaluation
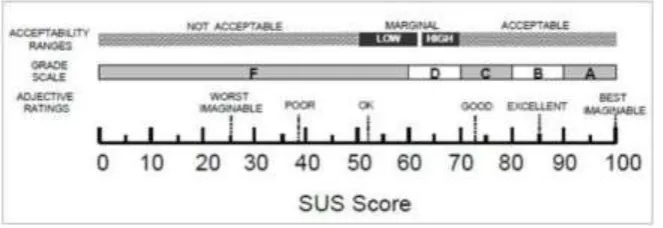
The last step of system development was implementating the system that had been developed. After implementation, the system was evaluated using System Usability Scale (SUS) model using the questionnaire made by John Brooke in 1986 [1]. SUS questionnaire consists of 10 questions with five response parameters. The sample of respondents on the evaluation was 10 actors that using the system. It was explained that 10 participants was enough to reveal the problem at least 80% of usability [3]. Figure 3 shows the scale to determine whether the system category was acceptable or not.
Figure 3. SUS category ratings
The SUS score was calculated by multiplying the scores of each question with the range of 0 to 4. For the odd number of questions (1, 3, 5, 7 and 9) the value of score position was minus 1 and for even number questions (2, 4, 6.8, and 10) the value score was minus 5 by score position. Assessment score then multiplied by 2.5 and
Farmers Collectors
Processors
Shippers Retailers
Product
Consumers Traceability System
[Seminar* et al., 4(11): November, 2017]
ISSN: 234-5197
Impact Factor: 2.715
I
NTERNATIONAL
J
OURNAL
OF
R
ESEARCH
S
CIENCE
&
M
ANAGEMENT
divided by the number of respondents to determine the average value of SUS. The formula of system evaluation as follows:
Respondent of
Number
2.5 Score Total
SUS
Results and Analysis
Coconut Palm Sugar Supply Chain
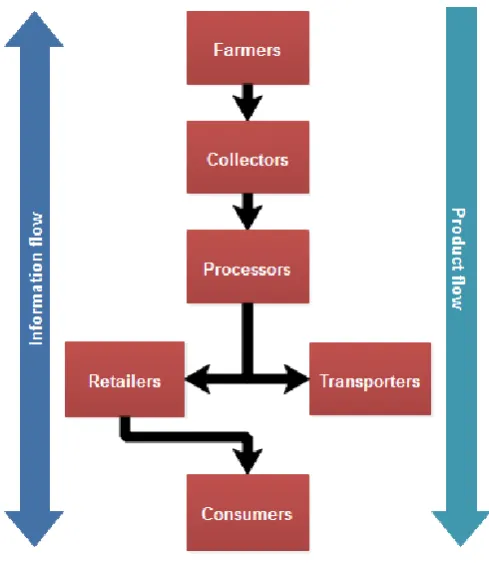
The coconut sugar supply chain had five actors involved in the designed traceability system. The five actors who performed on certain activities that directly related to the supply chain were farmers, collectors, processors, transporters and retailers. Each farm must already had an organic certificate and the product processor must had a food safety certificate according to the buyer’s requirement. The movement of products and information that runs on the supply chain could be known through examination of supporting documents from farmers, collectors, processors, transporters, retailers and product information documents. Figure 4 shows actors involved on supply chain, information flow, and product flow.
Figure 4. Flowchart of coconut palm sugar supply chain
Computer Based Information System (CBIS)
[Seminar* et al., 4(11): November, 2017]
ISSN: 234-5197
Impact Factor: 2.715
I
NTERNATIONAL
J
OURNAL
OF
R
ESEARCH
S
CIENCE
&
M
ANAGEMENT
Figure 5. CBIS on Coconut Palm Sugar Traceability (adopted and modified from Seminar [9])
Supporting resources on the coconut sugar supply chain traceability system include: 1) hardware consists of sensing devices, data loggers, data scanners, communication devices, data storage, information display devices, processing units (microprocessors), computers, and communication network. Hardware resources were applied to every actor involved in the supply chain traceability system. 2) software consists of operating system, database management system application (DBMS), geographic information system (GIS) application, analysis and reporting application. The operating system was used to support applications designed with desktop-based applications (computers). DBMS was used for data storage. GIS was used to support the storage and display of geographic information (map location). The analytics and reporting application was used to print transaction report data. 3) dataware was all data available on the traceability system in form of location data, actors data, product manufacturing data, product quality data, transaction data and delivery data. 4) netware on this traceability system included network access and control, communication media as an access to connect each actor in integrated system, directory and webservice as data storage between actors, and network cluster technology (intranet, extranet, and internet). 5) infoware was information result of traceability system in digital and print-out form. Such information may be used by the company as a data source to recall product decisions. Some information was also given to consumers who want to know the product information. 6) brainware are all actors involved in the supply chain.
Entity-Relationship Diagram (E-RD) Traceability System
[Seminar* et al., 4(11): November, 2017]
ISSN: 234-5197
Impact Factor: 2.715
I
NTERNATIONAL
J
OURNAL
OF
R
ESEARCH
S
CIENCE
&
M
ANAGEMENT
Figure 6. E-RD for lot material product
Developed System
The developed system has been implemented on desktop platforms. This system was functioned as a tool to trace product information based on transactions that occured in the coconut sugar supply chain. Product information can be traced by entering product code or scan using RFID and barcode sensor tool.
This research was focused on designing and developing a traceability system that can be used by any actor who contributes to the coconut sugar supply chain and was intended for consumers to obtain more transparent product information. Until now there has been no research, especially about the application system that can perform product information search on the coconut sugar supply chain. Several studies are relevant for the application of traceability systems in fresh fish supply chain [4], development of traceability systems utilizing 2D barcodes and RFID [8]. Figure 7 shows a system view that has been designed based on DFD and user needs.
Figure 7. Appearance of the system: (a) tracing by barcode, and (b) tracing by product code
[Seminar* et al., 4(11): November, 2017]
ISSN: 234-5197
Impact Factor: 2.715
I
NTERNATIONAL
J
OURNAL
OF
R
ESEARCH
S
CIENCE
&
M
ANAGEMENT
The application system was designed by using Javascript programming language based on desktop. Product information data was inputted through the system to a centralized database by each actor involved in the supply chain and the system can represent the product information by the product code or barcode. Figure 8 shows 2 example results to trace information of product and supplier. Searching on farmers or raw material suppliers can inform farmer locations by displaying a map of the region via web. The map of the area explains where suppliers/farmers and plantations are located (blue polygon).
Figure 8. Result of tracing information of (a) product and (b) supplier
Evaluation System
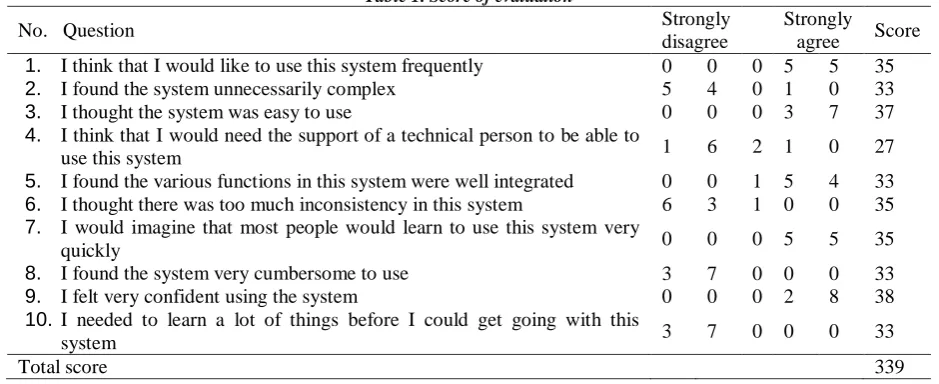
The traceability system evaluation was conducted by using the System Usability Scale (SUS) model with a questionnaire made by John Brooke in 1986. The number of respondents in the evaluation was 10 people who were users of the system. Scores obtained from the questionnaire show in Table 1. The average value of SUS obtained based on the evaluation is 84.75 which means the system is acceptable.
Table 1. Score of evaluation
No. Question Strongly
disagree
Strongly
agree Score
1. I think that I would like to use this system frequently 0 0 0 5 5 35
2. I found the system unnecessarily complex 5 4 0 1 0 33
3. I thought the system was easy to use 0 0 0 3 7 37
4. I think that I would need the support of a technical person to be able to
use this system 1 6 2 1 0 27
5. I found the various functions in this system were well integrated 0 0 1 5 4 33
6. I thought there was too much inconsistency in this system 6 3 1 0 0 35
7. I would imagine that most people would learn to use this system very
quickly 0 0 0 5 5 35
8. I found the system very cumbersome to use 3 7 0 0 0 33
9. I felt very confident using the system 0 0 0 2 8 38
10. I needed to learn a lot of things before I could get going with this
system 3 7 0 0 0 33
Total score 339
Conclusion
The traceability system prototype has been developed and evaluated to store data products that can be accessed according to the needs of the users. This system was applied to the coconut sugar supply chain as a desktop-based application. Implementation of the developed traceability system is expected to give an advantage for the
[Seminar* et al., 4(11): November, 2017]
ISSN: 234-5197
Impact Factor: 2.715
I
NTERNATIONAL
J
OURNAL
OF
R
ESEARCH
S
CIENCE
&
M
ANAGEMENT
company to improve product competitiveness in international market. The developed system can be further applied in the company as a tool for linking all actors in coconut palm sugar supply chain and providing important data’s information for all actors and stakeholders. The user of this system can also get information the location map of the raw material origin of the processed product. Food safety of the product can be guaranteed because traceability can provide product information which is more transparent.
References
[1] Brooke J. SUS: a ‘quick and dirty’ usability scale. In: Jordan PW, Thomas B, Weerdmeester BA, McClelland IL. Usability Evaluation in Industry. London: Taylor & Francis. 1996: 189-194.
[2] Dennis A, Wixom BH, Roth RM. Systems Analysis and Design. 5th ed. Hoboken: John iley & Sons, Inc. 2012: 188.
[3] Faulkner L. Beyond the five-user assumption: Benefits of Increased Sample Sizes in Usability Testing. Behavior Research Methods, Instruments, & Computers. 2003; 35(3): 379-383.
[4] Karlsen KM, Sørensen CF, Forås F, Olsen P. Critical Criteria When Implementing Electronic Chain Traceability in A Fish Supply Chain. Food Control. 2010; 22(8): 1339-1347.
[5] Kendall KE, Kendal JE. System Analysis and Design. 8th ed. New Jersey: Pearson Prentice Hall. 2011:8
[6] Pirmansah A ed. Coconut Statistical Yearbook 2014. Asian and Pacific Coconut Community. Report number: 63. 2005. ISSN 0855-235X. 2015.
[7] Qian H, Huang X, Bao Z, Ye X. Analysis of Agricultural Products Quality Management Information System in Zhejiang. Applied Mechanics and Materials. 2013; 380-384: 4663-4666.
[8] Qian JP, Yang XT, Wu XM, Zhao L, Fan BL, Xing B. A Traceability System Incorporating 2D Barcode and RFID Technology for Wheat Flour Mills. Computers and Electronics in Agriculture. 2012; 89: 76–85.
[9] Seminar KB. Food Chain Transparency for Food Loss and Food Waste Surveillance. Journal of Development in Sustainable Agriculture University of Tsukuba. 2015; 11: 17-22.