Ordered Nanoporous Carbon Based Solid-Phase
Microextraction for the Analysis of Nitroaromatic
Compounds in Aqueous Samples
Anbia, Mansoor*
+; Khazaei, Morteza
Research Laboratory of Nanoporous Materials, Faculty of Chemistry, Iran University of Science and Technology, P.O. Box: 16846-13114 Tehran, I.R. IRAN
ABSTRACT: In this paper, the possibility of using a new ordered nanoporous carbon as a new
fiber in headspace solid phase microextraction (HS-SPME) to determine of mononitrotoluenes (MNTs) in waste water is demonstrated. The structural order and textural properties of the ordered nanoporous carbon were studied by X Ray Diffraction (XRD), Scanning Electron Microscopy (SEM) images and nitrogen adsorption isotherms. The analysis was done on a gas chromatograph equipped with flame ionization detector and capillary column. The main factors affecting the MNT compounds extraction such as rate of stirring sample solution, sample solution volume, ion strength of sample solution, extraction time and temperaturehave been investigated and established. Optimization of these parameters was done by Taguchi method and Orthogonal Array Design (OAD). The effects of these parameters were investigated using the analysis of variance (ANOVA). Under the optimum conditions, recovery values were between 87.1% and 106.2%, Limit Of Detections (LODs) ranged from 0.01 µg/L to 0.16 µg/L and Linear Dynamic Range (LDR) of 0.5–400 µg/L was obtained. Relative standard deviation of single fiber and fiber-to-fiber (n=4) was in the range of 3.7-4.2% and 7.3-8.9%. Performance of the present method was evaluated for extraction and determination of nitroaromatic compounds in wastewater samples in the range of microgram per liter and satisfactory results were obtained.
KEY WORDS: Gas chromatography, Mononitrotoluenes, Headspace solid phase microextraction,
Ordered nanoporous carbon, Taguchi method.
INTRODUCTION
Mononitrotoluenes (MNTs) are a group of explosive compounds that due to their broad application are widely present in aquatic environment [1]. MNTs are used in the synthesis of intermediates for production of dyes, rubber chemicals, pesticides and several other industrial applications [2-3]. The widespread use, mobility and
harmfulness of nitroaromatics and their degradation products demand rapid analysis in environmental matrices [4].
Capillary gas chromatography is the conventional technique for detection and identification of volatile compounds. However a proper isolation and
*To whom correspondence should be addressed.
+E-mail:[email protected]
pre-concentration technique should be applied before the chromatographic analysis. A number of separation/ preconcentration procedures have been used for nitroaromatics and related compounds in aqueous samples include Liquid Liquid Extraction (LLE) [5], Solid Phase Extraction (SPE) [6] and microextraction. LLE based methods are time consuming labour intensive and require large amounts of organic solvents [7]. SPE method has the advantage of lower solvent consumption but is also time-consuming due to the numerous steps involved including conditioning, sample application, washing and elution of the SPE columns [8]. Microextraction techniques used are including Dispersive Liquid Liquid Micro Extraction (DLLME) [9], Homogeneous Liquid Liquid Micro Extraction (HLLME) [10], Headspace Solvent Micro Extraction (HSME) [11] and Solid Phase Micro Extraction (SPME) [12,13]. SPME method developed by Pawliszyn et al. in 1989 to redress the need for fast, solvent-free, sample preparation and has a number of advantages over many conventional sample preparation techniques [14]. SPME has been coupled with various analytical techniques such as Gas Chromatography (GC), GC-Mass Spectrometry (GC-MS), High Performance Liquid Chromatography (HPLC), Raman spectrometry [15] and capillary zone electrophoresis [16]. SPME process is carried out in some modes. Each of these methods has its own advantages and disadvantages. Among the possible alternatives, Headspace SPME (HS-SPME) which fiber is exposed into the headspace of the sample suitable for volatile analytes is presently considered as the best choice [17].
In SPME method, selection of appropriate SPME fiber coatings is important and the best fiber must be selected. Since the discovery of the ordered nanoporous silica materials including MCM-48, MCM-41, MCM-50, SBA-3 and SBA-15 [18], interest has been focused on them to serve as sorbents and separation materials [19-23]. Recently, ordered nanoporous carbons (CMKx) that is prepared from mesoporous silica templates are an area of extensive research, particularly with regard to potential applications as adsorbent for environmental remediation. The first nanoporous carbon material was prepared employing the MCM-48 type nanoporous silica as the hard molecular template and named as CMK-1. This was a beginning to synthesize other types of
nanoporous carbon materials such as CMK-3, CMK-5 [24-27]. CMKx can be prepared from a wide variety of low-cost precursors, typically biocompatible, quite chemically stable under nonoxidizing conditions, mechanical stability and is easily handled [28]. Large surface area (1000-1500 m2/g), pore volume higher than 0.5 cm3/g, high adsorption capacity and high thermal stability are the significant characteristics of these materials which enable them to be used in the catalyst industry [29], adsorbent of the organic or metallic pollutants from the industrial waste waters, and biomedical engineering Applications of these materials as SPME fiber coatings has been studied. For example, ordered nanoporous silica materials including, phenyl functionalized MCM-41 [30-31] and amino ethyl-functionalized SBA-15 [32].
In our previous work, [33] we used CMK-1 as a new fiber in SPME for pre-concentration of BTEX compounds for the first time. In this study CMK-1 adsorbent efficiency as SPME fiber for separation and microextraction of MNT compounds from aqueous samples has been studied and parameters that have some effect on microextration process were optimized by Taguchi method and orthogonal array design (OAD). The resulting method was validated for quantitative purposes and then was applied to real sample analysis in combination with Gas Chromatography-Flame Ionization Detection (GC–FID).
EXPERIMENTAL SECTION
Reagents and solutions
Stock standard solution of MNT at the concentration of 1000 mg/L was prepared by dissolving appropriate amount of MNT in methanol or acetonitrile. The working standard solutions were prepared by serial dilutions of the stock solution with ultrapure water right before analyzing them. All solutions were prepared with ultrapure water.
nanoporous silica (MCM-48); sucrose as the carbon source and finally sulfuric acid as the catalyst for synthesis of nanoporous carbon were all obtained from E. Merck (Darmstadt, Germany).
Apparatus
Gas chromatographic analyses were made using Shimadzu (Japan) GC 2010 equipped with a flame ionization detector, hydrogen generator Model OPGU- 2200s, and split/splitless injector. The GC apparatus was equipped with a BP-5 capillary column (30 m×0. 25 mm i.d, 0.25 µm film thickness, 95% methyl–5% phenyl) from SGE (Victoria, Australia).
A SPME device was used in all experiment supplied by Azar Electrode Co., (Oroumie, Iran). The X-ray powder diffraction patterns were recorded on a Philips 1830 diffractometer using Cu -Kα radiation. The diffractograms were recorded in the 2θ range of 0.8–10 with 2θ step size of 0.01° and step time of 1 s. Adsorption-desorption isotherms of the synthesized samples were measured at 77 K on micromeritics model ASAP 2010 sorptometer to determine average pore diameter. Pore size distribution was calculated by the Barrett–Joyner–Halenda (BJH) method [34], while surface area of the sample was measured by Brunaure-Emmet–Teller (BET) method[35]. SEM images were obtained with JEOL 6300F SEM.
Synthesis of nanoporous silica (MCM-48)
MCM-48 was prepared according to the synthesis procedure described by Shao et al. [36]. In a representative synthesis, the MCM-48 molecular sieves were prepared as follows: 10 mL of TEOS was mixed with 50 mL of deionized waterand the mixture was vigorously stirred for 40 min at 35°C then 0.9 g of NaOH was added to it, and at the same time 0.19 g of NaF was added to the mixture. After another 60 min of vigorous stirring, 10.61 g of CTABwas added to the mixture, and stirring continued for 60 min. The mixture was heated for 24 h at 120°C in an autoclave under static conditions.The resulting product was filtered, washed with distilled water, and dried at 120°C. The as-synthesized samples were then calcined in air for 4 h at 550°C, increasing the temperature to 550°C at 18°C min-1 of the heating rate.
Synthesis of CMK-1
CMK-1 was prepared according to the synthesis procedure described by Ryoo et al. [25]. In a representative synthesis, the CMK-1 molecular sieve was prepared as follows: 1 g MCM-48 was added to a solution obtained by dissolving 1.25 g sucrose and 0.14 g H2SO4 in 5.0 mL H2O. The resultant mixture was dried in an oven at 100°Cand then temperature was increased to 160°C. After 6 h at 160°C, the MCM-48 silica containing the partially carbonizing organic masses was again added toan aqueous solution consisting of 0.75 g sucrose, 0.08 g H2SO4and5.0 mL H2O toassure carbonization. The resultant mixture was dried again at 100°C, and subsequently the oven temperature was increased to 160°C. The color of the sample turned dark brown or nearly black. This powder was heated to 900°C under vacuum using a fused quartz reactor equipped with a fritted disk. The carbon–silica composite obtained was washed with 1M NaOH solution in 1:1 EtOH–H2O mixture(twice) at 90°C to dissolve the silica template completely. The carbon samples were filtered, washed with ethanol and dried at 120 °C.
Fiber preparation
First, 0.08 g of CMK-1 powder was poured into a solution of 0.04 g Styrene-Acrylonitrile Copolymer (SAN) powder in 3 mL acetone and well-mixed. After a few minutes, acetone was evaporated to form a viscose suspension. A silver wire (1 cm) was introduced into the above-mentioned suspension. After evaporation of acetone at room temperature, a very firm porous coating of the sorbent in a SAN matrix was formed on the silver wire. The fiber was then conditioned in injection port of a GC at 240°C for 30 min to remove any fiber contaminations.
GC operating conditions
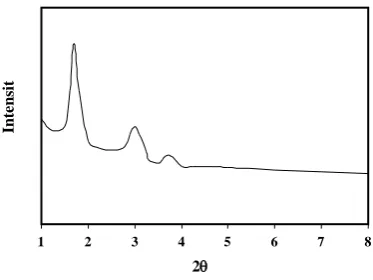
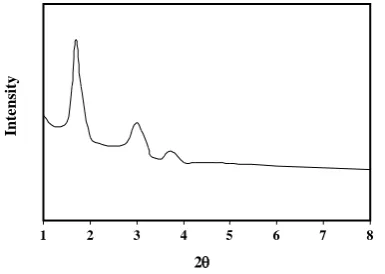
Fig. 1: XRD pattern of CMK-1.
Headspace sampling of MNTS from aqueous samples
12 mL of an aqueous solution of MNT compound with specific concentration(50 µg / L) was transferred to a 15 mL vial with silicon septum. After addition of proper amount of sodium chloride salt (196 mg) and magnetic stirrer, vials were closed by aluminium cover. Vials were put in water bath and then were transferred on to magnetic stirrer. After bath water temperature fixation (60 °C), nanoporous carbon coated on silver wire was exposed to headspace of sample solution. After proper time (30 min), fibers were taken out from sample solution and for thermal desorption they were transferred to gas chromatography injection port.
RESULTS AND DISCUSSION Characterization of the CMK-1
The quality of the nanoporous carbon samples prepared in this study was examined by nitrogen adsorption–desorption analysis, X Ray Diffraction (XRD) techniques and SEM image.
XRD patterns
In order to check the structural degradation, XRD data of nanoporous carbon were obtained on Philips 1830 diffractometer using Cu-Kα radiation of wavelength 0.154 nm. Fig. 1 shows the XRD peaks of the CMK-1 sample. The XRD patterns of CMK-1 showed three diffraction peaks that can be indexed to (1 1 0), (2 1 0) and (2 2 0) in the 2θ range from 0.8 to 10, representing well-ordered cubic pores. The observation data from the original sample of CMK-1 are in good agreement with that previously reported [25].
Fig. 2. Adsorption–desorption isotherms of nitrogen at 77 K on CMK-1.
N2 adsorption-desorption analysis
Nitrogen physisorption is the method of choice to gain knowledge about nanoporous materials. This method gives information on the specific surface area and the pore diameter. Calculating pore diameters of nanoporous materials using the BJH (Barrett, Joyner, and Halenda) method is common. Former studies show that the application of the BJH theory gives appropriate qualitative results which allow a direct comparison of relative changes between different nanoporous materials. Fig. 2 shows nitrogen adsorption and desorption isotherms measured at 77 k by using a Micromeritics ASAP 2010 automatic analyzer. BET surface areas and the pore size determined by BJH method for the synthesized nanoporous sorbents were determined by the adsorption branches of the isotherms. Both of nanoporous materials show a type IV isotherm. The type IV isotherm (IUPAC classification) is typical for mesoporous systems. The surface area of CMK-1 samples was 1010.5m2/g and the average pore size was 26 A˚. It should be noted that obtained results are in good agreement with previous reported results[25].
SEM Images of adsorbents
The surface morphology of the obtained CMK-1 and CMK-1 coated on silver wire was observed by SEM. Asshown in Fig. 3, SEM pictures of the samples are in good agreement with previous results [25].
Optimization of the coating composition of fibers
To optimize the coating composition of fibers, various fibers of different composition of the coats were prepared
1 2 3 4 5 6 7 8
2θ
Int
ens
it
0 0.2 0.4 0.6 0.8 1
Relative Pressure (P/P0)
450
400
350
300
250
200
150
100
50
0
V
o
lum
e a
ds
o
rbe
d
(c
m
3/g
S
T
P
Fig. 3: SEM photographs of (A) CMK-1 powder and (B) CMK-1 coated of silver wire.
Fig. 4: Optimization of the fiber composition.
and tested. Fibers with coating compositions of 0.15, 0.25, 0.5, 0.75 and 0.85 (CMK-1/SAN) (wt %) were used to extract from solution samples containing 100 µg / L of the MNT compounds. As illustrated in Fig. 4 increasing the (CMK-1/SAN) ratio promoted the extraction efficiency. Coatings having the ratio of (CMK-/SAN = 0.85) had the highest extraction efficiency, but these fibers did not show a good mechanical stability, consequently coating with the composition of (CMK-1/SAN=0.75) was selected as the optimum one and used for the experiments, afterwards.
Taguchi design
The Taguchi method [37-39] has been generally adopted to optimize the design parameters, because this systematic approach can significantly minimize the overall testing time and the experimental cost. Using the orthogonal array specially designed for the Taguchi method, the optimum experimental conditions can be easily determined. This study considers five controllable
factors and each factor has four levels. Therefore, an OA16 (45) orthogonal array is chosenand the experimental conditions (Table 1) can be obtained. In order to estimate the best conditions for the extraction of MNTs16 experiments were performed. ANOVA (analysis of variance) technique was used to assess the results and showed that the most important factor contributing to the extraction efficiency was extraction time (42.2%) followed by % salt (25.3%)
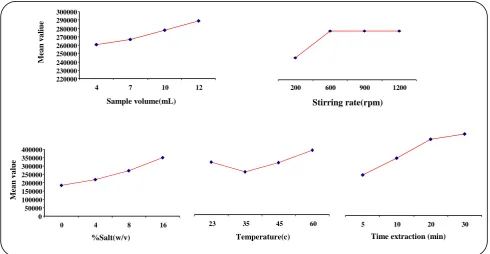
Effect of stirring rate
Agitating the solution can promote the mass transfer in the aqueous phase and induce the convection in the headspace. This pheromonecan be facilitating the equilibrium between the aqueous phase and headspace. Extraction in rates of stirring of 100, 600, 900 and 1200 rpm was tested. As can be seen in Fig. 5, the most extraction was at 600 rpm.At higher ratesthe extraction amountdid not change. ANOVA results shows that percentage effect of stirring rate of sample solution on MNT compounds extraction is insignificant.
Effect of salt addition
It is well known that the water solubility of an organic compound is reduced by adding salt to an aqueous solution of the analytes. Salt addition increases the extraction efficiency for some analytes especially polar compounds and volatiles. However, it is not necessary for analytes with high distribution constants [40]. To study the salting-out effect, the extraction is performed in the presence of different concentrations of NaCl (0-16 wt%). The results (Fig. 5) showed that by increasing salt concentration from 0 to 16%, extraction amount increases, too.
1 2 3 4 5 6 7 8
2θ
In
te
n
si
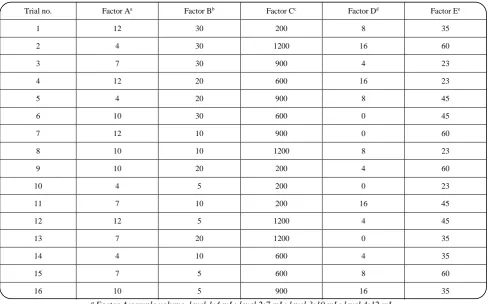
Table 1: The OA16 (45) matrix for optimization of HS-SPME-GC-FID of MNT.
Trial no. Factor Aa Factor Bb Factor Cc Factor Dd Factor Ee
1 12 30 200 8 35
2 4 30 1200 16 60
3 7 30 900 4 23
4 12 20 600 16 23
5 4 20 900 8 45
6 10 30 600 0 45
7 12 10 900 0 60
8 10 10 1200 8 23
9 10 20 200 4 60
10 4 5 200 0 23
11 7 10 200 16 45
12 12 5 1200 4 45
13 7 20 1200 0 35
14 4 10 600 4 35
15 7 5 600 8 60
16 10 5 900 16 35
a Factor A:sample volume, level 1:4 mL; level 2:7 mL; level 3:10 mL; level 4:12 mL.
b Factor B: extraction time, level 1:5 min; level 2:10 min; level 3:15 min; level 4:20 min.
c Factor C: rate stirring, level 1:200 rpm; level 2:600 rpm; level 3:900 rpm; level 4:1200 rpm.
d Factor D: % salt (w/v), level 1:o(w/v); level 2:4 (w/v); level 3:8(w/v); level 4:16 (w/v).
e Factor E: temperature , level 1: 23 ºC; level 2:35 ºC; level 3:45 ºC; level 4:60 ºC.
Consequently, succeeding experiments were carried out using samples solution containing 16 wt% of the sodium chloride salt. ANOVA results reported that percentage effect of salt concentration on MNT compounds extraction is 25.3%.
Effect of extraction time
Because SPME is an equilibrium method, extraction time as a parameter effective on microextraction process should be optimized. The optimal time for extraction should be the time of equilibrium since the mechanism of SPME is based on the equilibrium between analyte and the nonporous phase of the fibre. The effect of the extraction time on the extraction of the MNT compounds is illustrated in Fig. 5. The result reveals that increasing the extraction time from 5 to 30 min increased the efficiency of the extraction. The time required for equilibrium is 30 min. Therefore the extractions were done in 30 min. ANOVA results reported percentage
effect of extraction time on MNT compounds extraction is 42.2% which is the highest among all the parameters.
Effect of sample volume
Fig. 5: Effect of sample volume, extraction time, temperature, rate stirring and % salt (w/v) on the HS-SPME-GC-FID of MNT.
Effect of extraction temperature
In headspace SPME, temperature has a dual effect. The use of high temperature is suitable for increasing volatility ofanalytes and establishing the analytes distribution equilibrium between the sample solution and gaseous phase but adsorption of the analytes on the fiber is undesirable at high temperatures.However, optimization of the extraction temperature is necessary. To study this effect, the extraction of the MNT compounds were carried out at different temperatures including 25, 35, 45 and 60 ºC and the results are presented in Fig. 5. The maximum extraction was obtained at 60 ºC. Therefore, other experiments were carried out at 60 ºC. ANOVA results showed that percentage effect of sample solution temperature on MNT compounds extraction is 15.7%.
Optimization of desorption time and desorptiontemperature
After optimization of all parameters by Taguchi method, desorption time and temperature were investigated. Desorption tests were conducted at temperatures of 200, 210, 220 and 230 ºC and the highest efficiency was achieved at 230 ºC. It should be noted that the SAN adhesive was totally stable at this temperature and did not produce any additional peaks, while exceeding this temperature resulted in degradation of the adhesive.
On the other hand, the fiber residence times of 0.5, 1, 1.5 and 2 min in the injection port (splitless mode) were investigated to determine the optimum desorption time. These tests showed that desorption was complete at 1min. So, it was determined that optimum desorption time is 1 min.
Fiber regeneration
One of the important features of the SPME systems is the regeneration ability of the fiber which greatly reduces the process cost. In this study, more than 60 experimental trials were carried out with one unique fiber and recovery values were evaluated by observing the changes in the recoveries of analysts. The results indicate that the fiber is stable in operation process. After 60 cycles, recovery of MNTcompounds was stable to over 87%.
Analytical performance
In order to investigate the applicability of the proposed method for determining MNT in water samples, several factors including Limits Of Detection (LOD), Dynamic Linear Range (DLR), regression equation, correlation of determination (r2) and Relative Standard Deviation (R.S.D.) (single fiber and fiber-to-fiber) were evaluated.
Calibration curves for the MNTs were tested in the concentration range of 0.1-1000 µgL-1. The Limit Of Detection (LOD) was calculated as the concentration of
220000 230000 240000 250000 260000 270000 280000 290000 300000
4 7 10 12
Sample volume(mL)
M
ea
n
v
a
li
u
e
200 600 900 1200
Stirring rate(rpm)
0 50000 100000 150000 200000 250000 300000 350000 400000
0 4 8 16
%Salt(w/v)
23 35 45 60
Temperature(c)
5 10 20 30
Time extraction (min)
M
ea
n
v
a
lu
Table 2: Quantitative result of SPME-GC-FID of MNT from water sample.
Analyte LODa Rb Regression equation LDRc %RSD
fiber-to-fiber
O-NT 0.04 0.998 Y=2233x + 7402d 0.5-400 7.3
m-NT 0.16 0.999 Y=2182x + 10934 0.5-400 8.7
p-NT 0.01 0.998 Y=4560x + 3900 0.5-400 8.9
a) Limit of detection (µg / L). b) Correlation coefficient. c)Liner dynamic range ( µg / L). d) Y and x are peak area and concentration of the analytes (µg / L), respectively.
Table 3: Comparisons of LODs, RSDs, Matrix and LDR for extraction of MNTs from aqueous sample using DLLME, HLLME, HSME, HS-SPME
Extraction methods LDR µg / L LOD µg / L RSD% Matrix Reference
DLLME 0.5–300 0.09–0.1 4.5-5.6 Water [9]
HLLME 1–500 0.09–0.1 5.4-8.0 Water [10]
HSME 3-600 0.02–0.06 2.6-6.6 Water [11]
HS-SPME 0.5–400 0.01-0.16 3.7-4.3 Water This work
Table 4: Determination of the MNT in different real sample by SPME-GC-FID.
Sample o-Nitrotoluene m-Nitrotoluene p-Nitrotoluene
River water
Non-spiked N.D N.D N.D
Spikeda 54.4±1.7b 52.5±3.5 53.4±2.7
Recovery (%) 108.8 105.1 106.8
Sea water
Non-spiked N.D N.D N.D
Spiked 51.9±3.2 49.1±4.2 44.8±3.9
Recovery (%) 103.7 98.2 89.6
Waste water of (P.C.I. Co.)
Non-spiked 15.5±1.2 N.D N.D
Spikedc 41.6±2.1 23.4±1.7 26.5±1. 1
Recovery(%) 104.4 93.7 106
a) 50 µg / L of the MNTs were added to 12 mL of river water sample and sea water sample. b) Mean value of three replicate measurements with relative standard deviations.
c) 25 µg / L of the MNTs were added to 12 mL of waste water sample.
the analyte equal to three times of the standard deviation of the blank signal divided by the slope of calibration curve in the range of 0.01-0.16 µg / L for different MNT. The analytical performance of the proposed method is summarized in Table 2.
The analytes calibration curve showed a good linearity (0.5-400 µg / L) with a correlation of coefficient of 0.998-0.999. The relative standard deviation of single fiber and fiber to fiber (n=4) was obtained in the ranges of 3.75-4.27 and 7.3-8.9, respectively.
In this study, we compared the proposed method with other microextraction methods to show its efficiency. Results of these comparisons are summarized in Table 3. As evident that, this method compared to other microextraction methods such as DLLME, HLLME
and HSME has provided good and acceptable results.
Natural sample analysis
The HS-SPME method was employed on the real samples to measure the extraction amount of MNT compounds. The real samples included river water (Tejen river), sea water (caspian sea) and a sample from waste water of P.C.I. Company (all are located in Iran). In order to evaluate matrix effect, all above samples were spiked with a standard MNT solution with the concentration of 25-50 µg / L and three replicate desorption analysis were carried out after fiber exposure with the samples.
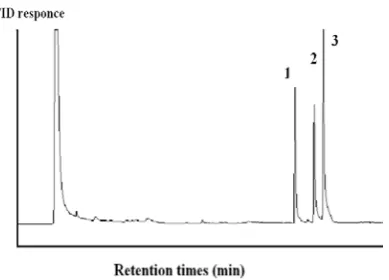
Fig. 6.Chromatogram of standard solution (50 µg/L) of MNTs after HS-SPME at optimum conditions. Peak: (1) o-nitrotoluene, (2) m-nitrotoluene, and (3) p-nitrotoluene.
CONCLUSIONS
In this study we have investigated the efficiency of HS-SPME method for measuring MNT pollutants. A new carbon nanoporous based SPME fiber was coated on silver wire has been used. Structural properties of this adsorbent (CMK-1) was studied by XRD, SEM images and nitrogen adsorption-desorption. The achievements of this method are very low detection limit, good linear range, high mechanical stability and rather high thermal resistance of this fiber is other advantage of this method. Every fiber is usable for 60 extractionextractions.
Acknowledgements
The authors are thankful to research council of Iran University of Science and Technology for the financial support.
Received : May 11, 2013 ; Accepted : Aug. 25, 2014
REFERENCES
[1] Sachdev A., Todd J., Loss J., Incident Investigation of
Mono-Nitro Toluene Still Explosion, Prev. Proc.,
18(4-6): 531-536 (2005).
[2] Boopathy R., Kulpa C.F.,Manning J., Anaerobic Biodegradation of Explosives and Related Compounds by Sulfate-Reducing and Methanogenic
Bacteria: A Review, Bioresour. Technol., 63(1):
81-89 (1998).
[3] Snellinx Z., Nepovim A., Taghavi S., Vangronsveld J., Vanek T., Lelie D.V., Biological Remediation of
Explosives and Related Nitroaromatic Compounds,
Environ. Sci. Pollut. Res., 9(1): 48-61(2002).
[4] Pamme N., Steinbach K., Ensinger W.J., Schmidt T.C.,
Analysis of Polynitrophenols and Hexyl by Liquid
Chromatography–Mass Spectrometry Using
Atmospheric Pressure Ionisation Methods and a
Volatile Ion-pairing Reagent, J. Chromatogr A.,
943(1): 47-54 (2002).
[5] Nosratinia F., Omidkhah M.R., Bastani D., Saifkordi A.A.,
Investigation of Mass Transfer Coefficient under Jetting
Conditions in a Liquid-Liquid Extraction System,
Iran. J. Chem. Chem. Eng. (IJCCE), 29: 1(2010). [6] Jenkins T.F., Miyares P.H., Myers K.F.,MCormick E.F.,
Strong A.B., Comparison of Solid Phase Extraction
with Salting-Out Solvent Extraction for
Preconcentration of Nitroaromatic and Nnitramine
Explosives from Water, Anal. Chim. Acta., 289(1):
69-78 (1994).
[7] Sobhi H.R., Kashtiaray A., Farahani H., Javaheri M., Ganjali M.R., Quantitation of Mononitrotoluenes in Aquatic Environment Using Dispersive Liquid–
Liquid Microextraction Followed by Gas
Chromatography–Flame Ionization Detection,
J. Hazard. Mater., 175(1-3): 279-283 (2010). [8] Camara J.S., Alves M.A., Marques J.C., Development
of Headspace Solid-Phase Microextraction-Gas Chromatography–Mass Spectrometry Methodology
for Analysis of Terpenoids in Madeira Wines, Anal.
Chim. Acta., 555(2): 191-200 (2006).
[9] Kamarei F., Ebrahimzadeh H., Yamini Y.,
Optimization of Solvent Bar Microextraction
Combined with Gas Chromatography for the
Analysis of Aliphatic Amines in Water Samples,
J. Hazard. Mater., 178(1-3): 747-752 (2010). [10] Ebrahimzadeh H., Yamini Y., Kamarei F., Shariati S.,
Homogeneous Liquid-Liquid Extraction of Trace Amounts of Mononitrotoluenes from Waste Water
Samples, Anal. Chim. Acta., 594(1), 93-100 (2007).
[11] Ebrahimzadeh H., Yamini Y., Kamarei F., Khalili M.,
Application of Headspace Solvent Microextraction to the Analysis of Mononitrotoluenes in
Waste Water Samples, Talanta.,72(1): 193-198
(2007).
[12] Kaykhaiil M., Saffari F., Application of Polypyrrole Coated Stainless-Steel Wire to the Headspace
Solid-Phase Microextraction of Aliphatic Amines, Journal
[13] Guan W.,Xu F., Liu W., Zhao J., Guan Y., A New Poly(phthalazine ether sulfone ketone)-Coated Fiber for Solid-Phase Microextraction to Determine
Nitroaromatic Explosives in Aqueous Samples,
J. Chromatogr.,A. 1147: 59 (2007).
[14] Arthur C.L.,Pawliszyn J., Solid Phase Microextraction with Thermal Desorption Using
Fused Silica Optical Fibers, Anal. Chem., 62(19):
2145-2148 (1990).
[15] Wittkamp B.C., Tilotta D.C., Determination of BTEX Compounds in Water by Solid-Phase
Microextraction and Raman Spectroscopy, Anal.
Chem., 67(3): 600-605 (1995).
[16] Whang C.W., Pawliszyn J., Solid Pphase
Microextraction Coupled to Capillary Electrophoresis,
Anal. Commun.,35(11): 353-356 (1998).
[17] Gholivand M.B., Abolghasemi M.M., Piryaei M.,
Maassoumi S.M., Comparative Study of
Hydrodistillation Headspace Solvent
Microextraction and Microwave-Assisted Distillation Headspace Solvent Microextraction for
Analysis of Volatile Components in Stachys Inflata,
Chemija., 23(1): 24-29 (2012).
[18] Kresge C., Leonowicz M., Roth W., Vartuli J., Beck
J., Ordered Mesoporous Molecular Sieves
Synthesizedby a Liquid-Crystal Template
Mechanism, Nature.,359: 710-712 (1992).
[19] Sepehri H., Samadfam M., Asadi Z., Studies on the recovery of Uranium from Nuclear Industrial
Effluent Using Nanoporous Silica Adsorbent, Int. J.
Environ. Sci. Tech., 9(4): 629-636 (2012).
[20] Anbia M.,Ghaffari A., Removal of Malachite Green from Dye Wastewater Using Mesoporous Carbon
Adsorbent, J. Iran. Chem. Soc., 7: 67-76 (2011).
[21] Berijani S., Assadi Y., Anbia M., Dispersive
Liquid-Liquid Microextraction Combined with Gas
Chromatography-Flame Photometric Detection:
Very Simple, Rapid and Sensitive Method for the Determination of Organophosphorus Pesticides in
Water, J. Chromatogr. A., 1123(1): 1-9 (2006).
[22] Ghasemian M.B., Anbia M., Shariati S., Synthesis and Characterization of New Nanoporous cmk-1/sds-fe Sorbent for Determination and Eelimination of Panh Organic com Pounds by spe-uv Technique in Petroleum, Petrochemical and Gas in Dustries,
Petroleum Research., 23(73): 81-94 (2013).
[23] Hudson M.J., Waqif Husain S., Anbia M.,
Development of New Sorbents: I. Ordered Porous
Phase of Titanium Phosphate, J. Iran. Chem. Soc.,
2(1): 54-59 (2005).
[24] Jun S., Joo S.H., Ryoo R., Kruk M., Jaroniec M., Liu Z., Ohsuna T., Terasaki O., Synthesis of New, Nanoporous Carbon with Hexagonally Ordered
Mesostructure, J. Am. Chem. Soc.,122(43):
10712-10713 (2000).
[25] Ryoo R., Joo S.H., Jun S., Synthesis of Highly Ordered Carbon Molecular Sieves via
Template-Mediated Structural Transformation, J. Phys. Chem.
B., 103(37): 7743-7746 (1999).
[26] Ryoo R., Joo S.H., Kruk M., Jaroniec M., Ordered
Mesoporous Carbons, Adv. Mater., 13(9): 677-681
(2001).
[27] Joo S.H., Choi S.J., Oh I., Kwak J., Liu Z., Terasaki O., R Ryoo., Ordered Nanoporous Arrays of Carbon Supporting High Dispersions of Platinum
Nanoparticles, Nature., 412:169- (2001).
[28] Stein A., Wang Z., Fierke M.N.,Functionalization of Porous Carbon Materials with Designed Pore
Architecture, Adv. Mater., 21(3): 265-293 (2009).
[29] Trong D.O., Desplantier D.G., Danumah C., Kaliaguine S., Perspectives in catalytic applications
of mesostructured materials, Appl. Catal. A. Gen.,
222(1-2): 299-357 (2001).
[30] Du X.Z., Wang Y.R., Tao X.J., Deng H.L., An Approach to Application of Mesoporous Hybrid as a
Fiber Coating of Solid-Phase Microextraction, Anal.
Chim. Acta., 543(1-2): 9-16 (2005).
[31] Du X.Z., Wang Y.R., Ma Q.,Mao X.F., Hou J.G.,
Chemically Modified Mesoporous Silica as a Coating Layer of Solid Phase Microextraction for
Determination of Benzo[a]pyrene in Water Samples,
Anal. Lett., 38(3): 487-498 (2005).
[32] Hashemi P., Shamizadeh M., Badiei A., Zarabadi Poorb P., Ghiasv A.R., Yarahmadi A., Amino Ethyl-Functionalized Nanoporous Silica as a Novel Fiber
Coating for Solid-Phase Microextraction, Anal.
Chem. Acta., 646(1-2): 1-5 (2009).
[33] Anbia M., Khazaei M., Ordered Nanoporous Carbon-Based SPME., Determination by GC.,
Chromatographia., 73(3-4), 379-384 (2011). [34] Ciesla U., Scho F., Ordered Mesoporous Materials,
[35] Saito A., Foley H.C., Curvature and Parametric Sensitivity in Models for Adsorption in Micropores,
Aiche. J., 37(3): 429-376 (1991).
[36] Shao Y., Wang L., Zhang J., Anpo M., Synthesis of Hydrothermally Stable and Long-range Ordered,
J. Phys. Chem. B., 109(44): 20835-41 (2005). [37] Zolfaghari G., Esmaili Sari A., Anbia M., Younesi H.,
Ghasemian M.B., A Zinc Oxide-Coated Nanoporous Carbon Adsorbent for Lead Removal from Water: Optimization, Equilibrium Modeling, and Kinetics
Studies, Int. J. Environ. Sci. Tech., 10(2): 325-340
(2013)
[38] Shafie S.Z., Banisi S., Karamouzian M., Eslami A.,
Application of Taguchi Method for Determination of Robust Operating Parameters Against Disturbances
in Flotation of Sarcheshmeh Copper Ore,Modares
Technical and Engineering, 18: 77-86 (2005). [39] Ghambarian M.., Yamini Y., Saleh A.,Shariati S.,
Yazdanfar N., Taguchi OA16 Orthogonal Array
Design for the Optimization of Cloud Point
Extraction for Selenium Determination in
Environmental and Biological Samples by Tungsten-Modified Tube Electrothermal Atomic Absorption
Spectrometry, Talanta., 78(3): 970-976 (2009).
[40] King A.J., Readman J.W., Zhou J.L., The Application of Solid-Phase Micro-Extraction (SPME) to the Analysis of Polycyclic Aromatic
Hydrocarbons (PAHs), Environ Geochem., 25(1):

![Crystal structure of di μ hydroxido bis[aqua(1,10 phenanthroline κ2N,N′)copper(II)] naphthalene 2,6 dicarboxylate hexahydrate](data:image/gif;base64,R0lGODlhAQABAIAAAP///wAAACH5BAEAAAAALAAAAAABAAEAAAICRAEAOw==)