Abstract: The database replication keeps up contents of database such as tables, in various geographical locations that fabricate an arrangement of distributed database. The necessities of database replication are expanding with the time as the use of internet is also increasing. With the purpose of meeting these prerequisites, priorities among requests can be included. In this work two types of priorities i.e., low and high priority is considered in this research article. It is noticeable that the high priority requests are more vital in comparison to low priority requests and therefore low priority requests can be delayed or dropped. The rate of request loss can be lessened utilizing the conditions of load balancing where a portion of the contending requests are transferred to other nodes. In this paper, internet is modelled as small world network, and performance assessment of A-PDDRA (Advanced Pre- bringing Based Dynamic Data Replication Algorithm) is carried out on small world network while considering both priorities and load balancing using computer simulation
Keywords: Database replication, PDDRA, small world networks
© Universiti Tun Hussein Onn Malaysia Publisher’s Office
IJIE
Journal homepage: http://penerbit.uthm.edu.my/ojs/index.php/ijie
The International
Journal of
Integrated
Engineering
Advanced Pre-fetching Based Dynamic Data Replication
under Small World Network Model
Rekhnath Singh
1,*, Raghuraj Singh
21Research Scholar, AKTU
IET, Lucknow, INDIA
2Department of Computer Science and Engineering,
HBTU, Kanpur, INDIA
*Corresponding Author
DOI: https://doi.org/10.30880/ijie.2019.11.01.007
Received 15 June 2018; Accepted 17 September 2018; Available online 30 April 2019
1.
Introduction
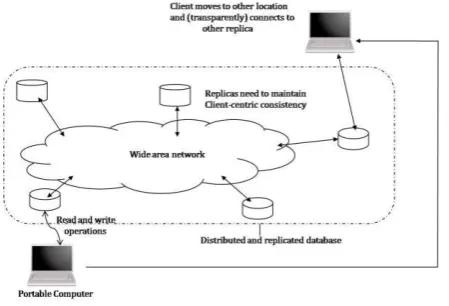
In simple words, replication technique could be characterized as the procedure of duplicating and maintaining the elements of database such as tables, in various databases that fabricate an arrangement of distributed database as detailed in [1]. In distributed database servers are located at various geographical locations, and information updation, replication etc. are preformed on these servers. These updates can take place on any of the servers, later on they can be replicated to other severs. This procedure makes utilization of system of distributed database keeping in mind the end goal to share the information between various sites (Fig. 1) see [2]. Some of the merits of this technique are:
It gives fast, nearby access to shared information because of the way that it keeps up movement over various sites.
As different clients have access of different servers which are closer to them, therefore load on a particular server reduces.
running on fiber optic link, with these links servers are associated utilizing optical to electrical (O/E) or electrical to optical (E/O) transformations as required. However, in fiber optic based network, delay is not a concern and moreover, throughput is also higher. In fiber optical communication dealy is of the order of micro-seconds and throughput at lower loads (<0.6) is nearly 100 percent, however at higher loads (> 0.6) some contention resolution mechanism is desired to maintain high throughput. To avoid conflict among various types of information arriving at the servers’ priorities can be added.
In the event when these servers are not able to serve them, then requests will be dropped. Therefore, for the purpose to avoid requests dropping, we carry out buffering at the servers. However, if buffer overflows, then there will be dropping of low priority requests. We can apply load balancing technique for reducing this loss on servers. This research article, explore the execution of the priories in the requests, alongside load balancing conditions at different servers.
Fig. 1- Schematic of a simple database replication process.
Fig. 2 - Schematic of a replication process in WAN.
2.
Related Work and Preliminaries
Saadat, N et.al. (2012) proposed a Pre-fetching based dynamic data replication algorithm [4]. This algorithm considers some kind of heuristic mechanism to pre-fetch associated files before actual replication begins. This mechanism is helpful in reducing delay and load on replica servers. In yadav et. al.[5-8], Mishra, et.al, (2015) [9], and Singh el. Al, (2018) [10], modifications in PDDRA are suggested, in architectural modification, connections among RS (regional servers) are established for sharing data, this permit nearby searching of the required data For more detail please refer to[5]. The main points of the algorithm are as under:
1. In M-PDDRA method, the internet cloud is assumed to be a master node (Fig. 3) as all the replicas servers are there. only
2. If a request is generated for replication then simultaneous searching begins both at regional servers and on master node. Here, if requested can be served from local or regional servers than acknowledgement received from master node is discarded.
d
b
d
b
we do not have the accessibility of information at any local node or waiting time at local node is larger than round trip time of far server a part of master node, following 2, information can be replicated from master node.
3.
Advanced Pre-fetched Dynamic Data Replication Algorithm (A-PDDRA)
Recently, it is shown that the internet can be modelled as small world network, average distance between a request generating node and server is of four intermediate nodes [11,12]. Therefore, requests arriving at particular node/server may be more, and packet drop may take place. To avoid this drop and load balancing needs to be employed on various nodes/servers. The priority of the request is set in the header of the request packet, and as at each node first header is processed, thus depending on the priority buffer states is created. To accomplish this following modifications are done in M-PDDRA and we call it A-PDDRA.
1. If load on any server increases beyond pre-defined load than arriving requests will be deflected to some other nodes using load balancing mechanism.
2. In case of more than one arrival of requests, high priority request will be preferred over low priority request.
3. Let arriving request is of high priority and buffered request is of low priority even than high priority request will be served prior to low priority requests.
4. To avoid trapping of low priority request in the buffer, after a fixed definite amount of time low priority requests will be read out of the buffer, even high priority requests arrived at the input.
Fig.3- Schematic of the PDDRA scheme
A complex network can be represented by a graph G=(X, E) where X={1,2,...,N} is the sets of nodes of G, and E={l1, l2, lm} is the sets of links or edges. The adjacency matrix
B
G
(
b
ij)
of G=(X, E) is defined by
1 if
i
,
j
E
b
ij
0 otherwise
(1)In general most of the network are directed are therefore degree is twofold: inward and outward. The inward degree is given by
n in
i ji
j 1 Similarly the outward degree is given by
(2)
n out
i ij
j 1
(3)
4.
Small World Model and Scale Free Networks
The model proposed by Watts and Strogatz [13] is known as small world model, where nodes in regular graphs are re- wired using probability. This generated graph is an intermediate graph between random and regular. Barabási and Albert (2016) [12] proposed a structure depends on two observed certainties in real networks: networks grow up continuously by the expansion of latest vertices, and these vertices join specially to destinations that are now all around associated. This is known as scale free network. Initially (t = 0), this model assume a small number of nodes and at every time step a new node may connect to a number of nodes of the existing graph. These new connections in existing node depends on probability which itself depends on the degree of that node, such that with higher degree have more chances to add links.
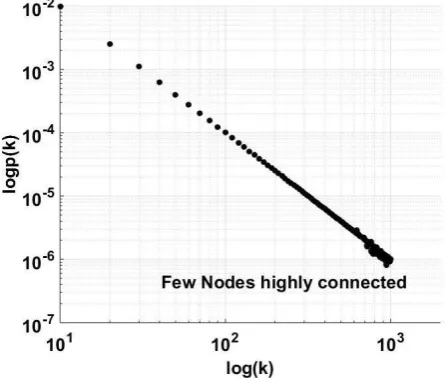
In numerous real world networks the degree obeyed is not Poisson (for example the internet), however rather follows a power law, i.e., P
k
ak where ‘a’ is a constant and the parameter γ represent a positive exponent. In the power law, a p(k) with decaying tail implies that by far most of nodes do not have high degree and that there are few nodes, termed as hubs, have high degree of connectivity. Normally, in scale-free networks new nodes like to connect with highly connected nodes in the system. At the point when there are limitations restricting the option of adding of new edges, such as maturing of the nodes or cost of including edges to the nodes or the constrained limit of a node, at that point the broadscale or single-scale systems emerges [11].As defined above, a normal estimate for the degree power-law exponent in a major portion of real networks is defined as 2 ≤ γ ≤ 3. In world wide web the outward degree distribution is given by [12]
p
k
ak
The inward degree distribution is given by [12]
2.38
2.72
, (4)p
k
ak
2.1
(5)The probability of degree distribution vs. degree is shown in figure. For clear visualization of results a log-log plot is drawn, in this plot degree is shown in x axis while on y-axis probability is shown.
Fig. 4- Scale free network, Power law distribution
It can be visualized from the figure that it is unlikely that nodes have large degree. The probability that a node has ‘1000’ degree is 10-6. Node degree of ‘10’ is also seldom as probability of occurrence is 0.01. Therefore, considering
small scale network model, it is very unlikely that a server connects to large number of nodes.
In real time applications it is observed that, the numbers of incoming links are more than outgoing links. The number of outgoing links also varies depending on different values of γ. Average degree is given by
k
1
k
kp
(
k
)
k
k
1 (6)
l 0
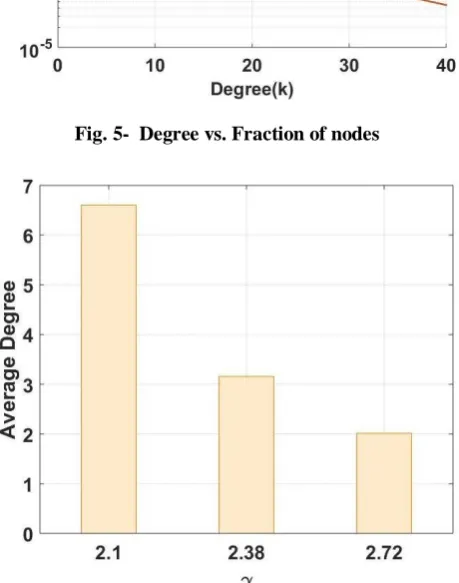
Fig. 5- Degree vs. Fraction of nodes
Fig. 6- Average degree vs. γ
In Fig. 5, fraction of nodes vs. degree is plotted for various values of γ. For γ=2.1, the average node degree is
6.6034 while for γ=2.38-2.72 the average node degrees are 3.1563 and 2.0141 respectively (Fig. 6). However, in general internet is small scale network with average distance of 4 with
is around 2.2 [13].5.
Load Balancing Modelling
The number of requests arriving on a particular server defines in terms of offered load ρ and number of inputs and outputs links (N) connects to that particular server. Using random assignment any of output links is chosen uniformly with probability 1/N for request acknowledgement. At an input of server more than one request can arrive simultaneously, considering N input lines to the server, than probability that ‘l’ requests arrive a input line is given by
N
!
l
N lP
(
l
)
l
!
N
l
!
N
1
N
(7)Therefore mean numbers of requests are given by N
N !
l
N lE[l]
leff ji ij ij ij ji ji ji
Graphically equation 7 is shown in Fig. 7, as the number of inputs increases, the probability decreases. However, with rise in load probability decreases. In the inset of Fig. 7, mean value vs. load is plotted, here again as the load increases the mean number of requests arriving at the server also increases.
Fig. 7- Request arriving probability vs. number of inputs under various loading conditions
Therefore as the load increases the number of request arriving also increases and contention among requests takes place. Contending requests are buffered till contention resolves, sometimes due to large number of arrivals of request buffer overflows, and request starts to drop. Therefore, for smooth operation of the servers load balancing needs to be deployed to servers. In the next section load balancing scheme is detailed using small world network model.
Load Balancing
The load on a particular node can be reduced by deflecting the some of the arriving packets. The number of packets arriving for a particular output can be expressed as
Now, ‘g’ is the fraction of requests that are deflected than effective load is N N ! l
N l
e
(1 g)l 1
(9)
l 0 l !
N l
! N N In core nodes once requests arrive then decision regarding deflection is performed, therefore above equation can be simplified to
e
(1
g
)
(10)Where, the value of ‘g’ depends on type of network. On a particular node ‘i’ the arriving load is the sum of the partial load arriving from various links (Fig. 10) and can be written as
Fig. 8- Schematic of hypothetical network m
ji , where0
1
andm
n
where m is the number of nodes directly connected to node i and n is j 1the total number of nodes in the network.
m m m
i
g
p
g
p
(11)j
k
g
g
where, gij and gji denotes the fraction of load which is being deflected for node ‘i’ to node(j) and vice versa. In addition to this other m nodes which are directly connected to node i can also deflect their data to node i. Therefore effective load under the assumption of small world network can be written as
eff
1
w
1
(12)i ji ij ij
j
11 ki kik
21k 1 where,
1
2.38-2.72 and
2
2.1. The load balancing is effective whenm
j 1
1
wk 1
1
g
ij
ijj 1
11
g
ki
ki 21
0
k 1
(13)
The load balancing is achieved when the condition in equation 13 is satisfied. This equation states that, on node ‘i’ the fraction of diverted load arriving should be lesser than the load diverted to other nodes. To achieve load balancing each node uses algorithm which depends on number of input/output links, state of buffer, current slot arriving traffic and priority of requests to divert traffic. In this work we have chosen fixed values of load balancing factors to simulate the results.
6.
Simulation and Results
In this work, the traffic arrival pattern is considered to be random, as detailed in section 5 of the paper. While considering priority, two types of priorities ‘High’ and ‘Low’ are considered and let QH, QL denotes the fraction of high
and low priorities request, therefore QH+QL=1. Considering that there are nH high priority request and nL are low
priority, or probabilistically
b
Pr(
(
Q
(
n
l)!
)
nH(
Q
)
nL
l
)
(14)nH ,nL H L
l
(
n
l!)
l Results
In this section, simulation results are plotted under various conditions in traffic and on the arriving requests. The results are generated considering load and request loss probability. Load is the fraction of traffic arrives on each input link per slot, while total load is the sum of traffic arriving on each node in a single time slot. The packet loss probability is the ratio of lost and generated requests.
Without load balancing and no priority
In Fig. 9, request loss probability vs. load is plotted. It is assume that at each server some fixed size storage is assumed for contenting requests.
Fig. 9- Request loss probability vs. load under different buffering conditions
For different storage, request loss probability is shown and it decreases with rise in storage. Considering that the desired request loss probability is less than 10-4, than for storage size of 4 the acceptable load is less than 0.4, while for
storage size of 8, the acceptable load is 0.63 and for storage of 16, the allowed load is 0.8. If load is higher than
m
acceptable limit, than load balancing scheme needs to be employed and additional loads will be deflected to rest of the connecting nodes.
With load balancing and no priority
In Fig. 10, on random traffic load balancing scheme is deployed while assuming number of input and output links as
4 with storage capacities of 4 and 8 requests. Using equation 13, we also defines gi
gij . The value of gi=0.2, it is j 1clear from the Fig. that load balancing scheme improves the request loss performance of the server, it is also noticeable that gi considered the all the nearest neighbour, therefore also improve the performance of the network in terms of load shared by each node. The notable values of requests loss is shown on the figure with marked pin values.
Without load balancing and with priority
In Fig. 11, request loss probability vs. load is plotted while considering priorities of requests but without load balancing. Here N and S both are taken to be 4, and both high and low priorities request are assumed in equal proportions. In the results a significant difference is observed in losses of high and low priorities requests. However, as the load limit of 0.6 is crossed a rise in request loss probability is observed. At the load of 0.7, the total request loss probability is of the order of 0.01. At the load of 0.6, the difference in request loss probability is more than 100 times between high and low priority requests.
Fig. 10- Request loss probability vs. load under different buffering conditions (load balancing)
With load balancing and priority
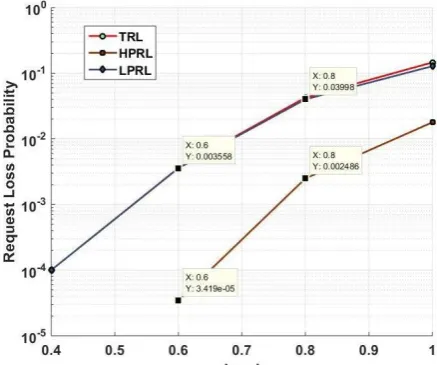
In Fig. 12, request loss probability vs. load is plotted while considering priorities of requests and load balancing.
Fig. 12- Request loss probability vs. load under different buffering conditions (with load balancing and priorities)
Here N and S both are taken to be 4, and both high and low priorities request are assumed in equal proportions. The load balancing factor gi is considered to be 0.2. Again in the results a significant difference is observed in losses of high and low priorities requests. However, as the load limit of 0.6 is crossed a rise in request loss probability is observed. At the load of 0.7, the total request loss probability is of the order of 0.001. At the load of 0.8, the improvement in request loss probability is more than 7 times as compared to without load balancing.
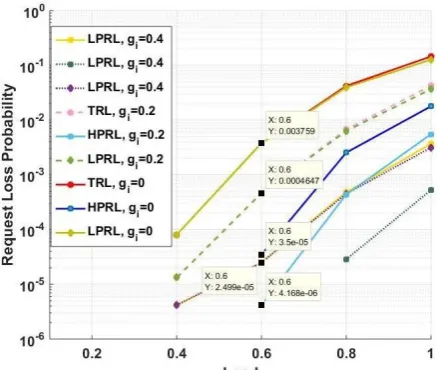
Fig. 13- Request loss probability vs. load under different buffering conditions (with and without load balancing and priorities)
In Fig. 13, results for request loss probability vs. load various conditions are plotted, here results are shown for with and without load balancing schemes. The load balancing factor gi is considered to be 0.2 and 0.4. The results are compared at the load 0.6 and obtained values are tagged in the figure. It is also notable that even at load of 1, significant difference in request loss probability is obtained. Thus the load balancing scheme is very helpful in reducing loads and in turn reduces request loss probability.
7.
Conclusions
improve the performance of earlier proposed PDDRA algorithm. For the performance evaluation of the proposed algorithm network is modelled as small world network, and using this model number of input/output links are fixed. Using small world model it is found that for most of the nodes in the networks degree of node is less than 10. Therefore, in the simulation we have considered 4 and 8 links. For important requests priorities is added, therefore in case of loss first low and than high priority request will be dropped. To reduce dropping of requests load balancing scheme is also employed and load balancing factor can be evaluated using small world model. Finally, results are compared under different types of conditions and it has been found that using load balancing significant reduction in request loss probability can be attained even at very high loads (>0.8).
References
[1] Kemme, Bettina, and Gustavo Alonso. Database replication: a tale of research across communities. Proceedings of the VLDB Endowment, Volume 3, (2010), pp.5-12.
[2] Amir Y, Danilov C, Miskin-Amir M, Stanton J, Tutu C. Practical wide-area database replication. Technical report, Johns Hopkins University, 2002.
[3] Chen Y, Berry D, Dantressangle P. Transaction-based grid database replication. In Proceedings UK e-Science All Hands Meeting (2007), pp. 166-173.
[4] Saadat N, Rahmani AM. PDDRA: A new pre-fetching based dynamic data replication algorithm in data grids. Future Generation Computer Systems. Volume 28, (2012), pp. 666-681.
[5] Yadav SK, Singh G, Yadav DS. Mathematical framework for a novel database replication algorithm. International Journal of Modern Education and Computer Science. Volume 5, (2013), p.1.
[6] Yadav SK, Singh G, Yadav DS. Analysis of database replication algorithm in local and global networks. International Journal of Computer Applications. Volume 84, (2013), p.1.
[7] Yadav SK, Singh G, Yadav DS. Throughput and delay analysis of database replication algorithm. International Journal of Modern Education and Computer Science. Volume 5, (2013), pp.47-53.
[8] Yadav SK, Singh G, Yadav DS. Analysis Of A Database Replication Algorithm Under Load Sharing In Networks. Journal of Engineering Science and Technology. Volume 11,( 2016), pp.193-211.
[9] Mishra RJ, Jain A. Performance of Data Replication Algorithm in Local and Global Networks under Different Buffering Conditions. International Journal of Intelligent Systems and Applications.Volume 7, (2015), pp.34-41. [10]Singh RN, Singh R. Database Replication Algorithm Performance in High Speed Networks Under Load
Balancing. International Journal of Applied Engineering Research. Volume 13, (2018), pp.3475-3482. [11]Chen D, Lü L, Shang MS, Zhang YC, Zhou T. Identifying influential nodes in complex networks. Physica a:
Statistical mechanics and its applications. Volume 15, (2012), pp. 1777-1787.
[12]Gao J, Barzel B, Barabási AL. Universal resilience patterns in complex networks. Nature. Volume 530, (2016), pp.307-312.