Education in Medicine Journal (ISSN 2180-1932) © www.saifulbahri.com/eimj | e6
ORIGINAL ARTICLE
Missing values in data analysis: Ignore or Impute?
Ng Chong Guan
1, Muhamad Saiful Bahri Yusoff
21
Department of Psychological Medicine, Faculty of Medicine, University Malaya 2
Medical Education Department, School of Medical Sciences, Universiti Sains Malaysia
Abstract
Objective: Missing values is commonly encountered in data analysis in all types of research. Various methods were introduced to handle this matter. This study aims to compare the result of using complete data analysis, missing indicator method, means substitution and single imputation in dealing with this issue.
Methods: 202 patients who were discharged from the psychiatric ward, University Malaya Medical Centre (UMMC) from 27th August 2007 to 15th April 2008 were recruited. The general psychopathology was measured with Brief Psychiatric Rating Scale (BPRS-24). The information on age, gender, race, marital status and psychiatric diagnosis were collected. On follow up, the patients who had early readmission (<6 months) were identified. A logistic regression model to determine early readmission based on all the variables was made. 10% (n=20) of the highest BPRS scores were deleted to simulate a missing at random (MAR) situation. Four different statistical methods were used to deal with the missing values.
Results: BPRS score was significantly associated with early readmission (p<0.01) in the original complete dataset. The associations based on complete data analysis, missing indicator method and mean substitution were biased and insignificant. Single imputation gave a closest significant estimate of the association (p<0.1).
Conclusion:
Ignoring missing values will result in biased estimate in data analysis. Single
imputation produced unbiased estimate of association in MAR situation.
Keywords: missing values, imputation, complete data analysis, indicator, mean
Introduction
A common issue encountered in data analysis is the presence of missing values in the dataset. It affects the precision and validity of the result estimation depending on the extent of the ‘missingness’ (1-4). Various methods were introduced to handle this matter (5-8). Prior to consider the options to deal with the missing values, it is crucial to know about the mechanism of missing. Generally, there are three types of missing values. (9, 10) When
Education in Medicine Journal (ISSN 2180-1932) © www.saifulbahri.com/eimj | e7
some people refused to disclose his/her past psychiatric history). MNAR could only be speculated but impossible to be determined (2, 9, 10).
The most common method used to deal with missing values is complete data analysis. Many researchers feel that missing values should not be ‘made up’, so analysis is confined to samples with complete dataset (7). Most statistical software by default uses this method where any subjects with missing values are excluded from the analysis.
Another traditional way to handle missing values is missing indicator method. A dummy variable is created as an indicator for the missing data. The missing indicator variable is then included in the model for analysis. The idea of this method is to use the full sample size in the analysis (11, 12).
Mean substitution is another method to deal with missing values. The missing values in a variable are replaced by the overall or subgroup means of the data from other observed subjects. As a result, the subjects with missing value will have same value replacing the missed data (5- 8).
A modern method introduced to handle missing values is single imputation. It uses the available data of all variables on other subjects to estimate the distribution of the variable with missing values. Based on the estimated distribution, a value is randomly chosen to replace the missing values. It assumed the estimated distribution based on the observed subjects is equal to the distribution of the study population. Thus, replacement from the estimated distribution is equal to as if drawing a subject randomly from the study population (1-3, 5, 6).
The aim of this study is to illustrate the result of using complete data analysis, missing indicator method, means substitution and single imputation in dealing with missing values in a MAR situation. The empirical sample used was extracted from a study on early readmission conducted in the psychiatric
ward, University Malaya Medical Centre (UMMC) in 2008.
Methodology Study sample
A series of 202 non duplicated, conservative patients who were discharged from the psychiatric ward, UMMC from 27th August 2007 to 15th April 2008 were included in the study. Prior to discharge, the general psychopathology of the patients was assessed using brief psychiatric rating scale (BPRS-24). The information on age, gender, marital status, race and psychiatric diagnosis were collected. On follow up, the patients who had early readmission (less than 6 months) were identified.
Study model
A logistic regression model is constructed using early readmission as dependent variable; BPRS score, gender, marital status, race and psychiatric diagnosis as independent variables (marital status was categorized as married and never married, race was categorized as Malay and Non-Malay, psychiatric diagnosis was categorized as psychotic disorder and non psychotic disorder). For the purpose of illustration, 10% (n=20) of the highest BPRS scores were deleted to simulate a MAR situation. The deleted (missing) values were then handled with four different statistical methods: complete data analysis, missing indicator method, means substitution and single imputation.
Brief psychiatric rating scale (BPRS-24)
Education in Medicine Journal (ISSN 2180-1932) © www.saifulbahri.com/eimj | e8
upon observation made by the clinician or rater during a 15 to 30 minutes interview (items which measure tension, emotional withdrawal, mannerisms and posturing, motor retardation and uncooperativeness), and subject verbal report (items which measure conceptual disorganization, unusual thought content, anxiety, guilt feeling, grandiosity, depressive mood, hostility, somatic concern, hallucinatory behavior, suspiciousness and blunted affect). Additional to the scale were eight additional items of suicidability, elated mood, bizarre behavior, self neglect, disorientation, excitement, distractibility, motor hyperactivity. Each item is defined by 1-2 sentences of clinical description. The scale points are not defined beyond not present, very mild and up to extremely severe.
Complete data analysis
In complete data analysis, subjects with missing values were excluded from the analysis. As a result, only 182 subjects were analysed in this method.
Missing indicator method
A dummy variable was created. It was coded “1” if the value in BPRS score was missing and “0” if otherwise. The original missing values in the BPRS score were recorded as “0”. The dummy variable was included in the final logistic regression analysis.
Mean substitution
The missing values in the BPRS score were replaced with the overall mean of the observed BPRS score on other subjects. Thus, all the subjects with missing value had same value for their BPRS score.
Single imputation
This method was applied by using the Missing Value Analysis function in SPSS. A regression prediction model for the BPRS score was fit with early readmission (outcome) and all other variables as predictors. (2) The prediction model was then used to estimate
the missing values of BPRS score based on the pattern of all the predictors in the same subject.
Results
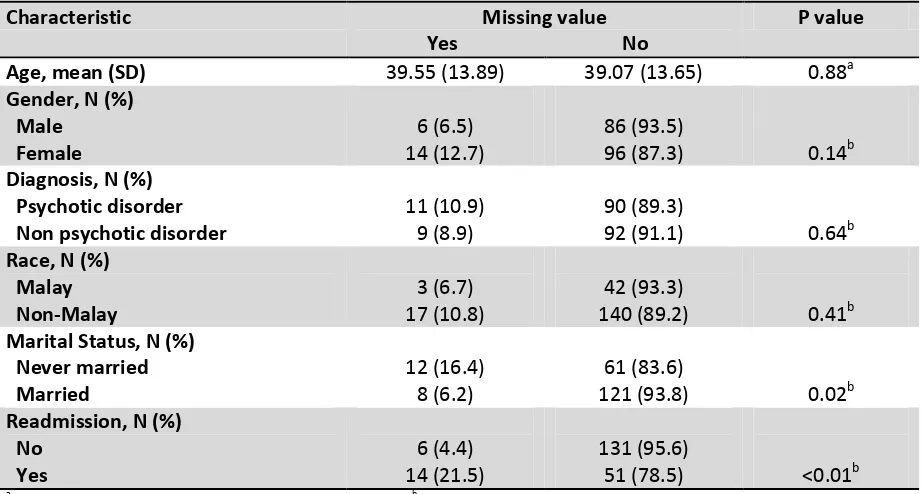
Approximately 202 participants participated in this study and their demographic profile was shown in table 1.
The distribution of subjects with missing values was associated with marital status and readmission at the alpha of 0.05. It was associated with gender at the alpha of 0.15 (table 1).
The association of BPRS score with early readmission was significant in the original complete dataset (reference). Single imputation was the only method that produced the significant association at the alpha of 0.1 (table 2).
Discussion
The purpose of this study is to illustrate the results of four statistical methods in dealing with missing values. It does not aim to develop a prediction model for early readmission. The variables used were extracted from a full dataset of a previous study. As a result, the performance of the model was relatively low in this study as represented by the low Nagelkerke R square values.
Education in Medicine Journal (ISSN 2180-1932) © www.saifulbahri.com/eimj | e9
with missing values were excluded in the complete data analysis, the association disappeared. The result in complete data analysis is biased as a smaller sample size is used and under-representative of the population (1, 4, 7, 8). In this case, subjects with high BPRS score were excluded in the analysis. This reduced the true effect of the association between BPRS score and early readmission.
Missing indicator method is a popular method in handling missing values (7, 12). The advantage of this method is that all subjects are used in the analysis. However, a meaningless dummy variable is included in the multivariable analysis. It can lead to biased result. The uncertainty in the missing values is still remained as they are only replaced by an arbitrary value. In this study, the missing values were replaced by ‘0’ and the association of BPRS score and early readmission were not able to be established. The performance (R2) was higher in missing indicator method as an extra variable (dummy variable) was included into the logistic regression analysis (1, 3-5, 20).
Another method used to deal with missing values is means substitution. The mean is a reasonable guess of the missing value as if it is drawn from a normal distribution. However, it is argued that subjects in the middle of a distribution are seldom missed in data collection. In contrast, missing values often occur in subjects with extreme values (7). As a result, replacing the missing values with an
overall mean will ‘dilute’ the true effect of a covariate (3, 6). In this case, the missed high BPRS scores were replaced with a lower mean score. It diminished the true association of BPRS score with early readmission and estimated a biased result.
In single imputation method, the estimated distribution of the variable with missing values is based on the observed data of the other subjects using multivariable approach. It assumed the estimated distribution is similar with the study population although it is not always true. However, the association studied with this method is unbiased (1-3, 5, 6). In this study, the association estimated with single imputation was closest to the reference estimate and significant at alpha 0.1. The limitation of single imputation is the underestimation of the standard error as the data set is analyzed as if all the data were observed. Thus, it might overestimate the precision of the association. This problem can be over-countered with multiple imputations which is not demonstrated in this study (1-3, 5, 9, 21, 22).
Conclusion
Education in Medicine Journal (ISSN 2180-1932) © www.saifulbahri.com/eimj | e10
Table 1: Distribution of subjects with missing values according to the characteristics of the samples.
Characteristic Missing value
Yes No
P value
Age, mean (SD) 39.55 (13.89) 39.07 (13.65) 0.88a
Gender, N (%) Male
Female
6 (6.5) 14 (12.7)
86 (93.5)
96 (87.3) 0.14b Diagnosis, N (%)
Psychotic disorder Non psychotic disorder
11 (10.9) 9 (8.9)
90 (89.3)
92 (91.1) 0.64b Race, N (%)
Malay Non-Malay
3 (6.7) 17 (10.8)
42 (93.3)
140 (89.2) 0.41b Marital Status, N (%)
Never married Married
12 (16.4) 8 (6.2)
61 (83.6)
121 (93.8) 0.02b Readmission, N (%)
No Yes
6 (4.4) 14 (21.5)
131 (95.6)
51 (78.5) <0.01b a Independent-t test, p < 0.05 was considered as significant. b Pearson Chi-square test, p < 0.05 was considered as significant.
Table 2: The association of BPRS score with early readmission estimated based on original complete dataset and four statistical methods in dealing with the missing values.
Method Beta SE P value R2
Reference 0.048 0.014 <0.001 0.119
Complete data analysis 0.029 0.020 0.147 0.039
Missing indicator method 0.029 0.020 0.146 0.123
Means substitution 0.027 0.019 0.158 0.045
Single imputation 0.032 0.018 0.073 0.053
Linear regression was apllied. SE=standard error
R2= Nagelkerke R square
References
1. Van der Heijdan G.J.M.G., Donders A.G.T., Stijnen T., Moons K.G.M. (2006). Imputation of missing values is superior to complete case analysis and the missing-indicator method in multivariable diagnostic research: A clinical example. J Clin Epidemiol, 59, 1102-1109.
2. Moons K.G.M., Donders R.A.R.T., Stijnen T., Harrell, Jr F.E. (2006). Using the
outcome for imputation of missing predictor values was preferred. J Clin Epidemiol, 59, 1092-1101.
3. Donders A.R.T., van der Heijden G.J.M.G., Stijnen T., Moons K.G.M. (2006). Review: a gentle introduction to imputation of missing values. J Clin Epidemiol,59, 1087-1091.
Education in Medicine Journal (ISSN 2180-1932) © www.saifulbahri.com/eimj | e11
D.E., Moons K.G.M., Geerlings M.I. (2010). Unpredictable bias when using the missing indicator method or complete case analysis for missing confounder values: an empirical example. J Clin Epidemiol, article in press.
5. Greenland S., Finkle W.D. (1995). A critical look at methods for handling missing covariates in epidemiologic regression analyses. Am J Epidemiol, 142, 1255-1264. 6. Little R.J. (1992). Regression with missing X’s: a review. J Am Stat Assoc, 87, 1227-1237.
7. Acock A.C. (2005). Working with missing values. J Marriage Fam, 67, 1012-1028. 8. Graham J.W. (2009). Missing data
analysis: making it work in the real world.
Annu Rev Psychol, 60,549-576.
9. Schaffer J.L., Graham J.W. (2002). Missing data: our view of the state of the art.
Psychol Methods, 7, 147-177.
10. Rubin D.B. (1976). Inference and missing data. Biometrika, 63, 581-592.
11. Miettinen O.S. (1983). Regression analysis. In: Theoretical epidemiology: principles of occurrence research in medicine. New York, NY: Academic Press. 12. Cohen J, Cohen P (1983). Applied multiple
regression/correlation analysis for the behavioural sciences (2nd ed.). Hillsdale, NJ: Erlbaum.
13. Overall J.E., Gorham D.R. (1962) The Brief Psychiatric Rating Scale (BPRS): A comprehensive review. J Operat Psychiatr, 11,48-65.
14. Overall J.E., Gorham D.R. (1976) The Brief Psychiatric Rating Scale, ECDEU
Assessment manual for
psychopharmacology, Guy W, ed, Rockville, MD: U. S. Department of Health, Education, and Welfare; 157-69. 15. Overall J.E., Gorham D.R. (1988). The Brief
Psychiatric Rating Scale (BPRS): Recent developments in ascertainment and scaling. Psychopharmacol Bull,24, 97-9. 16. Ventura M.A., Green M.F., Shaner A.,
Liberman R.P. (1993). Training and quality assurance with the brief psychiatric rating scale: “The drift buster”. Int J Meth Psych Res, 3, 221-244.
17. Laird N.M. (1988). Missing data in longitudinal studies. Stat Med, 7, 305-315.Meyer K, Windeler J. A new suggestion for the classification of missing values in the outcome of clinical trials. Clinin Res Regul Affairs 1998; 15: 17-24. 18. Meyer K., Windeler J. (1998). A new
suggestion for the classification of missing values in the outcome of clinical trials.
Clinin Res Regul Affairs, 15, 17-24.
19. Clark T.G., Altman D.G. (2003). Developing a prognostic model in the presence of missing data. An ovarian cancer case study. J Clin Epidemiol, 56, 28-37.
20. Jones M.P. (1996). Indicator and stratification methods for missing explanatory variables in multiple linear regression. J Am Stat Assoc, 91, 222-230. 21. Rubin D.B. (1996). Multiple imputation
after 18+ years. J Am Stat Assoc, 91, 473-489.
22. Rubin D.B., Schenker N. (1991). Multiple imputation in health-care database: an overview and some applications. Stat Med, 10, 585-598.
Corresponding Author: Dr Ng Chong Guan, Lecturer, Department of Psychological Medicine, Faculty of Medicine, University Malaya, Lembah Pantai, 50603 Kuala Lumpur, Malaysia.
Email: [email protected]