Available Online atwww.ijcsmc.com
International Journal of Computer Science and Mobile Computing
A Monthly Journal of Computer Science and Information Technology
ISSN 2320–088X
IMPACT FACTOR: 6.017
IJCSMC, Vol. 8, Issue. 3, March 2019, pg.172 – 180
Improvement of Authentication in
Smartphones Using Embedded
Pattern-Based Features
Omar Abdulsattar Mahmoud1; Dhahir Abdulhade Abdallah2; Ziyad Tariq Mustafa Al-Ta’i3
1,2,3
Dept. of Computer Science, College of Science, University of Diyala, Baquba, Iraq
1
[email protected]; [email protected]; 3 [email protected]
Abstract— Last years, smart devices with touch-sensitive screens are being widely used to access different services. These devices impose the need for storing more personal and sensitive information about the users, such as images, contacts, and videos. To protect this information, deferent techniques are proposed in order to authenticate the users into these devices. In this paper, we propose a method for strengthening the pattern-based authentication, depending on behavioral features extracted from a touch-sensitive screen of smartphones. The extracted features are based on time, movement direction, size and pressure of the users touch on the screen. The proposed technique is based on a deep neural network which classifies the users into a legitimate user or an intruder by comparing the behavioral features with the stored templates. The proposed method is tested on data which are collected from (31) persons. The total number of collected attempts in the dataset is (7,750). The deep neural network has a good performance, compared to other techniques: the random forest classifier and the support vector machine classifier. The empirical authentication results show that the proposed method has an equal error rate of (3.38%).
Keywords— Android, lock pattern, biometrics, Mobile authentication,smart mobile devices, Touch gestures.
I. INTRODUCTION
The rapid growth usage of smart devices in the recent years has increased the size of information being stored on these devices. Some of these information is private or confidential, such as banking information, and it is important to keep this information out of reach for anyone other than the legit user of the device[1]. To protect this information, smart devices are provided with authentication schemes, so that users need to authenticate into the devices in order to access any information stored on it. There are different schemes that are used for authentication, some of them depend on secrets entered by the users, while other techniques depend on biometric features of the legitimate users of the devices[2].
As the main aim of an authentication system is to verify the real identity of users to the identity they are claiming to be, biometric authentication systems rely on biometric features extracted from those users. Physiological biometric features are extracted from the physical characteristics of a certain part of the human body, such as the fingerprint and iris, while behavioral biometric features rely on the unique behavior of those users in executing a certain activity [3].
user into the device is more immune to such attacks [8]. However, the use of some of these authentication schemes is less favorable to be used by the users[8] and is also at risk of breach using some specific techniques[9]. Thus, to provide an authentication scheme that has high usability and security measure, it is important to join forces of both existing schemes, where the high usability of the secret-based schemes is joined with the high security of the biometric-based schemes.
The rest of this paper is constructed as: section two reviews the related work; section three describes the methodology behind the proposed method; section four shows the results of the proposed method; section five draws the conclusions of this work.
II. RELATED WORK
Many researchers have put a lot of effort to solve security issues in the authentication schemes of smartphones. Most of these efforts are targeted toward adding a biometric security layer to the existing less secure authentication methods, such as PIN and pattern authentications [10].
De Luca et. al. [11] suggested an authentication scheme that allows users to enter their passwords using both the front and back of their phones. This approach reduced the risk of shoulder surfing intruders, where an intruder peaking from one side cannot peak the other side of the smartphone. However, the most of the existing smartphones do not have a touch-sensitive back, and it is not cost-effective to add such feature to the phones for authentication purpose only [12]. Khamis et. al. [13] presented a smartphones’ authentication scheme based on the users’ gaze while inputting their PIN using a number pad, which has numbers distributed on two columns, to make the user’s gaze more recognizable. However, the proposed system had shown longer entry time than normal authentication schemes. Thus, the study suggested using this scheme only when smartphone’s users feel that they were being observed, or when accessing sensitive data on their smartphones. Moreover, the scheme had shown a significant drop in shoulder surfing attacks from 68 % to 10.4%. Another authentication scheme is proposed by Nguyen et. al. [14], which instead of entering the pin number by tapping on a number pad, the numbers are drawn on the screen, one by one. This approach relies on the different shapes that each person draws for the same PIN numbers, so that, even if an attacker is able to know the PIN of a device, it is still difficult to replicate the same handwritten digits of that number to authenticate into the device. The proposed scheme has scored an equal rate error (EER) of 4.48 %, which means that only 4.48 % of the attacks are able to access the phone, while the same ratio of legitimate attempts, by legitimate users, are blocked. Moreover, the study conducted by Nathan et. al. [15] shows that only 18.7 % of smartphone users rely on PIN authentication to access their smartphones, while 32.1 % of them do not use any authentication scheme. However, the study shows that most of the users, who actually use authentication to access their phones, rely on patterns, who represent 32.5 % of all users included in the study. Thus, it is more important to improve the security of pattern-based authentication, by adding another security layer, pattern-based on biometric features.
The study proposed by Antal et. al. [16] showed the ability to implemented an authentication scheme based on features extracted from the users’ touch behavior, such as the pressure, touch size, duration, velocity, and acceleration. Different classifiers are used with the collected data to classify each attempt into one or two classes. The best EER, measured for the different schemes tested in the study is scored by the Random Forests classifier, when 11 different features computed from the collected data are inputted to the classifier, and two output classes are outputted from the classifier. However, the Random Forests classifier uses multiple decision trees in order to classify each input tuple, based on different pieces of knowledge extracted per each tree, then, the dominant class at the output of these classifiers is selected as the predicted class. Thus, this procedure may be time and CPU consuming. Moreover, the data is collected for single horizontal movement, by sliding fingers on a horizontal line to either the left or right to answer a psychological questionnaire, which makes the implementation of that scheme questionable with the actual pattern authentications.
The scheme proposed by Angulo and Wästlund [17] extracts biometric features based on the finger movement while users are drawing their authentication patterns. These features are then used to identify the user of the device, which adds another layer of authentication to the pattern authentication. The extracted features are based on the time that the users keep their fingers in the circles that surround the dots of the pattern, and the time spent between two dots. The experiments of this study show that the use of Random Forests classifier could score a 10.39 % EER. However, the scheme is tested using only three patterns, where each pattern has same length consisting of six dots.
III.THEPROPOSEDSYSTEM
Fig. 1. The experimental scheme of the proposed system.
A. Data Collection
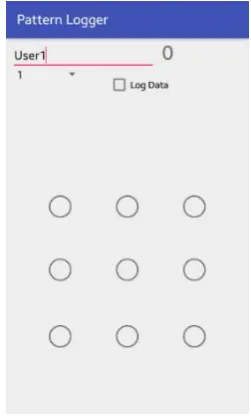
in order to collect data that can be used for this study, an Android application is built to simulate the default Android pattern lock and data are collected for five patterns. The data collected per each attempt are: the position of the touch, the pressure applied on the screen, the size of the touch area, the time that this information is collected, and the position of the dot hit by the user, if a dot is hit. The data which are collected covers (31) participants. The main interface of the application is shown in fig (2). The patterns selected in this study are chosen with different complexity, regarding the number of dots and the connections among them, as shown in figure (3).
B. Biometric Features Extraction
Biometric features are extracted from the collected data based on the connections that connect any two sequential dots in the pattern. The extracted features are based on time, movement direction, the size, and the pressure of the users touch on the screen. Per each connection between two dots in the pattern, the values of these features are calculated as follow:
Time feature is calculated by dividing the time required by the use to connect the two dots of the pattern by the total time consumed to complete the entire pattern. The division ensures the computation of relatively similar values, regardless of the speed of the use, so that, the value reflects the behavior of the user rather than the speed.
The direction feature is calculated by averaging every two consequent pixels captured during connecting the two dots in the pattern. As users may have different paths to connect the same two dots, calculating the average angle of the pixels the user has gone through creates a behavioral biometric feature that can be used to recognize the user.
The pressure-to-size feature is calculated by dividing the pressure applied on each pixel by the size covered on the touchscreen. Then, the average of these ratios is calculated as a biometric feature of the user. As increasing the pressure increases the size of the covered area, the resulting ratio is expected to maintain similar values per each user, which mainly relies on the characteristics of the user’s finger being used to draw the pattern.
C. Descriptor Generation
The used Android pattern consists of nine dots that can be connected to each other by the user’s choice to create a custom pattern. This distribution of dots implies that a user may create a maximum of eight connection among these nine dots, as each dot can be touched once. Thus, per each feature computed for the pattern, there is a maximum of eight features, as these features are computed per connection.
The descriptor of each pattern attempt consists of 24 values divided into three groups of eights. The first group contains the values computed for the time feature, while the second group contains the values computed for the movement direction features, and the third group contains the values computed for the pressure-to-size feature. When a pattern has less than eight connections, the empty fields are filled with the value minus one to indicate that this is an empty value to avoid any confusion.
D. Template Generation
Most of the authentication techniques that rely on biometric features, such as fingerprints, generates a template using more than one attempt, to ensure the extraction of rigid features instead of one attempt, which could be noisy and may lock the users out of their devices. Moreover, most of the biometrics-based authentication techniques also use many attempts, so that, the effect of noise is reduced or eliminated. Following this standard, the proposed method also computed the template based on three inputs from the user, where the pattern is drawn three consequent times.
The template is computed using the descriptors created for the first three attempts on the pattern by selecting the median value for each feature in the 24-feature descriptor. This approach shows the ability of medians of eliminating extreme noise, unlike using the average where extreme noise still has a significant effect on the generated template. This template is stored for the created patterns, where all future attempts are compared against this template descriptor in order to authenticate the user.
E. Users authentication
In order to authenticate a user, the descriptor generated for the pattern unlock attempt is compared to the template descriptor stored when the pattern is created. Two approaches are tested for authentication, the first approach computed the Euclidean distance between features in the attempt descriptor and those in the template descriptor and feeds these distances to a classifier, while the other approach feeds both descriptors, for attempt and template, to a deep learning neural network in order to compute the matching factor.
In the first approach, three Euclidean distances are computed using the attempt and template descriptors, one per each biometric feature, which are the time, direction and pressure-size features. The Euclidean distance (d), between two points, p, and q, in an n-dimensional space is computed using (1).
( ) √∑ ( ) (1)
classifiers by the smaller distances caused by the less numbers of dots in the created pattern, than closer matches, the computed distances are amplified by multiplying them by eight divided by the number of connections in the created pattern. These three distances are then fed to a classifier, in order to predict the authenticity of the user.
In the second approach, and according to the ability of Artificial Neural Networks (ANN) to consider the relativity between the input values, the descriptors are fed directly to the ANN instead of the Euclidean distance. Such ability does not exist in the random forest and Support Vector Machine Classifiers, which imposes the need to calculate the Euclidean distance prior to the classification process.
F. Classification
Two classifiers are tested in this study, the Random Forest (RF) and the Support Vector Machine (SVM) classifiers. The Random Forest classifier implemented for this purpose consist of 500 trees. By using regressive classification, each prediction represents the percentage of a tuple to be a legitimate attempt. Then, by modifying the threshold that splits the intrusions from legitimate attempts, the sensitivity of the proposed method is adjusted. Per each attempt, the Euclidean distance between the descriptor created for the attempt and the template descriptor is calculated to create three values, one per each feature. Then, the classifier is used to predict the authenticity of the user, based on these values. If the predicted authenticity of the user is greater than the defined threshold value, the user is allowed access to the device, otherwise, access is denied, as shown in fig (4).
Fig.4. Classify Euclidean distances between current attempt and legitimate Template using RF & SVM.
G. Deep learning matching
Fig.5. Matching unlock attempts with the legitimate template using a deep neural network
IV.RESULTS AND DISCUSSION
The data are collected from 31 persons (N=50) per each of the five patterns selected for the experiments. These data are collected using Galaxy Tab 3 Lite with Dual Core processor running at 1.2GHz that uses Android™ Jelly Bean operating system and a touch-sensitive screen of 7 inches. The total number of attempts collected in the dataset is 7,750. The users are requested to start logging data, by pressing LogData button in application interface, after they become familiar with the pattern, so that, the logged inputs are similar to patterns set up by the users. For matching evaluation purposes, each attempt per each user is compared to other attempts by the same user, as well as attempts from other users using the same pattern. If both attempts belong to the same user, they are considered a match, while attempts from other users should be predicted as intrusions.
For accurate evaluation of the proposed methods, the attempts of six out of the thirty-one users in the collected data are excluded from the training dataset. This approach is adopted in order to simulate the use of the proposed method in real-life applications, where the users that are going to use these applications are unknown to the classifiers. The experiments are conducted using Python programming language, using the SciKit Learn library [18] for the Support Vector Machine and Random Forests classifiers, and the Keras library [19], which is built on top of Google’s TensorFlow library [20] for Neural Networks. The computer used for the experiments runs on Windows© 10 with 16 GB of random-access memory and an Intel® Core™ i7-7700HQ running at 2.80GHz and a GPU of 4GB.
The random forest classifier is implemented to provide regressive classification, which represents the probability that the input to be legitimate attempt. The EER is computed as in fig (6), where the threshold value to accomplish EER is 0.1388, so that, values less than the threshold are considered as intrusions attempts. The accuracy at that threshold is 53.08% with 46.92% EER.
Fig. 6. FAR and FRR Versus Threshold in RF Classifier.
Fig.7. FAR and FRR versus threshold in SVM classifier
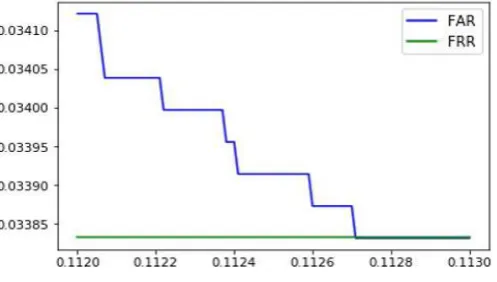
Moreover, the deep learning model is also implemented to provide predictions of the probability that an attempt is legitimate or not, where the output represents the probability of being legitimate. The overall accuracy of 96.62% is achieved using a threshold of 0.11271, which is selected based on Fig (8) to produce an equal error rate for both false accept rate and false rejection rate of only 3.38%.
Fig. 8. FAR and FRR versus threshold in in DL classifier.
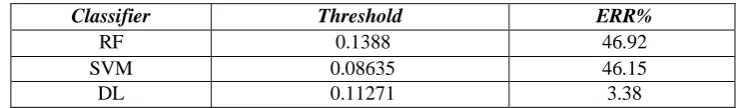
TABLE I
SUMMARY OF THE EXPERIMENTAL RESULTS
The deep neural network classifier has shown good performance, compared to the other techniques tested in this study. The EER of 3.38% illustrates that only 3.38% of intrusion attempts may authenticate into the device, while only the same percentage of legitimate attempts are denied access to the device.
V. CONCLUSION
As the Pattern-based authentication scheme on mobile devices is the widest used authentication scheme, and according to the benefits of using biometric features for authentication, this study proposes a method to use biometric features of the pattern authentication scheme. The proposed method collects behavioral biometric features, based on the way the user inputs the pattern, in order to predict the state of the attempt, an intrusion or a legitimate attempt. Two classification methods, based on random forest and support vector machine classifiers, are used to classify each attempt in order to make the appropriate decision, while a deep learning neural network is used to match the data collected from the current input with the template created for the legitimate user, in order to authenticate the user. The methods are evaluated by calculating the equal error rate of the authentication decisions, where the random forest classifier has been able to score an EER of 46.92% and the SVM classifier has scored 46.15 %, while the deep learning matching technique has been able to score an EER of 3.38 %. The results show that the use of the deep learning model for the purpose of embedding biometric features in pattern authentication is more suitable than the other evaluated techniques. Moreover, the use of matching method is more appropriate for such application, so that, the user of any device can be authenticated by creating a template upon setting up the authentication. The results also show that the proposed method has better performance than methods proposed in earlier studies, such as the method proposed by Angulo and Wästlund [17] which achieved an EER of 10.39 % with thirty-two participant (N=40). In future work, the use of other matching techniques, such as Dynamic Time warping, is evaluated to measure the similarity between the input pattern and the template pattern stored for the legitimate user.
R
EFERENCES
[1] N. Ab Rahman, G. Kessler, and K.-K. Choo, "Implications of Emerging Technologies to Incident Handling and Digital Forensic Strategies: A Routine Activity Theory," in Contemporary Digital Forensic Investigations of Cloud and Mobile Applications, ed: Elsevier, 2017, pp. 131-146.
[2] C. Bhagavatula, B. Ur, K. Iacovino, S. M. Kywe, L. F. Cranor, and M. Savvides, "Biometric authentication on iphone and android: Usability, perceptions, and influences on adoption," Proc. USEC, pp. 1-2, 2015.
[3] Z. T. M. Al-Ta'l and O. Y. Abdulhameed, "Features extraction of fingerprints using firefly algorithm," in Proceedings of the 6th International Conference on Security of Information and Networks, 2013, pp. 392-395.
[4] Y. Meng, D. S. Wong, and R. Schlegel, "Touch gestures based biometric authentication scheme for touchscreen mobile phones," in International Conference on Information Security and Cryptology, 2012, pp. 331-350.
[5] P. Andriotis, T. Tryfonas, and G. Oikonomou, "Complexity metrics and user strength perceptions of the pattern-lock graphical authentication method," in International Conference on Human Aspects of Information Security, Privacy, and Trust, 2014, pp. 115-126.
[6] S. Uellenbeck, M. Dürmuth, C. Wolf, and T. Holz, "Quantifying the security of graphical passwords: the case of android unlock patterns," in Proceedings of the 2013 ACM SIGSAC conference on Computer & communications security, 2013, pp. 161-172.
[7] S. Sayed, A. Mohid, M. Pal, and M. Haji, "Graphical Password based authentication system with sound sequence," International Journal of Computer Applications, vol. 138, 2016.
[8] A. De Luca, A. Hang, E. Von Zezschwitz, and H. Hussmann, "I feel like I'm taking selfies all day!: towards understanding biometric authentication on smartphones," in Proceedings of the 33rd Annual ACM Conference on Human Factors in Computing Systems, 2015, pp. 1411-1414.
Classifier Threshold ERR%
RF 0.1388 46.92
SVM 0.08635 46.15
[9] L. Coventry, A. De Angeli, and G. Johnson, "Usability and biometric verification at the ATM interface," in Proceedings of the SIGCHI conference on Human factors in computing systems, 2003, pp. 153-160.
[10] M. Harbach, A. De Luca, and S. Egelman, "The anatomy of smartphone unlocking: A field study of android lock screens," in Proceedings of the 2016 CHI Conference on Human Factors in Computing Systems, 2016, pp. 4806-4817.
[11] A. De Luca, E. Von Zezschwitz, N. D. H. Nguyen, M.-E. Maurer, E. Rubegni, M. P. Scipioni, et al., "Back-of-device authentication on smartphones," in Proceedings of the SIGCHI Conference on Human Factors in Computing Systems, 2013, pp. 2389-2398.
[12] K. Krombholz, T. Hupperich, and T. Holz, "Use the force: Evaluating force-sensitive authentication for mobile devices," in Twelfth Symposium on Usable Privacy and Security (SOUPS 2016), 2016, pp. 207-219.
[13] M. Khamis, M. Hassib, E. v. Zezschwitz, A. Bulling, and F. Alt, "GazeTouchPIN: protecting sensitive data on mobile devices using secure multimodal authentication," in Proceedings of the 19th ACM International Conference on Multimodal Interaction, 2017, pp. 446-450.
[14] T. Van Nguyen, N. Sae-Bae, and N. Memon, "DRAW-A-PIN: Authentication using finger-drawn PIN on touch devices," Computers & Security, vol. 66, pp. 115-128, 2017.
[15] N. Malkin, M. Harbach, A. De Luca, and S. Egelman, "THE ANATOMY OF SMARTPHONE UNLOCKING: Why and How Android Users Around the World Lock their Phones," GetMobile: Mobile Computing and Communications, vol. 20, pp. 42-46, 2017.
[16] M. Antal and L. Z. Szabó, "Biometric authentication based on touchscreen swipe patterns," Procedia Technology, vol. 22, pp. 862-869, 2016.
[17] J. Angulo and E. Wästlund, "Exploring touch-screen biometrics for user identification on smart phones," in IFIP PrimeLife International Summer School on Privacy and Identity Management for Life, 2011, pp. 130-143.
[18] F. Pedregosa, G. Varoquaux, A. Gramfort, V. Michel, B. Thirion, O. Grisel, et al., "Scikit-learn: Machine learning in Python," Journal of machine learning research, vol. 12, pp. 2825-2830, 2011. [19] F. Chollet, "Keras deep learning library for python. convnets, recurrent neural networks, and more.
runs on theano and tensorflow," GitHub repository, 2013.