Smart Grids and Load Profiles in the GCC Region
İslam
Şafak Bayram
121Qatar Environment and Energy Research Institute, Hamad Bin Khalifa University, Education City, Doha, Qatar 2College of Science and Engineering, Hamad Bin Khalifa University, Education City, Doha, Qatar
Abstract
The members of the Gulf Cooperation Council (GCC), namely Qatar, Bahrain, Saudi Arabia, Kuwait, Oman, and United Arab Emirates (UAE), are facing challenges to meet the growing electricity demand and reduce the associated hydrocarbon emissions. Recently, there has been a pressing need for a shift towards smart power grids, as smart grids can reduce the stress on the grid, defer the investments for upgrades, improve the power system efficiency, and reduce emissions. Accordingly, the goal of this paper is to delineate an overview of current smart grid efforts in the GCC region. First, we present a detailed overview of the current state of the power grids. Then, we classify the efforts into three broad categories: (i) energy trading and exchange through GCC interconnection; (ii) integration of renewable resources; and (iii) demand side management technologies for shaping the demand profile. Furthermore, we provide the details of our API object level real-time GCC power demand automated program that creates the database for the load profiles of the GCC members. Accessing such information for research and development purposes is a critical step in the region, because due the conservative structure of the governing institutes, there is no publicly available dataset. Therefore, the data provided in this paper is critical and will serve as a main reference for the future research efforts.
Receivedon 14 November 2016;acceptedon 07 September 2017;publishedon 19 December 2017 Keywords: Smart Grids, GCC Region, Load Profiles
Copyright© 2017 IslamSafakBayram,licensedto EAI.Thisisanopenaccessarticledistributedunderthetermsofthe Creative Commons Attribution license (http://creativecommons.org/licenses/by/3.0/), which permits unlimited use,distributionandreproductioninanymediumsolongastheoriginalworkisproperlycited.
doi:10.4108/eai.19-12-2017.153476
1. Introduction
Over the last few years, the fast-growing energy needs in the GCC region has intensified a central challenge: how to reduce the cost power systems operations and minimize the hydrocarbon emissions. As the significant portion of the GCC economies relies on oil and gas reserves, the GCC governments show growing amount of interest to diversify their economies for the post-carbon era. Moreover, the drastically decreasing oil prices have pressed the need for investigation of smart grid technologies and efficient usage of resources. Overall, there are three primary group of interest: (1) energy exchange among neighboring states to improve power system stability; (2) integration of renewable resources to reduce carbon emissions; and (3) demand response programs to shape the load profile and lessen the cost of system operations. One essential element of such efforts is the GCC Interconnection Grid that connects the power systems of six member countries.
∗
Corresponding author. Email:[email protected]
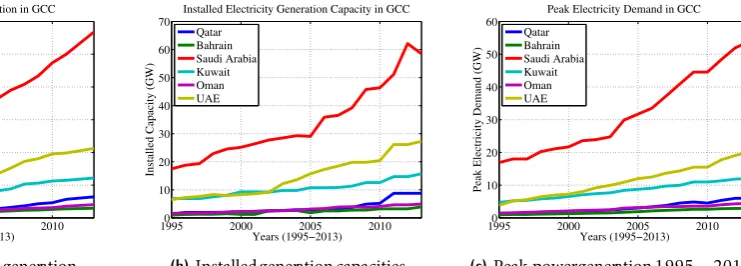
The integration is expected to transform the region into a significant energy hub, and the network is envisioned to expand to other parts of the world, e.g., sell electricity to North African Countries and Southern Europe. The six GCC members are endowed with a significant portion of the world’s hydrocarbon resources: 33.9% of the proven crude oil and 22.3% of the proven natural gas resources reside in the region. Owning such rich and abundant resources have boosted the economies and transformed the region within a mere of two decades into the world’s wealthiest nations (in term of GDP per capita as depicted in Figure 1a). In addition to the economic boom, high fertility rates, increasing population of expats, and the desire for a better standard of living have lead to a steady rise in electricity demand. The population growth respect to year 1995 is shown in Figure 1b. The results show that the population of Qatar is almost tripled within the last two decades and there are similar patterns in the other nations. Moreover, the trajectory depicted in Figure2ashows the enormous energy demand in each country. Moreover, gross domestic product per capita
1
Smart Cities
Research Article
19950 2000 2005 2010 20
40 60 80 100 120
Years (1995−2013)
GDP Per Capita (in 1000 USD)
Real GDP per capita in the GCC Region Qatar
Bahrain Saudi Arabia Kuwait Oman UAE USA UK
(a) Gross domestic product growth over the years.
19950 2000 2005 2010
50 100 150 200 250 300
Years (1995−2013)
Population (%) Respect to 1995
Population Growth of GCC Members
Qatar Bahrain Saudi Arabia Kuwait Oman UAE
(b)Populationgrowthoverthe years.
19950 2000 2005 2010
10 20 30 40 50 60 70
Years (1995−2010)
CO2 per capita emissions (metric tonnes)
CO2 per capita Emissions in the GCC Region
Qatar Bahrain Saudi Arabia Kuwait Oman UAE USA UK
(c)Carbonemissions 1995-2010 [22].
Figure 1. Key indicatorsfor energy consumption.
19950 2000 2005 2010
50 100 150 200 250 300
Years (1995−2013)
Electrical Energy (TWh)
Electrical Energy Generation in GCC
Qatar Bahrain Saudi Arabia Kuwait Oman UAE
(a)Aggregatedenergy generation.
19950 2000 2005 2010
10 20 30 40 50 60 70
Years (1995−2013)
Installed Capacity (GW)
Installed Electricity Generation Capacity in GCC
Qatar Bahrain Saudi Arabia Kuwait Oman UAE
(b)Installedgeneration capacities.
19950 2000 2005 2010
10 20 30 40 50 60
Years (1995−2013)
Peak Electricity Demand (GW)
Peak Electricity Demand in GCC
Qatar Bahrain Saudi Arabia Kuwait Oman UAE
(c)Peak powergeneration1995−2013.
Figure 2. Increasingenergy demandin the GCC
is an important determinant of energy usage. The GDP growth, not only increase the energy demand, but also rendered the region among the most carbon-intensive countries in the world. According to 2010 World Bank data, Qatar, Kuwait, Oman, and UAE are the top four nations with the highest emissions per capita [22] and an overview of carbon emissions is depicted in Figure1c. Another primary driver behind the rise in energy con-sumption is that GCC governments provide substantial subsidies both in electricity and oil tariffs. This policy serves as a means to redistribute the wealth among the citizens. However, reduced tariffs have lead to several adverse impacts. First, low prices translated into over-consumption of energy resources. The majority of the residential energy is consumed for air-conditioning and potable water, the bulk of which comes from energy-intensive desalination of sea water. Second, the GCC governments are facing a fiscal pressure as the volatility in the international markets combined with the fore-gone export revenues due to over-consumption fuels represent a sizable portion of the national budgets [10]. Third, the increasing levels of carbon emissions due to high consumption raises economic concerns.
The aforementioned issues have pressed the GCC members to reform the power systems through smart
grids. In order to provide the motivation for smart grids, in Section2 we give an overview of the current power grids. Then, in the next three sections we present a systematic the overview of GCC interconnection grid, renewable energy integration efforts, and current demand side management programs in the region.
2. Current Power Grid Operations
2.1. Overview
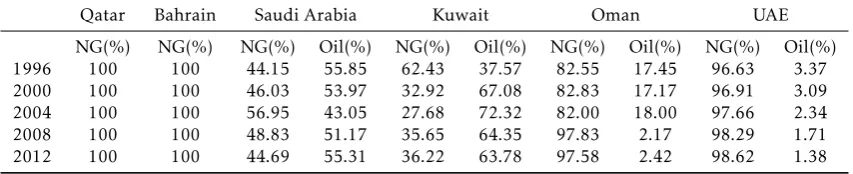
Table 1. Percentage of generation mixin the GCC. Natural Gas (NG)and Oil are considered.
Qatar Bahrain Saudi Arabia Kuwait Oman UAE
NG(%) NG(%) NG(%) Oil(%) NG(%) Oil(%) NG(%) Oil(%) NG(%) Oil(%) 1996 100 100 44.15 55.85 62.43 37.57 82.55 17.45 96.63 3.37 2000 100 100 46.03 53.97 32.92 67.08 82.83 17.17 96.91 3.09 2004 100 100 56.95 43.05 27.68 72.32 82.00 18.00 97.66 2.34
2008 100 100 48.83 51.17 35.65 64.35 97.83 2.17 98.29 1.71
2012 100 100 44.69 55.31 36.22 63.78 97.58 2.42 98.62 1.38
Even though the region was served by vertically integrated utilities, typically owned by the govern-ments, the GCC members are reforming the sector by unbundling the power generation, transmission, and the distribution segments. This will encourage private sector investments, which will allow the private sector to generate and sell electricity to the customers [6]. The primary drivers of this transformation are the need for improved operational efficiency and the fact that the private sector can quickly respond to economic and technological changes. The Sultanate of Oman is lead-ing the privatization process. Oman is the first member country that allows independent system operators to generate and sell electricity to government authority, which handles transmission and distribution lines. Cur-rently, in all members except Kuwait, the generation sector is operated by private sector and independent power producers. In Kuwait, the generation side is still operated by the government.
The electricity dispatch curve is also an important parameter for the smart grid operations. Since, the oil and natural gas reserves are abundant in the region, the power generation depends entirely on these two sources. In Table1, we present the generation mixture of the member countries over the years. The table reveals an interesting fact that the cost of producing electricity is quite different among the members. For instance, Qatar and Bahrain have plenty of natural gas resources, hence hundred percent of the electricity is generated by fossil fuels. However, relying entirely on natural gas reduces the ramping capabilities of the generation, therefore, these countries have to waste a sizable portion of their resources on not necessary lighting of skyscrapers. On the other hand, countries like Saudi Arabia and Kuwait produce a significant portion of the electricity through diesel generators. Considering the cost and negative environmental impacts of such generators, the interconnection of power grids would provide a good level of savings. For instance, Kuwait and Saudi Arabia could purchase electricity from Qatar and eliminate the need for running diesel generators. Moreover, the GCC members are seeking ways to accommodate the growing demand in through diversifying their generation portfolio. United Arabic Emirates is building nuclear power
plants to be operated by 2017 [23] in order to meet the 7% annual demand growth. According to Dubai Integrated Energy Strategy 2030, the utility of Dubai is aiming to meet 71% of the demand from natural gas, 12% from nuclear power, 12% from clean coal, and 5% from renewables. Also, Qatar, Saudi Arabia, and UAE have put goals to integrate gigawatt level solar farms. The details will be given in the next section.
2.2. Pricing& CustomerTypes
The electricity tariffs are the primary control mecha-nisms to shape the customer demand profile. In the business of electric utilities, the unit electricity cost is calculated through locational marginal prices (LMP) that takes into account various factors such as generator type and cost, distances to load, etc. LMP reflects the marginal cost of supplying an increment of load at each node. LMP are determined in the wholesale market via a bidding structure and details can be found in [12].
The pricing in the GCC region, however, is lower than the marginal prices as the governments provide subsidies to redistribute the wealth to the citizens. For instance, according to [10] the total subsidies in 2011 for electricity exceeded 29 billion Dollars in the GCC region. By considering the populations across the nations, the yearly subsidy per capita can be found as 556.5, 1510.1, 166.9, 1206, 522.28, and 770.81 US Dollars for Bahrain, Kuwait, Oman, Qatar, Saudi Arabia, and UAE, respectively. The current electricity prices are publicly available on the utility of each country, and we present an overview of the prices in Figure3. In the case of Saudi Arabia, for example, the electricity cost is one-fifth of the average US prices. Also, in the State of Qatar, the power consumption of the local citizens are entirely subsidized by the government. In 2013 the subsidies for the energy (oil, gas, and electricity) accounted for 60−80% of
the original cost. However, the decreasing oil prices in the last two years forced policy-makers to take drastic measures. For instance, UAE removed the subsidies in transport fuel in late 2015 and other GCC members are expected to follow this new policy and introduce taxes. Subsidized energy can, however, lead to a range of unintended adverse impacts, as
3 EAI Endorsed Transactions Smart Citieson
0 2 4 6 0.01
0.02 0.03 0.04
Energy Demand (MWh)
Electricity Price ($/kWh)
Electricity Tariffs in Qatar
Residential Commercial Industrial
0 2 4 6
0 0.02 0.04 0.06
Energy Demand (MWh)
Electricity Price ($/kWh)
Electricity Tariffs in Bahrain
Residential Commercial Industrial
0 2 4 6
0.01 0.02 0.03 0.04
Energy Demand (MWh)
Electricity Price ($/kWh)
Electricity Tariffs in Saudi Arabia Residential/Commercial Industrial
0 2 4 6
0.03 0.04 0.05 0.06
Energy Demand (MWh)
Electricity Price ($/kWh)
Electricity Tariffs in Kuwait
Residential/Commercial Industrial
0 2 4 6
0 0.2 0.4 0.6 0.8
Energy Demand (MWh)
Electricity Price ($/kWh)
Electricity Tariffs in Oman
Residential Industrial−Summer Industrial−Winter
0 2 4 6
0.075 0.08 0.085 0.09 0.095 0.1
Energy Demand (MWh)
Electricity Price ($/kWh)
Electricity Tariffs in UAE
Residential/Commercial Industrial
Figure 3. Electricity tari˙s obtainedfromQatar [15], Bahrain[16]. Saudi Arabia [17], Kuwait[18], Oman[20], UAE [19].
Weight of Subsidies On Fiscal Balances
% of GDP % of Fiscal Expenditures
Bahrain KSA UAE Qatar Kuwait Oman
Source: International Monetary Fund 5
10 15
Get the data Created with Datawrapper
Figure 4. The e˙ects of energy subsidies on fisca balances in
year2015.
it distorts price signals for consumers, with serious consequences for energy efficiency and the optimal allocation of resources. Low tariffs have lead to over-consumption of energy resources. The majority of the residential energy is consumed for air-conditioning and potable water, the bulk of which comes from energy-intensive desalination of sea water. Moreover, the GCC governments are facing a fiscal pressure as the volatility in the international markets combined with the opportunity cost incurred of exporting over-consumption fuels represent a sizable portion of the national budgets [10]. Figure 4 depicts that subsidies in the energy sector have started to represented sizable portion of the fiscal balances.
Traditionally electric utilities serve three different customer types namely, residential, commercial, and industrial. The customer types are differentiated by the amount of energy/power requirements and demand curves. At each member country, residential customers constitute the vast majority of the meters and we provide This is mainly because the industry is limited to oil and gas and severe weather and limited water resources restrict the agricultural activities. Unlike industrial and commercial customers, the energy demand of residential customers has high variability. This behavior increases the power system operating cost and reduce system utilization. Hence, this state of affairs contain an enormous potential for demand response programs for peak shaving.
2.3. Qatar PowerGrid
The national grid in Qatar is operated by the Qatar General Electricity and Water Corporation (Kahramaa) since year 2000. Kahramaa manages more than 12000 substations, 2700 km transmission lines and 2000 overhead lines. The rating of the transmission and distribution network is 400/220/132/66/11 kV.
Over the last decade, Kahramaa has taken bold actions to upgrade the transmission and the generation components to provide a quality performance to its customers. From the generation sector standpoint, even though the peak demand has been steadily increasing, e.g., from 5 GW in 2010 to 7 GW in 2015, the spare capacity is still in the order of 2−3 GW. Moreover,
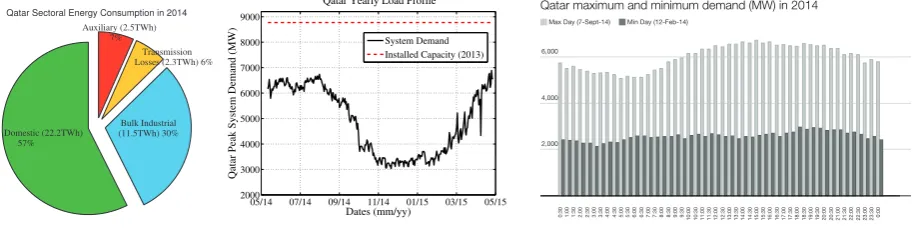
Domestic (22.2TWh) 57%
Bulk Industrial (11.5TWh) 30%
Transmission Losses (2.3TWh) 6% Auxiliary (2.5TWh)
7%
Qatar Sectoral Energy Consumption in 2014
(a)Energyconsumptionby sector in Qatar (2014).
05/14 07/14 09/14 11/14 01/15 03/15 05/15 2000 3000 4000 5000 6000 7000 8000 9000 Dates (mm/yy)
Qatar Peak System Demand (MW)
Qatar Yearly Load Profile
System Demand Installed Capacity (2013)
(b)Qatar demandprofil in year 2014.
Qatar maximum and minimum demand (MW) in 2014
Max Day (7-Sept-14) Min Day (12-Feb-14)
0:301:001:302:002:303:003:304:00 4:305:005:306:006:307:007:308:008:309:009:3010:00 10:3011:0011:3012:0012:3013:0013:3014:0014:3015:0015:3016:00 16:3017:0017:3018:0018:3019:0019:3020:0020:3021:0021:3022:00 22:3023:0023:300:00 2,000
4,000 6,000
Get the data Created with Datawrapper
(c)Qatar hourlyload profile formaxand minusage days in 2012.
Figure 5. Increasingenergy demandin the GCC
Maximum and Minimum System Load in Qatar
Max Min
2010 2011 2012 2013 2014
Kahramaa Statistics Report 2014 2,000
4,000 6,000
(a)Maximumandminimumenergyconsumptionin Qatar.
Qatar Energy Consumption in 2014 (MWh)
Month 2,056 January 1,882 February 2,411 March 2,901 April 3,685 May 3,928 June 4,419 July 4,431 August 4,179 September 3,783 October 2,725 November 2,287 December
Kahramaa Statistics Report 2014
1,000 2,000 3,000 4,000
(b)Qatar energy consumptionper monthin year 2014.
Qatar Key Statistics 2014
System Domestic Industrial
Demand Growth (%) from 2013
Load Factor (%)
20 40 60 80
(c)Demandgrowthand load factor.
Figure 6. Statistics of Qatari NationalGridin2014
Bahrain electricity consumption per sector (MWh)
Source: Kingdom of Bahrain Central Informatics Organization 113
2,000 4,000 6,426
2002 ’04 ’06 ’08 ’10 2012
Domestic Commercial Industrial
(a)Energy consumptionby sector in Bahrain.
Bahrain energy consumption in 2013 (MWh)
745 January 688 February 859 March 1,102 April 1,396 May 1,533 June 1,786 July 1,784 August 1,688 September 1,295 October 990 November 836 December 500 1,000 1,500
(b)Electricityconsumptionper monthin Bahrain.
Bahrain peak load in 2012 (MWh)
1,360 January 1,492 February 1,786 March 2,193 April 2,988 May 3,040 June 3,034 July 3,152 August 3,106 September 2,674 October 2,074 November 1,509 December 1,000 2,000 3,000
(c)Peak load per monthin Bahrain.
Figure 7. Bahrain PowerGridStatistics
also very positive. In 2013 and 2014, the cumulative number of minutes that the transmission system was compromised due to failures was less than 20 seconds at each month.
Next, we present the key statistics for Qatar. In Figure 5a, we show the energy consumption by sector. It can be seen that majority of the electricity is consumed by domestic customers due to high demand for cooling. The country load profiles, daily, monthly, or yearly contain valuable information on the applicability of the potential smart grid applications. In the case of GCC
members, the load profiles reveal how much energy can be exchanged and determine the possible integration renewables and demand response technologies.
Currently, there is no publicly available load profile data in any of the member states. However, the electric utility of Qatar regularly shares the peak system usage on their social media page. Hence, we developed a simple data scraping software to collect the data for the last twelve months. We present the yearly load profile of Qatar in Figure 5b. It can be seen that the peak demand occurs in August when the school season
5 EAI Endorsed Transactions Smart Citieson
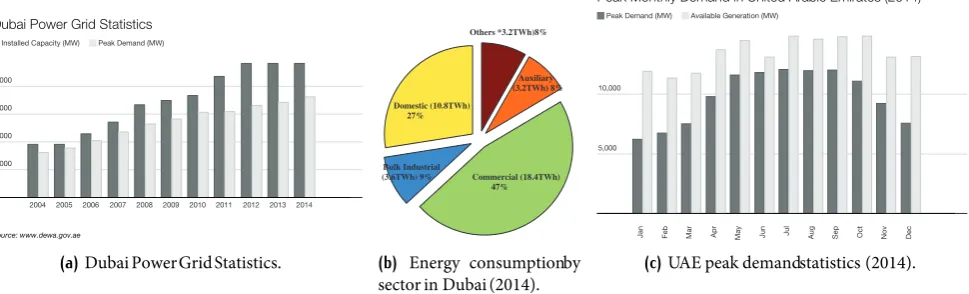
Dubai Power Grid Statistics
Installed Capacity (MW) Peak Demand (MW)
2004 2005 2006 2007 2008 2009 2010 2011 2012 2013 2014
Source: www.dewa.gov.ae 2,000
4,000 6,000 8,000
(a)DubaiPowerGridStatistics.
Domestic (10.8TWh) 27%
Bulk Industrial
(3.6TWh) 9% Commercial (18.4TWh)
47% Auxiliary (3.2TWh) 8% Others *3.2TWh)8%
(b) Energy consumptionby sector in Dubai(2014).
Peak Monthly Demand in United Arabic Emirates (2014)
Peak Demand (MW) Available Generation (MW)
Jan Feb Mar Apr May Jun Jul Aug Sep Oct Nov Dec
5,000 10,000
(c)UAE peak demandstatistics (2014).
Figure 8. UnitedArabic Emirates PowerGridStatistics
starts and there is a high demand for air conditioning. Moreover, the work in [24] states that there is a linear correlation between the daily peak temperature and the daily peak consumption for days that are warmer than 22 Celsius. Moreover, the seasonal gap between the winter and the summer demand leads to unused system capacity that can be used trade electricity between neighboring countries. This is better depicted in Figure 5c, where we show the half-hourly demand profile of two sample days from 2014: the first one is the day with the peak system demand (September 7, 2014) and the second is the day with the lowest customer demand (February 12, 2014). The results show that there is a high potential to employ demand response techniques to control electricity consumption, in particular for the air conditioning load.
Figures 6a, 6b and 6c depicts the further statistics for Qatar, namely maximum and minimum system load over the years, energy consumption per month and load factor for each sector. It can be seen that the grid operations are mainly shaped by the human activities.
2.4. Bahrain PowerGrid
The power grid in the Kingdom of Bahrain is operated by the Electricity and Water Authority. Bahrain is physically the smallest (770 km2 of the six GCC members and contains the lowest number of inhabitants as well. According to 2012 statistics, the number of transmission substations and their ratings are as follows: there are 10 substations with 33 kV, 114 substations with 66 kV, and 21 substations with 220 kV. The physical length of the transmission lines are 775, 300, and 44 km for 66 kV, 220 kV, and 33 kV, respectively.
The statistics of Bahrain national grid is similar to Qatar. The energy consumption is dominated by the domestic usage (depicted in Figure 7a).The peak and the aggregated energy consumption is high at summer
seasons as well. The related grid profiles are shown in Figures7band7c, respectively.
2.5. UnitedArabic Emirates PowerGrids
The power grids in United Arabic Emirates is operated by five authorities, namely Abu Dhabi Water and Electricity Authority (ADWEA), Dubai Electricity and Water Authority (DEWA), Sharjah Electricity and Water Authority (SEWA), and Federal Electricity and Water Authority (FEWA) for Northern Emirates. UAE is the second largest member of the GCC and the first member to deploy nuclear power plant in the region.
In order to gain more insights, we provide details for the DEWA because it is the largest utility in UAE. According to 2014 statistics, the number of transmission and distribution substations for the 400/132/33/11 kV are 19, 201, 123, and 28874 respectively. The physical length of the corresponding overhead (OHC) and underground cables (UC) are 1142, 2075, 2487, and 26876 km, respectively. The number of customers in 2014 was 677751. The customer portfolio has also similarities with Bahrain and Qatar, as 73% of the customers are residential. 24.87% constitutes the commercial customers, just 0.37% is the industrial customers, and the rest is the non-commercial government buildings (e.g., hospitals, schools, etc.). As depicted in Figure 8a, DEWA has been expanding its generation capacity to keep up with the increasing peak demand. The performance of the DEWA grid is also remarkable solid: the customer minutes lost was 5.62 minutes in 2013 and the power losses were 3.46%. The customer portfolio is presented in Figure8bfor Dubai and the peak generation (MW) is given in Figure8c.
2.6. Kingdomof Saudi Arabia PowerGrid
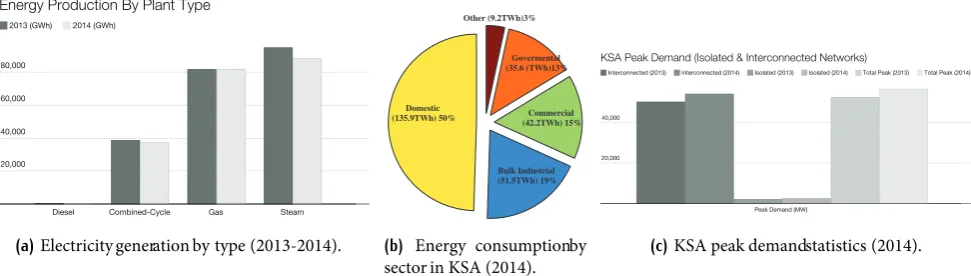
Energy Production By Plant Type
2013 (GWh) 2014 (GWh)
Diesel Combined-Cycle Gas Steam
0,000 40,000 60,000 80,000
(a)Electricity generation by type (2013-2014).
Domestic (135.9TWh) 50%
Bulk Industrial (51.5TWh) 19%
Commercial (42.2TWh) 15% Govermental (35.6 (TWh)13% Other (9.2TWh)3%
(b) Energy consumptionby sector in KSA (2014).
KSA Peak Demand (Isolated & Interconnected Networks)
Interconnected (2013) Interconnected (2014) Isolated (2013) Isolated (2014) Total Peak (2013) Total Peak (2014)
Peak Demand (MW)
20,000 40,000
(c)KSA peak demandstatistics (2014).
Figure 9. NationalGridof Kingdomof Saudi Arabia (KSA)Statistics
Oman Maximum and Minimum Demand
Peak Load (MW) Minimum Load (MW)
2005 2006 2007 2008 2009 2010 2011 2012 2013
1,000 2,000 3,000 4,000
(a)MinimumandMaximumDemandin Oman(2005-2013).
Domestic (4.2TWh) 48%
Commercial (2.3TWh) 27%
Govermental (1.6 (TWh) 19% Other (0.5TWh) 6%
(b) Energy consumptionby sector in Muscot Region (2014).
System Availability in Oman (%)
97.7
2005 98.23
2006 95.99
2007 98.49
2008 97.76
2009 98.46
2010 99.33
2011 99.65
2012 99.23
2013 20
40 60 80
(c)Omanpowergrid availability statistics.
Figure 10. OmanNationalGridStatistics
the power grids. The power grids are operated by the Saudi Electric Company which is a government owned monopoly. In 2014, the generation capacity of KSA was 65 GW delivering power through 554 254 km transmission and distribution lines to more than 7.6 million customers residing in 13 thousand cities and settlements. The changes from 2013 to 2014 suggests that the power grids in KSA are significantly growing: the generation capacity is expanded by 5.9%, the 6.4% increase in the number of customers has lead to 8.0% increase in the peak load. Moreover, transmission and distribution networks are grown by 10.1% and 7.1%, respectively and the network losses (both distribution and transmission) added up to 7.5%.
The power grid in KSA, more formally named as The National Grid SA, is divided into four regions: central region, eastern region, western region, and southern region. Figures9a,9b, and9cprovides more insights for the National Grid SA. Figure 9ashows the percentage of different power plant types in KSA. Figure9bshows the electricity consumption by sector, which is similar to other GCC members: the majority of the electricity is consumed by residential customers mostly for cooling needs. Moreover, Figure9cshows the peak demand for
Domestic 60% Industrial 20% Commercial 14% Govermental 5% Agriculture 1%
Figure 11. Kuwaitcustomerprofil in 2009.
interconnected grid and isolated networks. As given in the next section, KSA contains a considerable amount of scattered and remote settlements, which are not connected to the main grid. The peak demand for such electrified region reaches up to 2.4 GW, which puts additional financial burden on the utility operator.
7 EAI Endorsed Transactions Smart Citieson
2.7. OmanPowerGrid
The Omani power grid serves 754 000 three distribution regions served by Muscat, Mazoon, and Majan Elec-tricity companies. The transmission grid (220/132kV) is owned and operated by the Oman Electricity Trans-mission Co. and the 400kV connection to GCCIA grid is yet to be operational, as of January 2016 [1]. The performance figures for the transmission system in 2013 is as follows. The system availability was 99.23%, the average interruption time was 34 minutes, and the unsupplied energy accounted for 1418 MWh [2].
The statistics given in Figures 10a, 10b, and 10c provides more insights. The minimum and the maximum demand between 2005 and 2013 is depicted in Figure 10a, which shows the huge gap due to hot summer seasons. Similar to other members, the majority of the electricity is consumed by residential customers. In Muscat region, the biggest distribution grid operator, almost 50% of the electricity is consumed domestically. Moreover, Figure 10c shows the system availability of the entire power grid.
2.8. KuwaitPowerGrid
The power grids in Kuwait are vertically integrated and they are owned and operated by a the Ministry of Electricity and Water (MEW). The grid is entirely dependent on two sources: oil and gas. The state-owned organization, Kuwait Petroleum Corporation is the main supplier of these two fuels and the primary planning driver for the generation and network development are residential housing and commercial projects. The power grid is composed of five voltage levels 400, 275, 132, 33, and 11 kV.
3. GCC Interconnected Power Grid
3.1. Overview
The interconnection of GCC power grids can be viewed as the first major smart grid activity. The main drivers of the interconnection grid are: (1) cost efficiency; (2) shared spinning reserves; (3) deferred and reduced capacity investments; (4) lower carbon emissions; and (5) development of power markets. The growing energy demand (almost 10% annually) and the sudden demand surges frequently threaten the supply thus requiring costly investments. For example, in Figure 2b we present the steady increase in generation capacity expansion for each country. Consequently, as shown in Figure 2c the peak electricity demand increases and leads to higher operation cost. Furthermore, according to the study conducted in [6], there would be a need to invest one hundred billion Dollars to meet the growing demand of GCC over the next decade.
On the other hand sharing generation and transmis-sion resources can alleviate the upgrade requirements.
Hence, the interconnection is of paramount importance. The architecture of the GCC interconnected grid pre-sented in Figure 12aand the milestones of the project is given in Figure12b. Currently, member states are in the phase of creating a power market for energy trading. The real challenge in developing this platform is to find right pricing schemes as the subsidies vary significantly across the region. The benefits of the interconnection grid summarized next.
3.2. Benefit
The benefits of the GCC interconnection grid is mul-tifaceted. From an economic standpoint, the benefits include improved supply security, higher energy effi-ciency and savings through sharing spinning reserves. Also, the interconnection will reduce additional invest-ments, and operational and maintenance cost. For instance, if Saudi Arabia can reduce total installed capacity by 2GW, the total savings could be more than $309 million [6]. Also, it is estimated that there will be a $180 million US Dollars of savings in fuel operating costs from the entire region.
Moreover, in the case of emergencies the intercon-nection can provide energy supply. In fact, the security of power supply is one of the primary motivations behind the interconnection grid. According to [9], the GCC power network has prevented 250 sudden power loss incidents among the various member states. The GCC grid can also help to reduce the carbon emissions caused by the using crude oil. Countries such as Kuwait and Saudi Arabia can purchase electricity produced from natural gas, nuclear power, or solar from other countries. Also, with the help of the proper regula-tions, independent power producers already started to generate profit through energy exchange. Moreover, the member states are considering to create an energy market that can trade electricity with countries like Egypt, Jordan, Iraq, Lebanon, Syria, and Turkey.
3.3. CurrentStatus
Since 2009, the GCC members invested around $1.2 billion US Dollars to build 900 km long 400kV transmission lines and 7 400 kV substations, and a 1800 MW three-pole back-to-back high voltage direct current (HVDC) converter stations. The connection with Bahrain is made with a submarine cable [31]. The HVDC stations are being use to synchronize the 60 Hz Saudi Arabia grid with the rest of the members who are using 50 Hz. Offnote, the HVDC stations located in the GCCIA is the biggest back-to-back substation in the world that allows sharing of spinning reserves between 60 and 50 Hz systems.
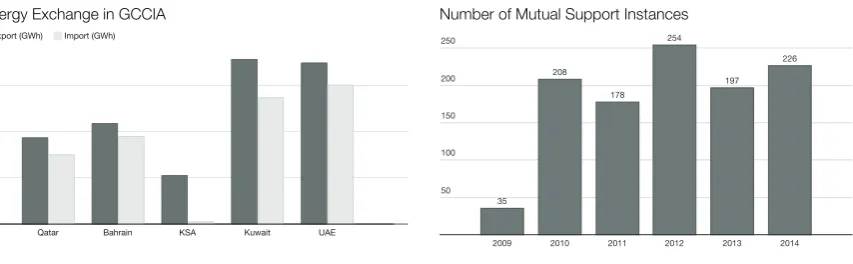
Energy Exchange in GCCIA Export (GWh) Import (GWh)
Qatar Bahrain KSA Kuwait UAE
50 100 150
(a)Energy exchangefor systemsupport during2014.
Number of Mutual Support Instances
35
2009 208
2010 178
2011 254
2012 197
2013 226
2014 50
100 150 200 250
(b)Numberof mutualsupport instancesamongfiv members.
Figure 13. The operation of GCC interconnectiongrid for powersystemstability.
Saudi Arabia
Kuwait
Bahrain
Qatar
Oman UAE
100km 90km
53km
310km
1
12km
290km
150km
1200MW
600MW
750MW
400MW
900MW
1200MW
200kV
200kV
200kV 400kV
400kV 400kV 400kV
400kV
400kV
(a)Electricity mapof the GCC Grid[21] GCCIA formation by royal decree
2001
Phase 1: Initial contracts awarded
2005
UAE own reinforcement
2005
GCCIA became operational
2009
First energy exchange
2010
Phase 3: UAE grid synch.
2011
Phase 3: Oman grid synch.
2011
Power market establishment
2015
(b)GCCIAmilestones.
Figure 12. GCC interconnectiongrid overview
Interconnection Authority 2014 annual report, more than 1000 incidents occurred between 2009 and 2014. In Figure13b, we present the number of mutual support instances among the member states. Notice that Oman is excluded from the lists as Oman was
not connected to the network until 2014. Mainly, the interconnected grid ensured that the system operates at the right frequency and voltage standards. Moreover, it prevented the system from demand disconnections. For this reason, member states exchange energy through high transmission lines. For instance in 2011, 680 GWh of energy was exchanged between the members and Figure 13a shows the amount of energy exports and imports of each GCC member.
4. Renewable Energy Integration
The GCC region is endowed with one of the world’s most abundant solar resources and the integration of renewable energy has attracted systematic interest by the governments. The main drivers behind the solar energy are to minimize the electricity generation and reduce the carbon emissions. For end-users, solar generation is expected to have two applications. In the first one, consumers can install PV panels to their rooftops and generate electricity for domestic usage and sell the excess power back to the grid. Recently, UAE became the first GCC member to allow customers to employ solar rooftops.
One key issue is that the region demographics include a significant number of remote scatters farms and villages. Typically these locations operate off-grid and burn diesel generators, as the integration of the main grid is not economically viable. Hence, the second application would be to run solar panels in off-grid mode that will eliminate the need for burning crude oil.
4.1. Goals & Potential Analysis
The Global Horizontal Irradiance (GHI) defines the average electricity generated from Photovoltaic sys-tems. The measured GHI for the GCC members are 2140, 2160, 2130, 1900, 2050, and 2120 kWh/m2/year for Qatar, Bahrain, Saudi Arabia, Kuwait, Oman, and UAE respectively. Concentrating Solar Thermal Power (CSP) systems are also widely used for solar energy
9 EAI Endorsed Transactions Smart Citieson
generation. For CSP technology, Direct Normal Irra-diance (DNI) is used to define the average electricity generation. The measured DNI is 2000, 2050, 2000, 1900, 2200, and 2200 kWh/m2/year for Qatar, Bahrain, Saudi Arabia, Kuwait, Oman, and UAE respectively.
The GCC governments have set solar penetration goals for solar integration. For instance, Qatar has a goal of putting 1GW solar panels by 2020 using Photovoltaic systems. Kingdom of Saudi Arabia, on the other hand, is aiming to build 41 GW CSP by 2032. According to International Renewable Energy Agency, Kuwait seeks to create 10 MW Photovoltaic and 50MW CSP. Similarly, Oman aims to put 700MW solar capacity by 2020. UAE, on the other hand, seeks to generate 15% of the total demand from solar generation by 2020.
4.2. Barriers
Even though the region has a high potential for solar integration, the aforementioned goals cannot be achieved without addressing the following issues. The first problem is with the materials of the PV panels. The efficiency of the crystalline silicon-based photovoltaic solar cells degrade with high temperature and the current technology does not perform well in the region. Hence, there has been a growing research and development interests in the region to develop new materials for PV panels for in high-temperature conditions which will also improve solar economics in the region. Another barrier to solar integration is the soiling of PV panels due to dust deposition. This is a significant factor as the region frequently experiences sand storms and the performance of the solar systems degrade significantly. For instance according to a study conducted at Qatar Foundation (QF) [25], the power loss is around 10−15% per
month on average. Similarly, research activities in QF include developing anti-dust technologies such as hydrophobic coatings, robotic cleaners, and electrical shields. Currently, renewable energy integration is very limited in the region because the cost of renewable energy systems compared to conventional electricity generation methods is still very costly. Hence, there is pressing need to create new policies and incentives to push the solar generation into mainstream acceptance. Also, utilities need to create a common standards and regulations and need to consider the effects of solar integration once the GCC grid is fully operational.
5. Demand Side Management
Demand side management (DSM) refers to a set of rules and policies that aim to optimize the energy consumption at the end-user side. The most popular DSM programs that have been used in practice include energy efficiency, differential tariffs (e.g., time-based tariffs, dynamic pricing), and demand response
programs. Such programs are also becoming popular in the GCC region, as DSM programs can shave the peak demand and reduce the cost of system operations.
The aforementioned subsidies provided by the governments have been discouraging the investments to efficient infrastructures. Nevertheless, the GCC members recently started to invest in energy efficiency programs in buildings and transportation systems. For instance, Qatar has launched a new energy conservation program called Tarsheed, aiming to improve the energy consumption in residential and commercial buildings. Similarly, in 2012 Saudi Arabia launched the Saudi Energy Efficiency Program in order to enhance the consumption. Similar efforts are carried out in UAE: Dubai initiated a demand-side management committee to reduce energy demand by 30% by 2030. Similarly, Sharjah of UAE has started a peak load reduction program that enforces citizens to turn offnon-essential appliances during peak hours. The GCC members are gradually transforming their transportation systems from oil-based to electric-based [27, 28]. Dubai is installing 100 charging stations. Qatar is considering to employ electric vehicles for public transportation for the Fifa 2022 World Cup.
Smart meters and advanced metering infrastructures are critical enablers of demand side management. Qatar utility company Kahramaa already started to deploy 17000 smart meters in Doha teamed up with Siemens for the smart meters [5]. For the case of Oman, the work presented in [26] shows that the long-term benefits of load management outweighs the required investments. One essential characteristic of the region is that the vast majority of the energy is consumed at residential units, mostly for air-conditioning. Hence, with the help of the communication and sensor technologies, utilities can employ direct load control mechanisms to adjust the load while providing a good level of comfort. Also, the integration of social sciences could help to reduce the peak usage. Peer pressure is one of the most effective methods of reducing electricity consumption. For instance, a social study in California tries to motivate customers to reduce their consumption by comparing the individual bills with the average consumption of their neighbors. This method enables customers to reduce their consumption by 1.5 to 3.5 percent. Our final recommendation is for coupling the solar generation with energy-intensive water desalination process.
5.1. Load Profile
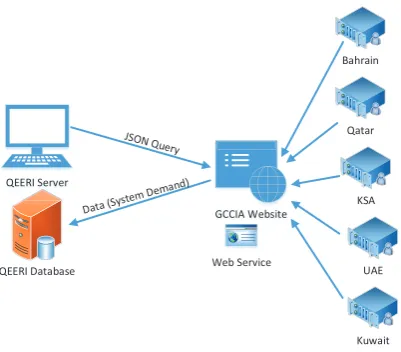
QEERI Database Web Service QEERI Server
GCCIA Website
Qatar
KSA
UAE
Kuwait Bahrain
Figure 14. The Real-time GCC Power Demand Automated
Program.
of available datasets for load profiles. The main reason for this is the fact that most of the grids are operated by government agencies which follow conservative policies on data sharing. Nevertheless, in this section we provide an overview of efforts on creating the first data repository of load profiles in the GCC region. To the best of our knowledge this is first effort that makes such data publicly available. As shown in Figure 14, the load profiles of the five countries are stored at the GCCIA website. Our automated program collects nation-wide information at every minute and stores it to SQL database.
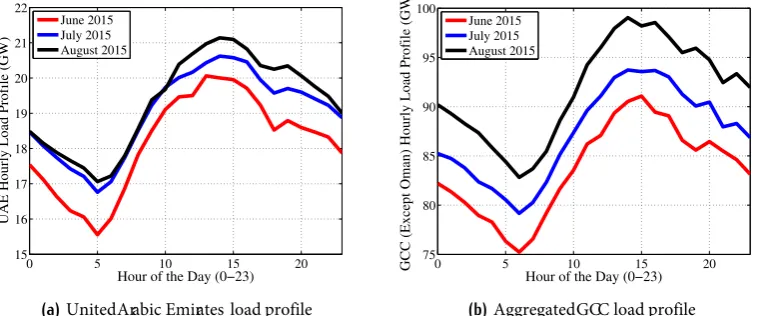
In Figures 15a, 15b, 16a,16b, 17a, 17b, we present the average load profiles for June, July, and August 2015 for Qatar, Bahrain, Saudi Arabia, Kuwait, UAE, and aggregated GCC, respectively. Notice that Oman is not in the list because the Omani grid is not connected to the GCCIA yet. The results reveal several important information. First of all, the demand for electricity follows the average temperatures, therefore, demand increases from June to August. Another point is that the summer peak occurs once a day in the afternoon around 3 pm and the lowest demand occurs around 5 am before the sun rises due to cooler desert climate. Moreover, the load curves prove that there is a great potential to use solar generation, because there is a correlation between the solar generation and the customer peak demand.
6. Conclusion
In this paper, we provided an overview of the GCC power grid and smart grid efforts. We showed that the interconnection of the grid would improve grid stability, lead to efficient resource usage, and reduce the operation cost. The integration of abundant solar
resources and the implementation of DSM programs can be very useful to substitute diesel generators at remote farms and villages.
References
[1] Oman Power and Water Procurement Co.(2015)OPWPs
7-Year Statement (2015-2021).
[2] Oman Power and Water Procurement Co. (2013)
Transmission Performance Report.
[3] Oman Power and Water Procurement Co. (2013)
Transmission Performance Report.
[4] El-Katiri, L., Husain, M: Prospects for Renewable Energy in GCC States-Opportunities and the Need for reform. Oxford Institute for Energy Studies. (2014)
[5] Abdalla, G..: The Deployment of Advanced Metering Infrastructure, IEEE First Workshop on Smart Grid and Renewable Energy, Doha, Qatar (2015)
[6] Al-Asaad, H.: Electricity Power Sector Reform in the GCC Region, The Electricity Journal, vol. 22, issue 9, pp. 58 --64, Nov, 2009
[7] Shaahid, S.M., El-Amin, I.: Techno-economic evaluation of off-grid hybrid photovoltaic?diesel?battery power systems for rural electrification in Saudi Arabia A way forward for sustainable development, Renewable and Sustainable Energy Reviews, vol 13, issue 3, 2009
[8] May, P., Ehrlich, H.C., Steinke, T.: ZIB Structure Prediction Pipeline: Composing a Complex Biological Workflow through Web Services. In: Nagel, W.E., Walter, W.V., Lehner, W. (eds.) Euro-Par 2006. LNCS, vol. 4128, pp. 1148–1158. Springer, Heidelberg (2006)
[9] Al-Ebrahim, A.: Super Grid Increases System Stability. In Transmission and Distribution World (2012)
[10] Charles, C., Moerenhout, T., Bridle, R., The Context of Fossil-Fuel Subsidies in the GCC Region and Their Impacts on Renewable Energy Development, International Institute for Sustainable Development (2014)
[11] Foster, I., Kesselman, C.: The Grid: Blueprint for a New Computing Infrastructure. Morgan Kaufmann, San Francisco (1999)
[12] Kassakian, J., Schmalensee, R., The Future of the Electric Grid: An Interdisciplinary MIT study, 2012
[13] Czajkowski, K., Fitzgerald, S., Foster, I., Kesselman, C.: Grid Information Services for Distributed Resource Sharing. In: 10th IEEE International Symposium on High Performance Distributed Computing, pp. 181–184. IEEE Press, New York (2001)
[14] Foster, I., Kesselman, C., Nick, J., Tuecke, S.: The Physi-ology of the Grid: an Open Grid Services Architecture for Distributed Systems Integration. Technical report, Global Grid Forum (2002)
[15] Qatar General Electricity and Water Corporation, http://www.km.com.qa/
[16] Electricity and Water Authority of Bahrain, http://www.mew.gov.bh/
[17] Saudi Electricity Company, http://www.se.com.sa/ [18] Ministry of Electricity and Water of Kuwait,
http://www.mew.gov.kw/
[19] Abu Dhabi Water and Electricity Company, http://www.adwec.ae/
11 EAI Endorsed Transactions Smart Citieson
0 5 10 15 20 4.5
5 5.5 6 6.5 7
Hour of the Day (0−23)
Qatar Hourly Load Profile (GW)
June 2015 July 2015 August 2015
(a)Qatar load profile
0 5 10 15 20
2.2 2.4 2.6 2.8 3 3.2
Hour of the Day (0−23)
Bahrain Hourly Load Profile (GW)
June 2015 July 2015 August 2015
(b)Bahrain load profile
Figure 15. The operation of GCC interconnectiongrid for powersystemstability.
0 5 10 15 20
42 44 46 48 50 52 54 56
Hour of the Day (0−23)
KSA Hourly Load Profile (GW)
June 2015 July 2015 August 2015
(a)Kingdomof Saudi Arabia load profile
0 5 10 15 20
8.5 9 9.5 10 10.5 11 11.5 12 12.5
Hour of the Day (0−23)
Kuwait Hourly Load Profile (GW)
June 2015 July 2015 August 2015
(b)Kuwaitload profile
Figure 16. The operation of GCC interconnectiongrid for powersystemstability.
0 5 10 15 20
15 16 17 18 19 20 21 22
Hour of the Day (0−23)
UAE Hourly Load Profile (GW)
June 2015 July 2015 August 2015
(a)UnitedArabic Emirates load profile
0 5 10 15 20
75 80 85 90 95 100
Hour of the Day (0−23)
GCC (Except Oman) Hourly Load Profile (GW)
June 2015 July 2015 August 2015
(b)AggregatedGCC load profile
Figure 17. The operation of GCC interconnectiongrid for powersystemstability.
[20] Electricity Holding Company ,
http://www.electricity.com.om/
[21] Gulf Cooperation Council Interconnection Authority, http://www.gccia.com.sa/
[22] The World Bank,data.worldbank.org/indicator/EN. ATM.CO2E.PC
[24] Gastli, A., Charabi, Y., Alammari, R., Al-Ali, A.: Corre-lation Between Climate Data and Maximum Electricity Demand in Qatar. In: IEEE GCC Conference and Exhibi-tion, Doha, Qatar (2013)
[25] Guo, B., Javed, W., Figgis, W., Mirza, T.: Effect of Dust and Weather Conditions on Photovoltaic Performance in Doha, Qatar, In: IEEE First Workshop on Smart Grid and Renewable Energy, Doha, Qatar, (2015)
[26] Malik, A., Bouzguenda, M.: Effects of smart grid technologies on capacity and energy savings e A case study of Oman, Energy, vol.54, pp.365-371 (2013) [27] Bayram, I.S., Michailidis, G., Devetsikiotis, M.:
Unsplit-table Load Balancing in a Network of Charging Stations Under QoS Guarantees, IEEE Transactions on Smart Grid, vol.6, issue 3, pp. 1292-1302 (2015)
[28] Bayram, I.S., Tajer A., Abadllah, M., Qaraqe, K.: Capacity Planning Frameworks for Electric Vehicle Charging Stations With Multiclass Customers, IEEE Transactions on Smart Grid, vol.6, issue 4, pp. 1934-1943 (2015)
[29] Mohsenian-Rad, M. : Optimal Demand Bidding for Time-Shiftable Loads, IEEE Transactions on Power Systems, vol. 30, issue 2, 939-951 (2015)
[30] California ISO, http://www.caiso.com/1c78/ 1c788230719c0.pdf
[31] Aljohani, Tawfiq M., and Abdullah M. Alzahrani. "The Operation of the GCCIA HVDC Project and Its Potential Impacts on the Electric Power Systems of the Region." (2014).
13 EAI Endorsed Transactions Smart Citieson
![Figure 3. Electricitytari˙s obtainedfromQatar [15], Bahrain[16]. Saudi Arabia [17], Kuwait[18], Oman[20], UAE [19].](https://thumb-us.123doks.com/thumbv2/123dok_us/8432201.1698204/4.595.52.288.400.533/figure-electricitytari-obtainedfromqatar-bahrain-saudi-arabia-kuwait-oman.webp)