http://www.sciencepublishinggroup.com/j/ajce doi: 10.11648/j.ajce.20170502.15
ISSN: 2330-8729 (Print); ISSN: 2330-8737 (Online)
Deterministic Modelling Techniques on Strain Influenced
by Compressive Strength from All in One Aggregate
Concrete
Ode. T.
1, Eluozo S. N.
21Department of Civil Engineering, Faculty of Engineering Rivers State University of Sciences and Technology Nkpolu, Port Harcourt,
Nigeria
2Subaka Nigeria Limited, Port Harcourt, Nigeria
Email address:
[email protected] (Ode. T.), [email protected] (Eluozo S. N.), [email protected] (Eluozo S. N.)
To cite this article:
Ode. T., Eluozo S. N. Deterministic Modelling Techniques on Strain Influenced by Compressive Strength from All in One Aggregate Concrete. American Journal of Civil Engineering. Vol. 5, No. 2, 2017, pp. 104-110. doi: 10.11648/j.ajce.20170502.15
Received: August 23, 2016; Accepted: October 31, 2016; Published: March 4, 2017
Abstract:
Experts has express strain from various materials on different type of aggregate grade, empirical and experimental analysis has been the concept of generating these parameters, empirical modeling are generated from experimental investigation, the study on these materials was to generate its rate of strength development from all – in- one grave aggregate. The developed strength are reflected on the strain, the values were generated from deterministic modeling techniques, the predictive values were subjected to comparisons using experimental values, both parameters express favorable fits validating the developed model predicting strain from all in one aggregate concrete. The study is imperative because experimental evaluation including empirical approach has been the only method of application or generation of strain thus stress-strain relationship, but deterministic techniques has been developed to predict the strain from all in one aggregate concrete, the strength development from these materials has also become another break through on concrete strength development.Keywords:
Deterministic Modeling, Strain, Compressive Strength, and Aggregate Concrete1. Introduction
It has been observed that when concrete is subjected to loading, it display a linear stress-strain connection to elastic range. The ratio through linear portion of the slope of stress-strain is known as the modulus of elasticity [1]. The elastic limit is “the maximum stress which a material is competent of sustaining without any divergence from proportionality of stress to strain (Hooke’s law).” It is explicitly know that the modulus of elasticity is the ratio stuck between stress and the reversible strain. When a load is applied to concrete, it will distort the originality of the structure. The magnitude of the load/per cross-sectional area of the specimen depend on the deformation of the structure, The value of strain is of immense significance since it represents the inflexibility of the structural design, thus the stress at which the concrete will observe lasting deformation if exceeded. Most structures are subjected to cyclic loading, thus it is imperative to know the elastic plastic portion for design purposes, particularly the quantity of
and experimental parameters that include age at testing, strain rate and interaction between specimen and testing machine. The stress-strain model used for NSC cannot be extended for use in HSC as the nature of loading curve changes significantly. Steeper rise and sudden drop in strength after maximum value presents difficulty in numerical modeling of stress-strain behaviour of HSC. [9] Suggests that HSC behaves like a real composite material and parallels can be drawn to the stress-strain behaviour used in rock mechanics [7, 16, and 17]. Smooth river gravel produces weaker concrete. Smallest size of coarse aggregate produces highest strength concrete owing to its high specific surface area. Addition of silica fume decreases the requirement of low w/c to achieve high compressive strength. [15, 16 and17] noted that effect of silica fume on strength development of HSC is most prominent during 7 to 28 days after mixing. Hence, most of the empirical formulations express modulus of elasticity as a function of compressive strength. The equation suggested in ACI-318 overestimates elastic modulus of HSC and ACI 363 [6] suggest a different equation for HSC based on studies done [5] that have been shown to produce conservative values for normal-density concrete [8, 9 and 10]: Data on Poisson’s ratio of concrete is very limited, especially for HSC. Poisson’s ratio of HSC is constant in the linear zone but increases in the non-linear zone as a function of axial strain. In the non-linear range, Poisson’s ratio is not affected by compressive strength, curing method and age of concrete [6 and 8 and 18].
2. Governing Equation
l C S l C K z C W S G S S C ∂ ∂ + ∂ ∂ = ∂ ∂ (1)
Equation (1) using method of separation of variable whereby we let C (z, l) =Z (z) L (l).
[
]
2' τ = + L L S
K G (2)
Therefore, we have a solution of the forms;
2 2
G
Cz K S
W
Z A andL B
τ
τ
+
= ℓ = ℓ (3)
Which when combine gives equation (4) as thus;
+
=
WC K SGM
z
l
Ae
B
C
2 2)
,
(
τ τℓ
(4) 2)
,
(
τ + +=
C K SGl W
z
M
z
l
AB
C
ℓ
(5)3. Materials and Method
3/8 gravel concrete like any other materials is to a certain extend elastic as such stresses and strain induced in any
structural members. The standard procedure for making and testing concrete cylinders for static young modulus of elasticity as per ASTM C469 (1975) were adopted in this investigation. 3/8 gravel concrete cylinders of 30cmx 15cm Diameter were made with 1:1:6:2:9 mix proportion by weight and recommended water cement ratio of 0.45, cured and tested after 28 days under compression in a compression machine. Demech mechanical strain garage was used to measured strain at middle of the specimen height. Strains recorded were taken immediately after loading. The modulus of elasticity E is the proportionality constant defined as the ratio of stress to strain. The relationship between Ec and Fcu normal dense concrete according to British standard is given as Ec =9.1f1/3[KN/mm3]
4. Results and Discussion
Results and discussion are presented in tables including graphical representation of predictive and experimental values for strain.
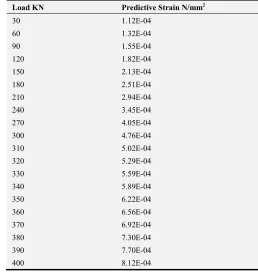
Table 1. Strain relationship at Different Load.
Load KN Predictive Strain N/mm2
30 1.12E-04
60 1.32E-04
90 1.55E-04
120 1.82E-04 150 2.13E-04 180 2.51E-04 210 2.94E-04 240 3.45E-04 270 4.05E-04 300 4.76E-04 310 5.02E-04 320 5.29E-04 330 5.59E-04 340 5.89E-04 350 6.22E-04 360 6.56E-04 370 6.92E-04 380 7.30E-04 390 7.70E-04 400 8.12E-04
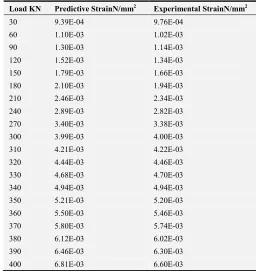
Table 2. Predictive and Experimental Values of Strain at Different Load.
Load KN Predictive StrainN/mm2
Load KN Predictive StrainN/mm2
Experimental StrainN/mm2 270 4.05E-04 5.10E-04 300 4.76E-04 5.70E-04 310 5.02E-04 5.90E-04 320 5.29E-04 6.10E-04 330 5.59E-04 6.30E-04 340 5.89E-04 6.50E-04 350 6.22E-04 6.70E-04 360 6.56E-04 6.90E-04 370 6.92E-04 7.10E-04 380 7.30E-04 7.30E-04 390 7.70E-04 7.50E-04 400 8.12E-04 7.70E-04
Table 3. Strain Values at Different Load.
Load KN Predictive StrainN/mm2
30 5.88E-04 60 6.84E-04 90 8.03E-04 120 9.44E-04 150 1.11E-03 180 1.30E-03 210 1.53E-03 240 1.79E-03 270 2.11E-03 300 2.47E-03 310 2.61E-03 320 2.75E-03 330 2.90E-03 340 3.06E-03 350 3.23E-03 360 3.41E-03 370 3.60E-03 380 3.79E-03 390 4.00E-03 400 4.23E-03
Table 4. Predictive and Experimental Valuesof Strain at Different Load.
Load KN Predictive StrainN/mm2 Experimental StrainN/mm2 30 5.88E-04 1.17E-04
60 6.84E-04 2.34E-04 90 8.03E-04 3.86E-04 120 9.44E-04 4.92E-04 150 1.11E-03 6.45E-04 180 1.30E-03 8.24E-04 210 1.53E-03 1.03E-03 240 1.79E-03 1.28E-03 270 2.11E-03 1.58E-03 300 2.47E-03 1.92E-03 310 2.61E-03 2.05E-03 320 2.75E-03 2.18E-03 330 2.90E-03 2.32E-03
Load KN Predictive StrainN/mm2 Experimental StrainN/mm2
340 3.06E-03 2.47E-03 350 3.23E-03 2.63E-03 360 3.41E-03 2.79E-03 370 3.60E-03 2.96E-03 380 3.79E-03 3.14E-03 390 4.00E-03 3.32E-03 400 4.23E-03 3.52E-03
Table 5. Strain Values at Different Load.
Load KN Predictive StrainN/mm2
30 9.39E-04
60 1.10E-03
90 1.30E-03
120 1.52E-03
150 1.79E-03
180 2.10E-03
210 2.46E-03
240 2.89E-03
270 3.40E-03
300 3.99E-03
310 4.21E-03
320 4.44E-03
330 4.68E-03
340 4.94E-03
350 5.21E-03
360 5.50E-03
370 5.80E-03
380 6.12E-03
390 6.46E-03
400 6.81E-03
Table 6. Predictive and Experimental Values of Strain at Different Load.
Load KN Predictive StrainN/mm2 Experimental StrainN/mm2 30 9.39E-04 9.76E-04
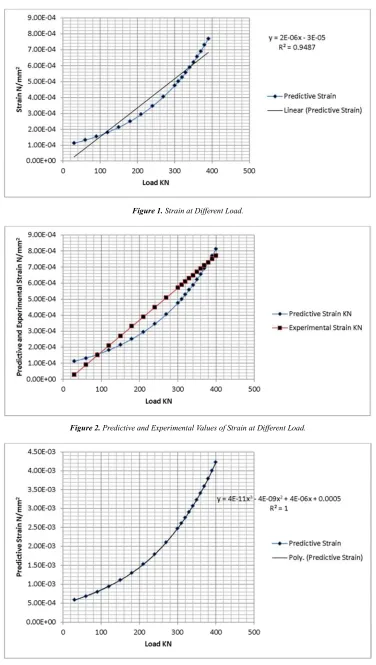
Figure 1. Strain at Different Load.
Figure 2. Predictive and Experimental Values of Strain at Different Load.
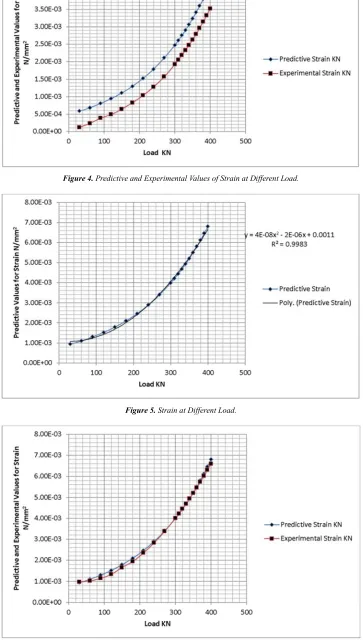
Figure 4. Predictive and Experimental Values of Strain at Different Load.
Figure 5. Strain at Different Load.
The Study expresses the increase in load and strain in graphical representation, Figure one shows the rate of gradual strain increase to the optimum level recorded at 400N/mm. Comparison was imperative as figure two shows the fitness, there is a rate between the predictive and experimental strain relationship, establishing these fitness gradual increase between the experimental and predictive values observed in the system. Figure three express the rate of strain variation, the rate of strain increase as the loads increases up to the optimum level. The expression was to predict the load at another developed parameter showing the rates of strain in all in this grade of concrete formation. Figure four express the behaviour of both the predictive and experimental level of strain as it expressed it rate of strain through these applied parameters in the system, these reaction on the strain are base on the behaviour of the materials that form these grade of concrete. Best fitness was observed between both parameters. Figure five express it gradual increase to the maximum rate, these are base on the increase in load which implies that the rate of load increase determine the strain increase to the optimum level recorded at 400KN. Figure six express the fitness level between the predictive and experimental values, both parameter maintained favorable fits validating the developed model for the study.
5. Conclusion
The applications of concrete definitely distort some level of determinant on the extent of the load. The value of strain is of immense importance since it stands for the inflexibility of the structural design, this has show some express stress at which the concrete will monitor lasting deformation if limits are exceeded. It has been observed that when most structures are subject to stress through cyclic loading, it is imperative to monitor and observe the elastic portion for design purposes, particularly the quantity of steel required for concrete works. The elastic modulus of concrete is determined on different aggregate types with different elastic moduli. There is an observations on previous researchers subjecting to the behaviour found in Stress-Strain relation curves for aggregate, concrete, and cement paste, they were able to express stress-strain relations on cement paste, aggregate and concrete. From all researches carried out aggregate has a substantially at larger elastic modulus compared to concrete and cement paste, the developed model predicting the strain were express through the characteristic of concrete formation, but precisely the study developed better strength concrete in all in one aggregate, the strain are generated from these type of concrete formation. The predictive model has express the rate of strain increase at different load to the optimum level of 400KN. The predictive and experimental values expressed best fit validating the developed model for the study.
Nomenclature
CS=Strain
WC=Water Cement Ratio
K=Permeability S=vertical Strain G=specific gravity Z, L=Variation of Load
References
[1] Boris H 2009; Strength, modulus of elasticity, creep and shrinkage of concrete used in Florida Master of Engineering University of Florida.
[2] Manish K. 1, A. M. ASCE; Zhaoyu Ma Moses M 2012; Department of Civil, Structural and Environmental Engineering, University at Buffalo, State University of New York.
[3] Aītcin, P. C. (1998). "High-performance concrete." Taylor & Francis.
[4] Beushausen, H., and Alexander, M. (2010). "Strength of Concrete: Influencing factors, design principles, code requirements." Concrete technology for structural engineers, <http://www.comsiru.uct.ac.za/Workshop%20Downloads/Con crete%20Technology%20Worksh
op%202010%20Lecture%202%20-%20Concrete%20Strength.pdf>. (September 10, 2012). [5] Carrasquillo, R. L., Nilson, A. H., and Slate, F. O. (1981).
"Properties of high-strength concrete subject to short-term loads." Journal of the American Concrete Institute, 78(3), 171-178.
[6] Dewar, J. (1964). "The indirect tensile strength of concrete of high compressive strength." Cement and Concrete Association.
[7] Ode. T. 2004, Structural properties of concrete made with locally occurring 3/8 gravel, M. Tech Thesis pp 6.
[8] Ephraim M. E. Ode. T. (2006) Specification for structural Application of concrete with 10mm (3/8) All – in Gravel Aggregate NEAM Vol 1 No 1.
[9] Ode. T. and Eluozo S. N. 2016 Predictive Model on Compressive Strength of Concrete Made with Locally 3/8 Gravel from Different Water Cement Ratios and Curing Age; International Journal of Scientific and Engineering Research, Volume 7, issue 1 pp 1528-1551.
[10] Ode. T. and Eluozo S. N. - 2016Model Prediction to Monitor the Rate of Water Absorption of Concrete Pressured by Variation of Time and Water Cement Ratios International
Journal of Scientific and Engineering Research, Volume 7, issue 1 pp1514-1527.
[11] Ode. T. and Eluozo S. N. 2016 Calibrating the Density of Concrete from Washed and Unwashed Locally 3/8 Gravel Material at Various Curing Age International Journal of
Scientific and Engineering Research, Volume 7, issue 1 January-pp 1514-1552-15574.
[13] Ode. T. and Eluozo S. N; 2016 Predictive Model to Monitor Variation of Concrete Density Influenced by Various Grade fromLocally3/8 Gravel at Different Curing Time International Journal Engineering and General Science Volume 4 Issue 1, pp 502-522.
[14] Ode. T. and Eluozo S. N; 2016 Predictive Modesto Monitor Vitiation of Stress –Strain Relationship of 3/8 Gravel Concrete with Water Cement Ration [0.45] at Different Load International Journal Engineering and General Science Volume 4 Issue 1, pp 409-418.
[15] Eluozo S. N. and Ode. T. 2015 Modeling and simulation of Compression Strength for Firm Clay in Swampy Area of Ahoada East International Journal of Advance Research in
Engineering and Technology Volume 6, Issue 12, pp 73-85.
[16] Eluozo S. N. and Ode. T. 2015Mathematical Model to Predict Compression Index of Uniform Loose Sand in Coastal Area of Degema, Rivers State of Nigeria International Journal of
Advance Research in Engineering and Technology Volume 6, Issue 12, pp 86-103.
[17] Eluozo S. N. and Ode. T. 2015Mathematical to Monitor Stiff Clay Compression Index in Wet Land Area of Degema
International Journal of Advance Research in Engineering and Technology Volume 6, Issue 12, pp 59-72.