ANALYSIS AND OPTIMIZATION OF
INCONEL 718 MACHINING USING
COATED CARBIDE TOOL
PRAVIN PANDE
Assistant Professor, Department of Mechanical Engineering, Rajrshi Shahu College of Engineeering, Buldana - 443001, Maharashtra, India
Dr. Rajeshkumar U. Sambhe2
Associate Professor, Department of Mechanical Engineering,
Jawaharlal Darda Institute of Engineering &Technology, Yavatmal - 445001, Maharashtra, India. [email protected]
Abstract: Inconel 718 consumes 60% out of total nickel based alloy. This material is heat resistant, keeps dimensional stability when subjected to high temperature. As inconel 718 has age hardening property and high hardness it consider under category of difficult to cut. In this work attempt has been made to optimize and analyze the turning operation. Taguchi and Fuzzy based artificial intelligence model prepared to predict machining responses.
Keywords: Nickel alloy; inconel 718; Fuzzy.
1. Introduction
The inconel 718 is the most popular nickel based alloy in component manufacturing of aerospace industries. This material also has wider applications in area subjected to high temperature region. Arguably, inconel 718 is very successful super alloy from 50 years of its introduction. The peculiar properties posses by inconel 718 is high strength-weight ratios, exceptional corrosion resistance, longer service life, mechanical and thermal fatigue, thermal shock, creep and erosion, at elevated temperatures. The objective behind machining research is to study the interaction of the carbide tool and the work piece to optimize cutting conditions and hence minimize cost of operation and maximize product surface quality.
2. Inconel 718 machining issues
The characteristics of the enco alloys cause high temperature (1000°C) and stresses ( 3450 MPa) in the cutting zone leading to accelerated flank wear, chattering and notching, depending on the tool material and cutting conditions used Ezugwu et al (1991).The material results in high temperature stress and a thick adhering layer at the tool-work interface during machining. The toughness results in difficulty in chip breaking during the process. These difficulties lead to high tool wear less material remove rate (MRR) and poor surface finish. The metallurgical damage to the workpiece due to the very high cutting forces which also gives rise to work hardening, surface tearing and distortion in finally machined components due to induced stresses. Rahman et al (1997) Choudhury et al (1998). The tendency to form a BUE during machining and the presence of hard abrasive carbides in their microstructure also deters machinability. The combination of high speed cutting and dry cutting for difficult-to-cut aerospace materials is the growing challenge to deal with the economic, environmental and health aspects of machining. Added advantages of dry machining are non-pollution of atmosphere or of water, no residue of lubricant on machined components and no residue of lubricant on evacuated chips which reduces disposal costs and the associated energy consumption. D. Dudzinski et al (2004).
3. Inconel 718 Machining with carbide tools
4. Experiential details
The experimentation was carried out using Gildemeister CTX 310 Eco CNC Lathe in dry environment. Speed and feed considered as machining parameters to evaluate surface roughness and material removal rate as machining responses.
4.1. Work piece material and Cutting tool
The work material used was Inconel 718 round bar of Φ 29 mm. The chemical composition and mechanical properties of the work piece are given in Tables 1 and 2, respectively.
Table 1: The chemical composition of inconel 718
Element Ni (+Co) Ti Cr Nb(+Ta) Al Fe + Other
Weight (%) 50-55 0.65-1.5 17-21 4.75-5.5 0.2-0.8 Balance
Table 2: The mechanical properties of inconel 718
Density 8.19 g/cm3
Melting point 1260–1336 oC
Specific heat 435 J/kg K
Average coefficient of thermal expansion 13 lm/m K
Thermal conductivity 11.4 w/m K
Ultimate tensile strength 1240 MPa
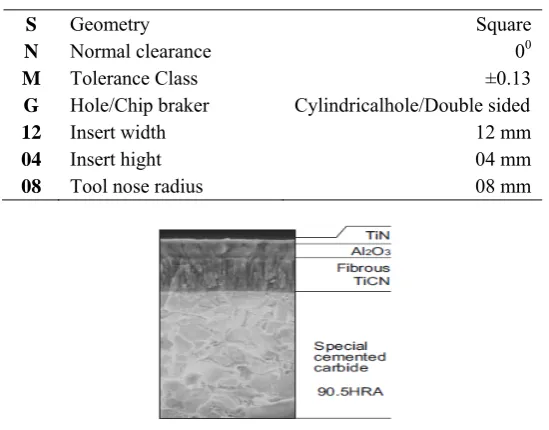
The CVD coated carbide designation SNMG 120408 inserts used for machining.
Table 3: The carbide cutting tool designation
Fig: 1 Microstructure of US7020 grade ( Misubishi )
4.2. Design of experiment
The following cutting conditions were employed in this investigation. Three level two factorial DOE is prepared with constant depth of cut. Surface roughness and material removal rate are the machining responses.
S Geometry Square
N Normal clearance 00
M Tolerance Class ±0.13
G Hole/Chip braker Cylindricalhole/Double sided
12 Insert width 12 mm
04 Insert hight 04 mm
Table 3: Machining parameters for inconel 718
• Cutting speed (m min−1): 30, 50, 70.
• Feed rate (mm rev−1): 0.1, 0.15, 0.2.
• Depth of cut (mm): 0.2.
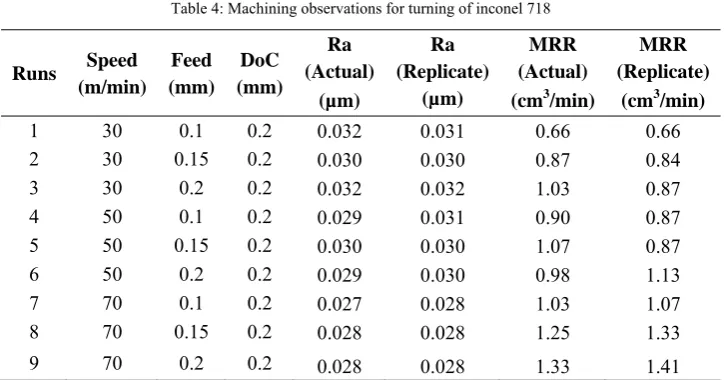
Table 4: Machining observations for turning of inconel 718
Runs Speed
(m/min) Feed (mm)
DoC (mm)
Ra (Actual)
Ra (Replicate)
MRR (Actual)
MRR (Replicate)
(µm) (µm) (cm3/min) (cm3/min)
1 30 0.1 0.2 0.032 0.031 0.66 0.66
2 30 0.15 0.2 0.030 0.030 0.87 0.84
3 30 0.2 0.2 0.032 0.032 1.03 0.87
4 50 0.1 0.2 0.029 0.031 0.90 0.87
5 50 0.15 0.2 0.030 0.030 1.07 0.87
6 50 0.2 0.2 0.029 0.030 0.98 1.13
7 70 0.1 0.2 0.027 0.028 1.03 1.07
8 70 0.15 0.2 0.028 0.028 1.25 1.33
9 70 0.2 0.2 0.028 0.028 1.33 1.41
4.2.1 Regression Analysis and ANOVA: Ra versus Speed, Feed
Linear regression investigates and models the linear relationship between a response (Ra) and predictor(s) (Speed, Feed). ANOVA was carried out to know the contribution of machining parameters on Ra. Both the response and predictors are continuous variables. In this particular, linear regression analysis is used to: To determine how the response variable changes as a particular predictor variable changes. To predict the value of the response variable for any value of the predictor variable, or combination of values of the predictor variables the regression equation is Ra = 0.0335 - 0.000083 Speed + 0.00167 Feed
Table 5: Regression coefficients Ra
Predictor Coef SE Coef T P
0.0335278 0.0008852 37.88 0.000 Speed -0.00008333 0.00001109 -7.51 0.000
Feed 0.001667 0.004437 0.38 0.712 S = 0.000768597 R-Sq = 79.0% R-Sq (adj) = 76.2%
The R2 and adjusted R2 values represent the proportion of variation in the response data explained by the predictors. R (R-Sq) describes the amount of variation in the observed Ra values that is explained by the predictor(s). For the machining with CVD coated, the predictors (Speed, Feed) explain 79% of variation in the Rating observations. Adjusted R is a modified R that has been adjusted for the number of terms in the model. For the machining data, the adjusted R2 is 76.2%, which is a decrease of 2.8% The Lack of Fit p-value < 0.05 indicates that the linear predictors are sufficient.
Table 6: Analysis of variance Ra
Source DF SS MS F P
Speed 2 0.0000338 0.0000169 43.43 0.000 Feed 2 0.0000008 0.0000004 1.00 0.405 Interaction 4 0.0000042 0.0000011 2.71 0.098
Error 9 0.0000035 0.0000004
Total 17 0.0000423
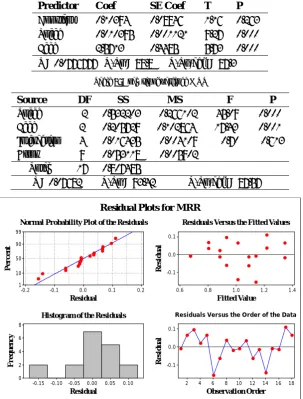
Fig. 2 Residual Plots for Ra
4.2.2 Regression Analysis and ANOVA: MRR versus Speed, Feed
Linear regression investigates and models the linear relationship between a response (MRR) and predictor(s) (Speed, Feed). ANOVA was carried out to know the contribution of machining parameters on MRR. The regression equation MRR = 0.104 + 0.0104 Speed + 2.57 Feed
Table 7: Regression coefficients MRR
Predictor Coef SE Coef T P
Constant 0.10394 0.08946 1.16 0.263 Speed 0.010395 0.001121 9.27 0.000 Feed 2.5713 0.4485 5.73 0.000 S = 0.0776777 R-Sq = 88.8% R-Sq(adj) = 87.3%
Table 8: Analysis of variance MRR
Source DF SS MS F P
Speed 2 0.532203 0.266102 45.09 0.000 Feed 2 0.205729 0.102864 17.43 0.001
Interaction 4 0.016435 0.004109 0.70 0.613
Error 9 0.053118 0.005902
Total 17 0.807485
S = 0.07682 R-Sq = 93.42% R-Sq(adj) = 87.57%
Residual
P
erce
n
t
0.2 0.1 0.0 -0.1 -0.2 99
90
50
10
1
Fitted Value
Re
si
du
a
l
1.4 1.2 1.0 0.8 0.6 0.1
0.0
-0.1
Residual
Fre
q
u
e
n
cy
0.10 0.05 0.00 -0.05 -0.10 -0.15 8
6
4
2
0
Observation Order
R
e
si
dua
l
18 16 14 12 10 8 6 4 2 0.1
0.0
-0.1
Normal Probability Plot of the Residuals Residuals Versus the Fitted Values
Histogram of the Residuals Residuals Versus the Order of the Data
4.2.3 Taguchi Analysis and ANOVA: MRR versus Speed, Feed
Dr. Genichi Taguchi is regarded as the foremost proponent of robust parameter design, which is an engineering method for product or process design that focuses on minimizing variation and/or sensitivity to noise. When used properly, Taguchi designs provide a powerful and efficient method for designing products that operate consistently and optimally over a variety of conditions. The goal of robust experimentation is to find an optimal combination of control factor settings that achieve robustness against (insensitivity to) noise factors.
Table 9: Natural log of the standard deviations vs. the control factors
Responses S/N ratio formulas Use when the goal is to... Probable Data
Ra -Smaller is better S/N=-10log (ΣY2)/n))
Minimize the response Non-negative with a target value of zero
MRR - Larger is better S/N=-10log (Σ 1/Y2)/n) Maximize the response Positive
Linear Model Analysis: SN ratios versus Speed, Feed
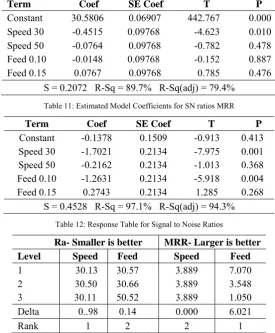
Table 10: Estimated Model Coefficients for SN ratios Ra
Term Coef SE Coef T P
Constant 30.5806 0.06907 442.767 0.000 Speed 30 -0.4515 0.09768 -4.623 0.010 Speed 50 -0.0764 0.09768 -0.782 0.478 Feed 0.10 -0.0148 0.09768 -0.152 0.887 Feed 0.15 0.0767 0.09768 0.785 0.476
S = 0.2072 R-Sq = 89.7% R-Sq(adj) = 79.4%
Table 11: Estimated Model Coefficients for SN ratios MRR
Term Coef SE Coef T P
Constant -0.1378 0.1509 -0.913 0.413 Speed 30 -1.7021 0.2134 -7.975 0.001 Speed 50 -0.2162 0.2134 -1.013 0.368 Feed 0.10 -1.2631 0.2134 -5.918 0.004 Feed 0.15 0.2743 0.2134 1.285 0.268
S = 0.4528 R-Sq = 97.1% R-Sq(adj) = 94.3%
Table 12: Response Table for Signal to Noise Ratios
Ra- Smaller is better MRR- Larger is better
Level Speed Feed Speed Feed
1 30.13 30.57 3.889 7.070
2 30.50 30.66 3.889 3.548
3 30.11 50.52 3.889 1.050
Delta 0..98 0.14 0.000 6.021
Rank 1 2 2 1
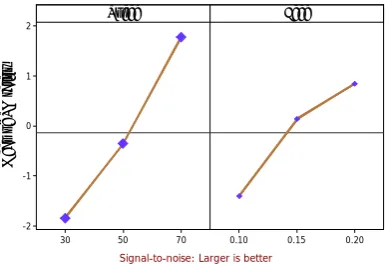
M ean o f S N r atio s 70 50 30 31.2 31.0 30.8 30.6 30.4 30.2 30.0 0.20 0.15 0.10 Speed Feed
Signal-to-noise: Smaller is better
M ea n of S N r at ios 70 50 30 2 1 0 -1 -2 0.20 0.15 0.10 Speed Feed
Signal-to-noise: Larger is better
Fig. 4 Main Effects Plot for Ra (data means) for SN ratios Fig.5.Main Effects Plot for MRR (data means) for SN ratios
Feed S p eed 0.20 0.18 0.16 0.14 0.12 0.10 70 60 50 40 30 Q3
1.0 - 1.2 1.2 - 1.4 > 1.4 < 0.8 0.8 - 1.0
Fig. 6 Contour Plot of Ra and MRR vs. Speed, Feed
Fig 7 .Surface Plot of Ra and MRR vs. Speed, Feed
5. Adaptive Neuro-Fuzzy Inference System (ANFIS)- Predictive Modeling
Fuzzy logic is a convenient way to map input characteristics to output responses. In this work concept of fuzzy approach and development of predictive ANFIS model for surface roughness response at various speed and feed condition are discussed. The MATLAB 7.0 based Graphical User Interface (GUI) has been used to develop and test for its ability in modeling for machining by Adaptive Network-based Fuzzy Inference system (ANFIS). It has been validated to be capable of testing the best variable setting of the intended model in ANFIS environment ANFIS model developed with number 35 of nodes, 9 numbers of linear parameters, 18 numbers of nonlinear parameters, 27 total numbers of parameters,18 numbers of training data pairs 9, and number of fuzzy rules.
5.1Fuzzy inference system
Fuzzy inference is the process of formulating the mapping from a given input cutting speed, feed to an output Ra and MRR using fuzzy logic. The mapping then provides a basis from which decisions can be made, or patterns discerned Mamdani's fuzzy inference method is the most commonly seen fuzzy methodology. Mamdani's method was among the first control systems built using fuzzy set theory. It was proposed in 1975 by Ebrahim Mamdani. This model of machining describes the fuzzy inference process and uses the example of the
Feed Spe ed 0.20 0.18 0.16 0.14 0.12 0.10 70 60 50 40 30 Ra
Fig 8.ANFIS model
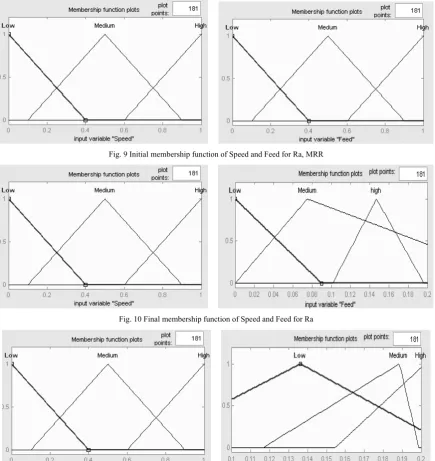
5.1 Fuzzymembership functions
A membership function (MF) is a curve that defines how each point in the input space is mapped to a membership value figure shows initial and final membership factions for Ra and MRR.
Fig. 9 Initial membership function of Speed and Feed for Ra, MRR
Fig. 10 Final membership function of Speed and Feed for Ra
5.1 Combined fuzzy rules
The permutation combination for each individual responses ANFS forms fuzzy rules. In the rule viewer predicted response output surface roughness for random values of input variable speed and feed observed.
1. If (Speed is Low) and ( Feed is Low) then Ra/MRR is out 1mf1 2. If (Speed is Low) and ( Feed is Medium) then Ra/MRR is out 1mf2 3. If (Speed is Low) and ( Feed is High) then Ra/MRR is out 1mf3 4. If (Speed is Medium) and ( Feed is Low) then Ra/MRR is out 1mf4 5. If (Speed is Medium) and ( Feed is Medium) then Ra/MRR is out 1mf4 6. If (Speed is Medium) and ( Feed is High) then Ra/MRR is out 1mf6 7. If (Speed is High) and ( Feed is Low) then Ra/MRR is out 1mf7 8. If (Speed is High) and ( Feed is Medium) then Ra/MRR is out 1mf8 9. If (Speed is High) and ( Feed is High) then Ra/MRR is out 1mf9
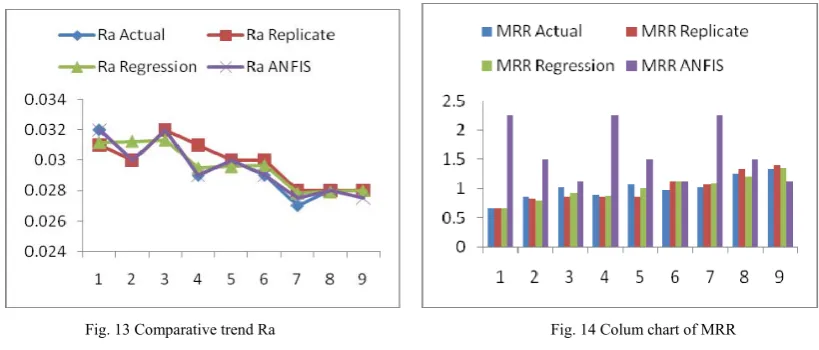
Table 12: Response Table of predicted values of Ra and MRR
Runs Speed
(m/min) Feed (mm) DoC (mm) Ra (Actual) Ra (Replicate) Ra (Regression) Ra (ANFIS) MRR (Actual) MRR (Replicate) MRR (Regression) MRR (ANFIS)
(µm) (µm) (µm) (µm) (cm3
/min) (cm3/min) (cm3/min) cm3/min)
1 30 0.1 0.2 0.032 0.031 0.031 0.032 0.66 0.66 0.67 2.26
2 30 0.15 0.2 0.030 0.030 0.031 0.030 0.87 0.84 0.80 1.50
3 30 0.2 0.2 0.032 0.032 0.031 0.032 1.03 0.87 0.93 1.13
4 50 0.1 0.2 0.029 0.031 0.030 0.029 0.90 0.87 0.88 2.26
5 50 0.15 0.2 0.030 0.030 0.030 0.030 1.07 0.87 1.01 1.50
6 50 0.2 0.2 0.029 0.030 0.030 0.029 0.98 1.13 1.14 1.13
7 70 0.1 0.2 0.027 0.028 0.028 0.0275 1.03 1.07 1.09 2.26
8 70 0.15 0.2 0.028 0.028 0.028 0.028 1.25 1.33 1.22 1.50
9 70 0.2 0.2 0.028 0.028 0.028 0.0275 1.33 1.41 1.35 1.13
6. Interpretation and results
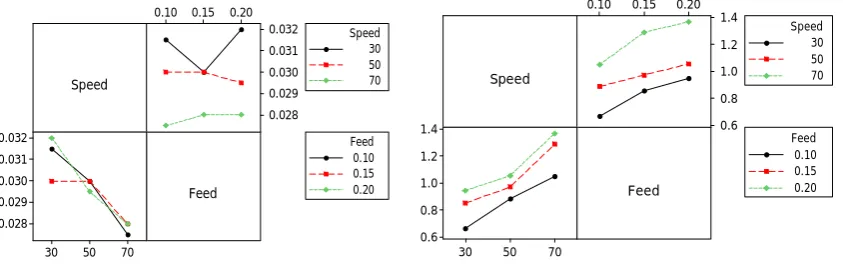
Interactive plot of Ra vs. Speed feed shows roughness is minimum at the speed 70 m/min with feed 0.1 mm/rev. whereas material removal rate is maximum at the speed 70 m/min with feed 0.2 mm/rev.
Speed Feed 0.20 0.15 0.10 0.032 0.031 0.030 0.029 0.028 70 50 30 0.032 0.031 0.030 0.029 0.028 Speed 70 30 50 Feed 0.20 0.10 0.15 Speed Feed 0.20 0.15 0.10 1.4 1.2 1.0 0.8 0.6 70 50 30 1.4 1.2 1.0 0.8 0.6 Speed 70 30 50 Feed 0.20 0.10 0.15
Fig. 12 Interactive plot of Ra and MRR
Fig. 13 Comparative trend Ra Fig. 14 Colum chart of MRR
7. Conclusion
The economic consideration, uncoated carbide tools are attracted and they give a better performance with respect to different cutting speeds and feed rates. Artificial intelligence approach provides better model adequacy and follows pattern in machining of inconel 718. ANFIS and statistical models give barer agreement for machining responses. Fuzzy based prediction allows finding in between solution for selection of machining parameters on the basis of predicted responses. The virtual identification of responses allows avoiding various actual machining trials for highly expensive material like inconel 718.
Acknowledgments
Author thanks to COET Akola for research laboratory facility. Nashik Auto Cluster for experimentation support.
References
[1] Herbert L. Eiselstein, Age-hardenable nickel alloy. U.S. Patent, 3046108, 1962.
[2] Liao Y. S., Shiue R. H., “Carbide tool wear mechanism in turning of Inconel 718 superalloy”, Wear, 193, (1996), pp. 16–24. [3] Rahman M., Seah W.,Teo T. “The machinability of Inconel 718”, Journal of Materials Processing Technology 63,(1997), pp.199–204. [4] T. Kitagawa, A. Kubo, K. Maekawa, “Temperature and wear of cutting tools in high speed machining of Inconel 718 and Ti–6Al–6V–
2Sn”, Wear 202 (1997) 142–148.
[5] Choudhoury IA, El-Baradie MA. “Machinability of nickel-base super alloys: a general review. Materials Processing Technology” (1998), 77:278–284.
[6] P.C. Jindal, A.T. Santhanam, U. Schleinkofer, A.F. Shuster, “Performance of PVD TiN, TiCN and TiAlN coated cemented carbide tools in turning”, International Journal of Refractory Metals and Hard Materials 17 (1999) 163–170.
[7] E.O. Ezugwu, Z.M. Wang, A.R. Machado, “The machinability of nickel-based alloys: a review”, Journal of Materials Processing Technology 86 (1999), 1-16.
[8] K. Itakura, M. Kuroda, H. Omokawa, H. Itani, K. Yamamoto, Y. Ariura, Wear mechanism of coated cemented carbide tool in coated tool in cutting of Inconel 718 super-heat resisting alloy, International Journal of Japanese Society for Precision Engineering 33 (4) (December 1999) 326–333.
[9] C.A.Dandre, C.A.Walsh, R.W.Evans, R.C.Reed, and S.M.Roberts. “Microstructural evolution of nickel-base superalloy forgings during ingot-to-billet conversion: process modelling and validation”. In T.M.Pollock et al, editor, Superalloys (2000), TMS, USA, pages 85–94, 2000.
[10] 66 Mason, Wayne, “Inserts For Difficult Materials,” Modern Machine Shop, January 2002, pp. 82-86.
[11] Ship-Peng Lo, “An adaptive-network based fuzzy inference system for prediction of work piece surface roughness in end milling”,Journal of Materials Processing Technology 142, pp. (2003) 665–675
[12] Ezugwu E. O., “Key improvements in the machining of aero-engine alloys using self-propelled rotary tooling technique”, Journal of Materials Processing Technology 185, (2007), pp. 60–71
[13] R.Schafrik and R.Sprague. “The saga of gas turbine materials. Advanced Materials and Processes”, 162:3:33–36, 4:27–30, 5:29–33, 6:41–46, 2004.
[14] D. Dudzinski et at. (2004),Dudzinski A., Devillez A., Moufki A, Larrouque`re D, Zerrouki V., Vigneau J., “A review of developments towards dry and high speed machining of Inconel 718 alloy”, International Journal of Machine Tools & Manufacture 44 (2004) 439– 456
[15] Ezugwu, E.O., Bonney,J., Fadare,D.A., Sales, W. F. “Machining nickel-base, Inconel 718, alloy with ceramic tools under conditions with various coolant supply pressures”, Jour. of Mater. Proc. Tech., vol. 162–163, (2005), p. 68-73
[16] Sharman ARC, Hughes JI, Ridgway K. “An analysis of the residual stresses generated in Inconel 718 when turning”. Journal of Materials Processing Technology (2006); 173:359–367.
[17] Devillez, A., Schneider,F., Dominiak,S., Dudzinski, D., Larrouquere, D. “Cutting forces and wear in dry machining of Inconel 718 with coated carbide tools”. Wear (2007) 262, 931–942.
[18] Altin , M. Nalbant , A. Taskesen , “The effects of cutting speed on tool wear and tool life when machining Inconel 718 with ceramic tools”, Materials and Design 28 (2007) 2518–2522
[19] Thakur, D. G., Ramamoorthy B. Optimization of Minimum Quantity Lubrication Parameters in High Speed Turning of Inconel 718 for Sustainable Development”, World Academy of Science, Engineering and Technology 54 (2009) 224-226
[20] Senthilkumaar JS, Selvarani P, Arunachalam RM. “Intelligent optimization and selection of machining parameters in finish turning and facing of Inconel 718”. The International Journal of Advanced Manufacturing Technology (2012); 58:885–894