Primary Prevention of Childhood Lead Exposure: A Randomized
Trial of Dust Control
Bruce P. Lanphear, MD, MPH*‡; Cynthia Howard, MD, MPH‡; Shirley Eberly, MS§; Peggy Auinger, MS‡;
John Kolassa, PhD§; Michael Weitzman, MD‡; Stanley J. Schaffer, MD, MS‡; and Keith Alexander, BS‡
ABSTRACT. Background. Dust control is
recom-mended as one of the primary strategies to prevent or control children’s exposure to residential lead hazards, but the effect of dust control on children’s blood lead levels is poorly understood.
Objective. To determine the effectiveness of dust control in preventing children’s exposure to lead, as mea-sured by blood lead levels, during their peak age of susceptibility.
Design. A randomized, controlled trial.
Setting. Rochester, NY.
Participants. A total of 275 urban children were ran-domized at 6 months of age, of whom 246 (90%) were available for the 24-month-old follow-up visit.
Interventions. Children and their families were ran-domly assigned to an intervention group (n5140), which received cleaning equipment and up to eight visits by a dust control advisor, or a control group (n5135).
Outcome Measures. Geometric mean blood lead lev-els and prevalence of elevated blood lead levlev-els (ie,>10 mg/dL, 15mg/dL, and 20mg/dL).
Results. At baseline, children’s geometric mean blood lead levels were 2.9mg/dL (95% confidence inter-val [CI]52.7, 3.1); there were no significant differences in characteristics or lead exposure by group assignment, with the exception of water lead levels. For children in the intervention group, the mean number of visits by a dust control advisor during the 18-month study period was 6.2; 51 (36%) had 4 to 7 visits, and 69 (49%) had 8 visits. At 24 months of age, the geometric mean blood lead was 7.3mg/dL (95% CI56.6, 8.2) for the intervention group and 7.8 mg/dL (95% CI5 6.9, 8.7) for the control group. The percentage of children with a 24-month blood lead >10 mg/dL, >15 mg/dL, and >20 mg/dL was 31%
versus 36%, 12% versus 14%, and 5% versus 7% in the intervention and control groups, respectively.
Conclusions. We conclude that dust control, as per-formed by families and in the absence of lead hazard controls to reduce ongoing contamination from lead-based paint, is not effective in the primary prevention of childhood lead exposure. Pediatrics 1999;103:772–777;
blood lead, lead-contaminated house dust, randomized trial, children, environmental exposure, lead poisoning, primary prevention, prevention.
ABBREVIATION. CI, confidence interval.
S
ubclinical lead toxicity, estimated to affect
.
11% of urban children in the United States
and 22% of urban children who are of black
race, remains a serious health problem.
1The
prepon-derance of both epidemiologic and experimental
an-imal studies show serious deleterious effects of
low-level lead exposure on brain function, especially in
early life.
2–11Moreover, the effects of such exposure
seem to be irreversible.
2,4,9,12Collectively, the results
of these studies argue that efforts to prevent
neuro-cognitive impairment associated with lead exposure
should emphasize primary prevention. This
con-trasts sharply with current practices and policies that
rely almost exclusively on secondary and tertiary
prevention efforts. Unfortunately, there is limited
data demonstrating effective ways to prevent
child-hood exposure to residential sources of lead.
Children are exposed to lead from multiple
sources. Currently, the most important sources
in-clude lead-contaminated paint, house dust, and
soil.
13–16Historically, motor vehicle emissions were a
major source of lead exposure, but their contribution
to children’s blood lead levels has diminished since
the elimination of leaded gasoline.
17–19Although
chil-dren’s blood lead levels have declined sharply, a
high percentage of children living in older housing
that is in poor condition or undergoing renovation
remain at substantial risk for undue lead exposure
from residential sources.
20 –22For these children,
lead-contaminated house dust is a major source of lead
intake.
13–16,23The effectiveness of dust control, which is
recom-mended by both the Centers for Disease Control and
Prevention and the American Academy of Pediatrics
as one of the primary strategies to prevent or control
children’s exposure to residential lead hazards, is
poorly defined.
24 –26Combined with abatement, dust
control has been shown to be efficacious in reducing
blood lead levels for children with blood lead levels
of 30
m
g/dL or higher.
23In contrast, trials of dust
control involving children who had blood lead levels
that were
,
25
m
g/dL have not consistently
demon-strated a reduction in blood lead levels.
27,28The purpose of this study, the first reported
at-tempt to conduct a primary prevention trial aimed at
residential lead exposure in children, was to assess
the effectiveness of dust control in preventing
chil-From the *Children’s Hospital Medical Center and the Department ofPediatrics, University of Cincinnati, Cincinnati, Ohio; and the Departments of ‡Pediatrics and §Biostatistics at the University of Rochester School of Medicine and Dentistry, Rochester, New York.
Received for publication Jul 6, 1998; accepted Sep 7, 1998.
Reprint requests to (B.P.L.) Division of General and Community Pediatrics, Children’s Hospital Medical Center, 3333 Burnet Ave, Cincinnati, OH 45229-3039.
dren’s exposure to lead, as measured by blood lead
levels, during their peak age of susceptibility.
METHODS
Children and their families were eligible for the study if: they lived in the city of Rochester, NY; they denied having plans to relocate in the next 3 months; and they were older than 5 months but less than 7 months of age at the time of the baseline visit. Study participants were identified and recruited by using sequential lists of live births from three urban hospitals. After the combined list was checked for errors, the entries were ordered chronologically and current addresses and phone numbers were obtained by using information from three hospitals, four inner-city clinics, and the Monroe County Department of Social Services and Health Department. To determine eligibility, interviewers dialed each telephone number until the family was contacted or until at least six calls were made. Once a family was deemed eligible and agreed to participate, a study team visited their home, obtained informed consent, conducted an interview, and collected a blood sample and environmental samples. The University of Rochester Investigation Review Board and Rochester General Hospital’s Clinical Investigations Committee approved the study.
Home visits were made to families in both groups at baseline (6 months) and when the child reached 12, 18, and 24 months of age. During each of the four home visits, a trained interviewer who was blinded to the treatment status of the families conducted a face-to-face survey to assess factors that might bear on a child’s contact with various sources of lead. Demographic information that was obtained included: maternal level of education, occupa-tion, race, income level, marital status, and age of the mother or respondent. Smoking among members of the household and type of health insurance also were documented. Each respondent was interviewed to identify the type and frequency of cleaning, the last time cleaning was performed, any renovation or painting in the dwelling, and the use of ceramic pottery or folk medicines.
After baseline sampling, families and their children were ran-domly assigned to an intervention group or a control group. Families in the intervention group received up to eight visits by one of two randomly assigned dust control advisors, cleaning equipment and supplies (broom; dust pan; sponge mop with replacement heads; rubber gloves; a double bucket; and Lead-Away (Lead-Lead-Away Co, Lynn, MA), a detergent containing tri-sodium phosphate). All equipment was replaced, as needed, and supplies were replenished during the dust control advisor’s rou-tine visits. The dust control advisors were trained to use an edu-cational model described as facilitation, which was developed specifically for home visitation.29,30Families in the control group
did not receive any lead exposure prevention education or inter-ventions.
Children’s blood lead levels, measured at baseline and at 6-month intervals (ie, at 6, 12, 18, and 24 months of age) were the primary measure used to evaluate the effect of dust control. Ve-nous samples for children’s blood lead were obtained by using techniques to ensure minimal extraneous lead contamination. Blood lead was determined by using Electrothermal Atomization Atomic Absorption Spectrometry (New York State Department of Health, Wadsworth Laboratories, Albany, NY). All reported re-sults are the means of six separate analyses (3 aliquots/day mea-sured on 2 consecutive days) performed on each blood sample. The routine within-run precision, expressed as standard devia-tion, was 0.23 to 0.26mg/dL, and the between-run precision, based on duplicate measurements throughout 5 days, ranged from 0.1 to 0.5mg/dL for blood lead concentrations,20mg/dL. The detec-tion limit for lead in blood was 1mg/dL.
Dust sampling was conducted to characterize the potential exposure of children to lead from dust in their environment, to measure the effectiveness of dust control, and to serve as an indicator of adherence with the prescribed cleaning regimen.31
Briefly, in each house a total of three to four composite interior dust wipe samples were taken from surfaces that were accessible to the child (ie, floors and interior window sills) and those known to be heavily contaminated with lead (window wells or troughs). A composite dust sample consisted of a maximum of three wipe samples collected from the same type of surface (ie, carpeted floor, noncarpeted floor, interior window sill or window troughs). Dust samples were collected from: the child’s bedroom, the kitchen, and the living room. The midpoint of the largest area in the room was
selected for floor sampling. Dust samples were collected by an experienced technician who was blind to intervention status, at baseline and 6-month intervals (ie, when the children were 6, 12, 18, and 24 months of age).
Lead content of interior and exterior painted surfaces was measured for each housing unit by using a portable radiograph fluorescence analyzer (Microlead I, Warrington, Inc, Austin, TX). For each house, measurements of at least one window and one wall were obtained from the kitchen, the child’s bedroom, the principal play area of the child, and the entryway of the housing unit. At each location, three readings were made and then aver-aged for the building component. The condition of painted sur-faces was done by visual inspection using a scale previously shown by us to be highly correlated with dust lead levels.32Paint
condition was categorized as poor (.15% deteriorated, defined as
.15% paint is peeling, chalking, or flaking), fair (5–15% deterio-rated), and good (,5% deteriorated).
Soil and water samples were also collected to measure lead exposure from these sources. Using a 1/2 inch coring device, three samples of soil were taken on each side of the house around the perimeter of the foundation where bare soil was present. These samples were combined for a single composite foundation sample. All soil samples consisted of the top 1/2 inch of soil, which was homogenized and sieved to obtain a coarse fraction by using a 2-mm sieve. The parent collected one 1-liter water sample, con-sisting of a 1-minute morning flush sample, from the kitchen tap. Laboratory analyses for environmental samples were done as follows. Dust samples were analyzed first by flame atomic absorp-tion, followed by graphite furnace if levels were below detection limits for flame atomic absorption. The detection limit using flame atomic absorption was 25mg/sample; for graphite furnace, the detection limit for the wipe was 0.5mg/sample. Soil was analyzed separately by using flame atomic absorption spectroscopy, with a detection limit for lead in soil samples of 25mg/g. Water was analyzed by using atomic absorption, with a detection limit of 5mg/L.
To examine whether the regular visits and dust sampling in-troduced a Hawthorne effect, we used birth certificate data to construct a negative-control group. We attempted to match 2 nonstudy children for each child in the study. Children were matched by race, month of birth, and poverty level. Poverty level was measured by census block group characteristics. The geomet-ric mean blood lead level of 24-month-old children (61 month) in the nonstudy group were obtained from a county-wide blood lead surveillance system,22 and were compared with the geometric
mean blood lead level for study children when they attained 24 months of age.
Statistical Analyses
The effect of dust control was estimated a priori to be 20%, which is similar to an effect size observed in an earlier study.23
Based on this effect size, a sample size of 260 children (130 in each arm) with an arithmetic mean blood lead level of 9.2mg/dL was determined to be needed to detect a 20% difference in blood lead levels at 24 months of age, with 80% confidence anda 50.05 (two-sided test).
The distributions of continuous variables were examined to determine whether particular variables should be log trans-formed. For all statistical analyses, children’s blood lead levels, children’s serum ferritin levels, and soil lead measurements were log transformed. Dust lead loading measurements for each surface were standardized to 1 square foot and log transformed. For the purpose of statistical analysis, the carpeted and noncarpeted floor samples were combined to form a single floor dust lead variable. A paint lead index variable was created by multiplying the paint condition (good51, average52, or poor53) by the paint lead measurement; the resulting index value was then log transformed. Because of the high undetectable rate of lead in water, the water lead variable was dichotomized as greater than or less than the detection limit.
Baseline comparability of the intervention and control groups was evaluated by x2 tests, Fisher’s exact tests, and t tests, as
Differences between blood lead levels among children from 6 to 24 months of age in the intervention and control groups were tested by using thettest. A multiple regression model was devel-oped to predict change in blood lead levels. Using prespecified baseline variables, a backward selection process was used to iden-tify significant predictors of changes in blood lead levels; the intervention group variable was forced into the model during the selection process.
Three factors that might influence the effectiveness of the in-tervention were separately added to the final multiple regression model: 1) whether or not the child moved during the study; 2) the number of visits made to the intervention household by the dust control advisor; and 3) the amount of detergent supplied to the intervention household. These latter two variables replaced the intervention variable in the model, with detergent and visit vari-ables set to zero for the control group.
Additional secondary analyses included: 1) a repeated mea-sures model using blood lead measurements from all four sam-pling periods; and 2) analysis of variance for further exploration of the effects of moving, detergent use, number of intervention visits, and random assignment to one of two dust control advisors. Twenty-four month blood lead levels of children in the negative control (ie, nonstudy) group were compared with those of chil-dren in the study by using a t test. AllP values reported are two-sided. Statistical analyses were not adjusted for multiple com-parisons.
RESULTS
Two hundred seventy-five children were enrolled
in the trial at 6 months of age. Two hundred and
forty-eight children (90%) completed the trial. There
was no difference in attrition by study group; 13 (9%)
of 140 children in the intervention group were lost to
follow-up compared with 14 (10%) of 135 in the
control group (
P
5
.76).
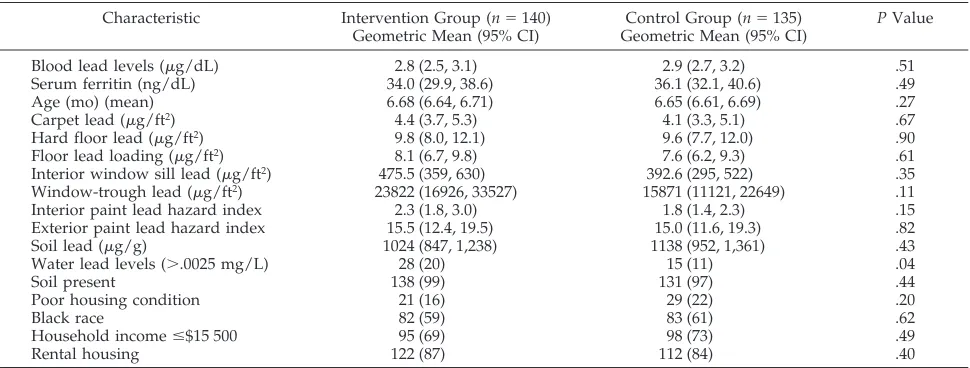
Comparisons of baseline characteristics for the
in-tervention and control groups are shown. (Table 1)
The geometric mean blood lead levels for children in
the intervention and control groups were 2.8
m
g/dL
(95% confidence interval [CI]
5
2.5, 3.1) and 2.9
m
g/dL (CI
5
2.7, 3.2), respectively (
P
5
.51). The
percent of children with detectable water lead levels
was slightly higher in the intervention group than
the control group (20% vs 11%, respectively,
P
5
.042). There were no statistically significant
differ-ences for other baseline variables.
For children in the intervention group, the mean
number of visits by a dust control advisor during the
18-month study period was 6.2. Fifty-one (36%)
chil-dren and their families had four to seven visits and
69 (49%) had eight visits.
There was no significant difference in blood lead
levels by intervention status. The geometric mean
blood lead levels for children at 24 months of age in
the intervention and control groups were 7.3
m
g/dL
(CI
5
6.6, 8.2) and 7.8
m
g/dL (CI
5
6.9, 8.7),
respec-tively (
P
5
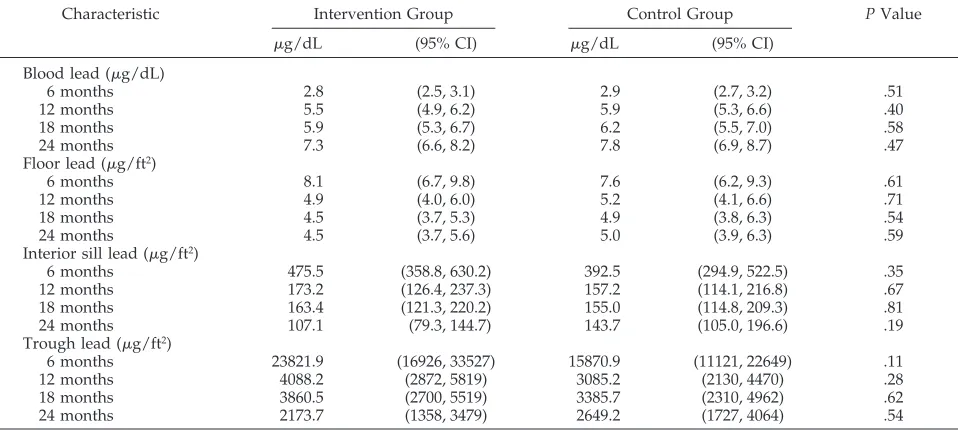
.47) (Fig 1). Comparisons of the blood
lead levels of the children by group assignment at 12
and 18 months of age also were nonsignificant (Table
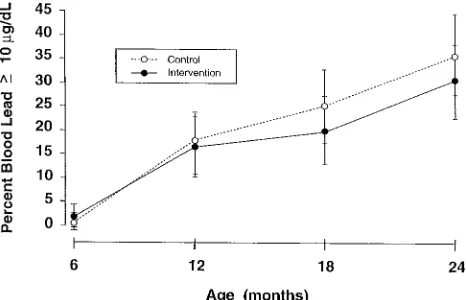
2). Although the percentages of children with
ele-vated blood lead levels at 24 months were generally
lower in the intervention group, these differences
were not significant (Table 3, Fig 2).
Similarly, there was no significant effect of the
intervention on the mean increase in blood lead
lev-els from 6 to 24 months of age (
1
5.6
m
g/dL in the
intervention group vs
1
6.3
m
g/dL in the control
group,
P
5
.42). Adjustment using pertinent baseline
variables, including water lead concentration, did
not alter this conclusion, nor did adjustment for
moving. Replacement of the intervention variable by
detergent use or by number of intervention visits did
not lead to significant results (Table 4). Repeated
measures analysis of the blood lead data from all
four time points did not demonstrate a significant
effect of the intervention (
P
5
.49). Analysis of
vari-ance examining the effects on 24-month blood lead
levels of moving, detergent use, and the number of
intervention visits also did not yield significant
re-sults, nor were there significant differences by dust
control advisor.
Dust lead levels declined sharply in both the
in-tervention and control groups (Table 2). There was
no significant difference in dust lead levels at 24
months by group, nor was there a difference in the
change in dust lead levels from 6 to 24 months by
group.
Twenty-four-month blood lead levels for the 336
children in the matched nonstudy cohort (ie,
nega-tive controls) were similar to those for children who
participated in the study. The geometric mean blood
TABLE 1. Baseline Comparisons of 275 Children Enrolled in the Dust Control Intervention Study by Group Assignment
Characteristic Intervention Group (n5140) Geometric Mean (95% CI)
Control Group (n5135) Geometric Mean (95% CI)
PValue
Blood lead levels (mg/dL) 2.8 (2.5, 3.1) 2.9 (2.7, 3.2) .51
Serum ferritin (ng/dL) 34.0 (29.9, 38.6) 36.1 (32.1, 40.6) .49
Age (mo) (mean) 6.68 (6.64, 6.71) 6.65 (6.61, 6.69) .27
Carpet lead (mg/ft2) 4.4 (3.7, 5.3) 4.1 (3.3, 5.1) .67
Hard floor lead (mg/ft2) 9.8 (8.0, 12.1) 9.6 (7.7, 12.0) .90
Floor lead loading (mg/ft2) 8.1 (6.7, 9.8) 7.6 (6.2, 9.3) .61
Interior window sill lead (mg/ft2) 475.5 (359, 630) 392.6 (295, 522) .35
Window-trough lead (mg/ft2) 23822 (16926, 33527) 15871 (11121, 22649) .11
Interior paint lead hazard index 2.3 (1.8, 3.0) 1.8 (1.4, 2.3) .15
Exterior paint lead hazard index 15.5 (12.4, 19.5) 15.0 (11.6, 19.3) .82
Soil lead (mg/g) 1024 (847, 1,238) 1138 (952, 1,361) .43
Water lead levels (..0025 mg/L) 28 (20) 15 (11) .04
Soil present 138 (99) 131 (97) .44
Poor housing condition 21 (16) 29 (22) .20
Black race 82 (59) 83 (61) .62
Household income#$15 500 95 (69) 98 (73) .49
Rental housing 122 (87) 112 (84) .40
lead level at 24 months of age was 7.3
m
g/dL (
6
2.2
m
g/dL) for the 336 matched negative-controls
com-pared with 7.5
m
g/dL (
6
1.9
m
g/dL) for the 245 study
children (
P
5
.14).
DISCUSSION
The findings of this study indicate that, despite
intense efforts to inform families about lead
poison-ing prevention, offer recommendations for cleanpoison-ing
techniques to reduce dust lead levels, and provide
high quality cleaning equipment and supplies, there
was no significant effect on children’s blood lead
levels. There also were no differences in the percent
of children who had elevated blood lead levels or the
levels of lead-contaminated house dust by group
assignment. Thus, although there is some evidence
that dust control, when combined with abatement
and performed by professional cleaners, is associated
with a reduction in blood lead levels for children
who have moderately to severely elevated blood lead
levels, the results of this study suggest that dust
control, if performed by families, is not effective in
the primary prevention of childhood lead exposure.
Other dust control trials have not demonstrated a
reduction in blood lead levels. In a randomized trial
of dust control among 111 children, 6 to 70 months of
age, in which a professional cleaner conducted
HEPA vacuuming every 6 weeks throughout a
10-month period, Hilts et al
28reported no significant
reduction in the blood lead levels of children
as-signed to the intervention group compared with
those in the control group. In a randomized trial of
dust control involving 94 children, 12 to 31 months of
age, there also was no significant difference in blood
lead levels 7 months after enrollment.
27In contrast, in
a study of dust control combined with behavioral
modifications, Schultz reported a significant (17%)
decline in blood lead levels among children who had
blood lead levels of 20 to 24
m
g/dL, compared with
a historical control group.
33Because of secular trends
in children’s blood lead levels, this latter study
should be interpreted cautiously.
Residential lead hazard controls (eg, abatement,
encapsulation, dust control) are being implemented
on a national scale, but there is limited data to
dem-onstrate their effectiveness in preventing lead
expo-sure, as measured by children’s blood lead levels. In
fact, studies indicate that some lead hazard controls
are actually hazardous for children who have low to
moderate elevations blood lead levels (ie,
,
25
m
g/
dL).
34 –36Thus, it is unclear whether existing lead
hazard controls for children who have blood lead
levels
,
25
m
g/dL, which currently represents the
vast majority of those with subclinical lead toxicity in
the United States,
1are either safe or effective.
Lead contamination of house dust after paint
abatement or renovation is the likely reason for the
increase in children’s blood lead levels. Presumably,
increases in children’s blood lead levels can be
pre-vented with appropriate clearance testing to
deter-TABLE 2. Children’s Geometric Mean Blood Lead Levels and Dust Lead Levels by Group Assignment
Characteristic Intervention Group Control Group PValue
mg/dL (95% CI) mg/dL (95% CI) Blood lead (mg/dL)
6 months 2.8 (2.5, 3.1) 2.9 (2.7, 3.2) .51
12 months 5.5 (4.9, 6.2) 5.9 (5.3, 6.6) .40
18 months 5.9 (5.3, 6.7) 6.2 (5.5, 7.0) .58
24 months 7.3 (6.6, 8.2) 7.8 (6.9, 8.7) .47
Floor lead (mg/ft2)
6 months 8.1 (6.7, 9.8) 7.6 (6.2, 9.3) .61
12 months 4.9 (4.0, 6.0) 5.2 (4.1, 6.6) .71
18 months 4.5 (3.7, 5.3) 4.9 (3.8, 6.3) .54
24 months 4.5 (3.7, 5.6) 5.0 (3.9, 6.3) .59
Interior sill lead (mg/ft2)
6 months 475.5 (358.8, 630.2) 392.5 (294.9, 522.5) .35
12 months 173.2 (126.4, 237.3) 157.2 (114.1, 216.8) .67
18 months 163.4 (121.3, 220.2) 155.0 (114.8, 209.3) .81
24 months 107.1 (79.3, 144.7) 143.7 (105.0, 196.6) .19
Trough lead (mg/ft2)
6 months 23821.9 (16926, 33527) 15870.9 (11121, 22649) .11
12 months 4088.2 (2872, 5819) 3085.2 (2130, 4470) .28
18 months 3860.5 (2700, 5519) 3385.7 (2310, 4962) .62
24 months 2173.7 (1358, 3479) 2649.2 (1727, 4064) .54
Abbreviation: CI, confidence interval.
TABLE 3. Percentage of Children With an Elevated Blood
Lead Level by Group Assignment
Months of Age Intervention Group
Control Group
P Value
n (%) n (%)
6 months
$10mg/dL 3 (2) 1 (1) .62
$15mg/dL 0 — 0 — —
$20mg/dL 0 — 0 — —
12 months
$10mg/dL 21 (17) 22 (17) .85 $15mg/dL 5 (4) 9 (7) .27 $20mg/dL 2 (2) 4 (3) .45 18 months
$10mg/dL 25 (20) 31 (25) .33 $15mg/dL 11 (9) 14 (11) .50 $20mg/dL 2 (2) 6 (5) .17 24 months
mine that lead dispersed during the work is
ade-quately cleaned-up. Clearance testing or residential
lead standards must be set low enough to adequately
protect children, however. If dust standards are
ad-equate to protect children, and if these dust lead
levels are achieved after abatement, after renovation
or before occupancy, it is likely that lead hazard
controls can be both safe and effective.
Unfortu-nately, current Environmental Protection Agency
guidelines and postabatement standards for house
dust are grossly inadequate.
16,37There are several limitations of this study. To
min-imize measurement error, we trained interviewers
and ran duplicate analyses of blood lead, but these
measures remain susceptible to error.
38Adherence
with the prescribed dust control regimen was also a
limitation. We attempted to assess adherence by
measuring detergent use and dust lead loading.
Un-fortunately, because we intentionally sampled the
same location in each house, the act of sampling may
itself have introduced an artificial decline in dust
lead levels. Alternatively, it is plausible that
chang-ing the environmental technician after the 6-month
visit altered dust lead loading in both groups.
An-other possibility is that the act of sampling altered
the cleaning behavior of the families assigned to the
control group. This is unlikely because the geometric
mean blood lead levels for the matched, nonstudy
group at 24 months of age tended to be lower than
those of the study children. Although there were no
differences in dust lead loading by group
assign-ment, it is possible that families followed the
pre-scribed cleaning regimen, but the equipment or
de-tergents were ineffective. This too is unlikely because
previous data indicate that dust lead loading can be
reduced with phosphate detergents.
23,39There may
have been a greater reduction in children’s blood
lead levels and dust lead levels if dust control had
been done by professional cleaning teams, but even if
professional dust control was efficacious, it is
un-likely to be implemented as a public health measure.
Finally, although the dust lead levels observed in this
study seem to be low compared with existing or
proposed federal standards, epidemiologic data
in-dicate that they are consistent with children having
undue lead exposure.
16,37CONCLUSION
In summary, the results of this study suggest that
dust control, as performed by families and in the
absence of lead hazard controls to reduce ongoing
contamination from lead-based paint, is not effective
in the primary prevention of childhood lead
expo-sure. It also emphasizes the fact that dust control, one
of the primary strategies to control lead exposure for
children with low to moderate elevations in blood
lead levels (ie, secondary prevention), has not been
proven to be effective in reducing children’s blood
lead levels. If dust control is to remain a primary
strategy to control lead exposure among children
with low to moderately elevated blood lead levels,
further research is needed to assess whether it is
truly effective. Unfortunately, although there has
been some progress in reducing childhood lead
ex-posure, the benefits of various lead hazard controls
intended to prevent or control children’s exposure to
residential sources of lead remain uncertain.
40ACKNOWLEDGMENTS
This work was funded by the Centers for Disease Control and Prevention (U67/CCU210773) and an Institutional National Re-search Service Award (#2T-32 PE-12002) from the Bureau of Health Professions, Human Resources and Services
Administra-Fig 1. Effect of dust control on children’s geometric mean blood lead levels by group assignment, at baseline (6 months), 12, 18, and 24 months of age.
Fig 2. Effect of dust control on percentage of children with ele-vated blood lead levels (ie,$10mg/dL) by group assignment, at baseline (6 months), 12, 18, and 24 months of age.
TABLE 4. Effect of Intensity of Intervention on Children’s Blood Lead Levels at 24 Months of Age for Children in the Intervention Group
Characteristic Geometric Mean Blood Leadmg/dL (95% CI)
PValue
Amount of detergent
1–15 bottles (n561) 7.0 (6.0, 8.3) .41 .15 bottles (n563) 7.7 (6.6, 9.0)
No. of DCA visits
1–5 visits (n536) 7.7 (6.2, 9.5) .62
$6 visits (n589) 7.2 (6.3, 8.2) Randomized by DCA
DCA 1 (n564) 7.5 (6.4, 8.6)
DCA 2 (n562) 7.2 (6.1, 8.5) .77
tion, Public Health Service, Department of Health and Human Services.
We acknowledge the contributions of Valerie Brown, Joann Centola, Kristine DiBitetto, Patrick Doyle, Catherine Galvin, Karen Knauf, Tambra McKinley, and Antoinette Parrillo. Harriet Kitz-man, ScD, and Klaus Roghmann, PhD, were scientific consultants.
REFERENCES
1. Centers for Disease Control. Blood lead levels—United States, 1991–1994.MMWR.1997;46:141–146
2. Baghurst PA, McMichael AJ, Wigg NR. Environmental exposure to lead and children’s intelligence at the age of seven years.N Engl J Med.
1992;327:1279 –1284
3. Bellinger D, Sloman J, Leviton A, Rabinowitz M, Needleman H, Water-naux C. Low-level lead exposure and children’s cognitive function in the preschool years.Pediatrics.1991;87:219 –227
4. Bellinger DC, Stiles KM, Needleman HL. Low-level lead exposure, intelligence and academic achievement: a long-term follow-up study.
Pediatrics.1992;90:855– 861
5. Dietrich KN, Berger OG, Succop PA. Lead exposure and the motor developmental status of urban six-year-old children in the Cincinnati Prospective Study.Pediatrics.1993;91:301–307
6. Needleman HL, Gatsonis CA. Low-level lead exposure and the IQ of children.JAMA.1990;263:673– 678
7. Needleman HL, Gunnoe C, Leviton A, et al. Deficits in psychologic and classroom performance of children with elevated dentine lead levels.
N Engl J Med.1979;300:689 – 695
8. Needleman HL, Jackson RJ. Lead toxicity in the 21st century: will we still be treating it?Pediatrics.1992;89:678 – 680
9. Needleman HL, Schell A, Bellinger D, Leviton A, Allred EN. The long-term effects of exposure to low doses of lead in childhood: an 11-year follow-up report.N Engl J Med.1990;322:83– 88
10. Thacker SB, Hoffman DA, Smith J, Steinberg K, Zack M. Effect of low-level body burdens of lead on the mental development of children: limitations of meta-analysis in a review of longitudinal data.Arch Environ Health.1992;47:336 –346
11. Rice DC. Behavioral effects of low-level developmental exposure to lead in the monkey. In: Smith MA, Grant LD, Sors AI, eds.Lead Exposure and Child Development: An International Assessment.London, England: Kluwer; 1989:427– 439
12. Bellinger D, Dietrich KN. Low-level lead exposure and cognitive func-tion in children.Pediatr Ann.1994;23:600 – 605
13. Bornschein RL, Succop PA, Kraft KM, Clark CS, Peace B, Hammond PB. Exterior surface dust lead, interior house dust lead and childhood lead exposure in an urban environment. In: Hemphill DD, ed.Trace Sub-stances in Environmental Health–XX.Proceedings of University of Mis-souri’s 20th Annual Conference; June 1986; Columbia, MO: University of Missouri; 1987:322–332
14. Rabinowitz M, Leviton A, Needleman H, Bellinger D, Waternaux C. Environmental correlates of infant blood lead levels in Boston.Environ Res.1985;38:96 –107
15. Lanphear BP, Weitzman M, Eberly S. Racial differences in environmen-tal exposures to lead.Am J Public Health.1996;86:1460 –1463
16. Lanphear BP, Weitzman M, Winter NL, et al. Lead-contaminated house dust and urban children’s blood lead levels.Am J Public Health.1996; 86:1416 –1421
17. Agency for Toxic Substances and Disease Registry. The Nature and Extent of Lead Poisoning in Children in the United States: A Report to Congress, 1988.Atlanta, GA: US Department of Health and Human Services, Public Health Service; 1988
18. Brody DJ, Pirkle JL, Kramer R, et al. Blood lead levels in the US population: phase 1 of the Third National Health Examination Survey (NHANES III, 1988 to 1991).JAMA.1994;272:277–283
19. Hayes EB, McElvaine MD, Orbach HG, Fernandez AM, Lyne S, Matte TD. Long-term trends in blood lead levels among children in Chicago. Relationship to air lead levels.Pediatrics.1994;93:195–200
20. Clark CS, Bornschein RL, Succop P, Que Hee SS, Hammond PB, Peace B. Condition and type of housing as an indicator of potential environ-mental lead exposure and pediatric blood lead levels.Environ Res.
1985;38:46 –53
21. Sargent JD, Brown MJ, Freeman JL, Bailey A, Goodman D, Freeman DH. Childhood lead poisoning in Massachusetts communities: its associa-tion with sociodemographic and housing characteristics.Am J Public Health.1995;85:528 –534
22. Lanphear BP, Byrd RS, Auinger P, Schaffer SJ. Community character-istics associated with children’s blood lead levels.Pediatrics.1998;101: 264 –271
23. Charney E, Kessler B, Farfel M, Jackson D. Childhood lead poisoning: a controlled trial of the effect of dust-control measures on blood lead levels.N Engl J Med.1983;309:1089 –1093
24. American Academy of Pediatrics, Committee on Environmental Health. Lead poisoning: from screening to primary prevention.Pediatrics.1993; 92:176 –183
25. American Academy of Pediatrics, Committee on Environmental Health. Screening for elevated blood lead levels.Pediatrics.1998;101:1072–1078 26. Centers for Disease Control.Preventing Lead Poisoning in Young Children: A Statement by the Centers for Disease Control, October 1991.Atlanta, GA: US Department of Health and Human Services; 1991
27. Lanphear BP, Winter NL, Apetz L, Eberly S, Weitzman M. A random-ized trial of the effect of dust control on children’s blood lead levels.
Pediatrics.1996;98:35– 40
28. Hilts SR, Hertzman C, Marion SA. A controlled trial of the effect of HEPA vacuuming on childhood lead exposure.Can J Public Health.
1995;86:345–350
29. Olds DL, Kitzman H. Can home-visitation improve the health of women and children at environmental risk?Pediatrics.1990;86:108 –116 30. Olds DL, Henderson CR, Tatelbaum R, Chamberlin R. Preventing child abuse and neglect: a randomized trial of nurse home visitation. Pediat-rics.1986;78:65–78
31. Lanphear BP, Emond M, Jacobs DE, et al. A side-by-side comparison of dust collection methods for sampling lead-contaminated house-dust.
Environ Res.1995;68:114 –123
32. Lanphear BP, Rust SW, Burgoon DA, Eberly S, Galke W. Environmental exposures to lead and urban children’s blood lead levels.Environ Res.
1998;76:120 –130
33. United States Environmental Protection Agency.Effect of In-Home Edu-cational Intervention on Children’s Blood Lead Levels in Milwaukee. Wash-ington, DC: US Environmental Protection Agency; 1996; EPA Report 747-R-95– 009
34. Swindell SL, Charney E, Brown MJ, Delaney J. Home abatement and blood lead changes in children with class III lead poisoning.Clin Pediatr.
1994;536 –541
35. Aschengrau A, Beiser A, Bellinger D, Copenhafer D, Weitzman M. The impact of residential lead-based paint hazard remediation and soil lead abatement among children with mildly elevated blood lead levels.Am J Public Health.1997;87:1698 –1702
36. Farfel MR, Chisolm JJ. Health and environmental outcomes of tradi-tional and modified practices for abatement of residential lead-based paint.Am J Public Health.1990;80:1240 –1245
37. Lanphear BP, Matte TD, Rogers J, et al. The contribution of lead-contaminated house dust and residential soil to children’s blood lead levels: a pooled analysis of 12 epidemiologic studies.Environ Res.1998; 79:51– 68
38. Emond MJ, Lanphear BP, Watts A, Eberly S, the Rochester Lead-in-Dust Study Group. Measurement error and its impact on the estimated relationship between dust lead and children’s blood lead.Environ Res.
1997;72:82–92
39. US Environmental Protection Agency.Laboratory Study of Lead-Cleaning Efficacy.Washington, DC: US Environmental Protection Agency; 1997; EPA Report 747-R-97– 002