Lincoln
University
Digital
Thesis
Copyright
Statement
The digital copy of this thesis is protected by the Copyright Act 1994 (New Zealand).
This thesis may be consulted by you, provided you comply with the provisions of the Act
and the following conditions of use:
you will use the copy only for the purposes of research or private study
you will recognise the author's right to be identified as the author of the thesis and
due acknowledgement will be made to the author where appropriate
you will obtain the author's permission before publishing any material from the
thesis.
Causes of elevated coumestrol in lucerne and mitigation of the
subsequent risk to ewe reproductive performance
A thesis
submitted in partial fulfilment
of the requirements for the Degree of
Doctor of Philosophy
at
Lincoln University
by
Rachel Lilian Fields
Lincoln University
ii
Abstract of a thesis submitted in partial fulfilment of the
requirements for the Degree of Doctor of Philosophy.
Abstract
Causes of elevated coumestrol in lucerne and mitigation of the
subsequent risk to ewe reproductive performance
by
Rachel Lilian Fields
Coumestrol in lucerne can reduce the ovulation rate of ewes, which lowers lambing rates. This thesis
isolated the factors with potential to increase the coumestrol levels of lucerne. The management of
ewes during the mating season to avoid suppressed ovulation was also investigated. This enabled
management strategies to be developed to mitigate the risk of depressed ovulation rate in ewes
grazing lucerne during the mating season.
Agronomic factors investigated were lucerne cultivar, cutting frequency, development stage, aphid
herbivory, fungal infection, water stress, and fungicide application. Fungal pathogens explained most
of the differences in coumestrol with a moderate relationship between fungal damage and
coumestrol content in field and glasshouse experiments. Lucerne inoculated with Stemphylium sp.
had high coumestrol levels, with 169 ± 25.1 mg/kg DM measured in entire shoots, compared with 3.4
± 0.84 mg/kg in control plants. Pea aphids were a minor cause of a coumestrol response, with an
increase from 2.4 ± 0.39 mg/kg DM to 5.3 ± 0.65 mg/kg DM measured in a glasshouse experiment.
Flowering did not produce a coumestrol response, with simultaneous increases observed in
vegetative and flowering plants. Wilted lucerne had a coumestrol content of 1.3 ± 0.43 mg/kg DM
which was not different to well-watered lucerne (2.2 ± 0.59 mg/kg DM) and only increased to 3.0 ±
0.57 mg/kg DM with further stress.
Despite fungal pathogens causing the main coumestrol response, carbendazim fungicidal treatments
predicted to decrease coumestrol accumulation were ineffective. In leaves inoculated with
stemphylium a newer cultivar ‘Stamina 5’ had higher coumestrol (396 ± 82.4 mg/kg DM) than
‘Wairau’ (143 ± 35.6 mg/kg DM), a 40 year old industry standard. In the field, five cultivars currently
on the market did not differ in coumestrol content throughout a growing season and all reached
at-risk levels (> 25 mg/kg DM) with an average content of 56.2 ± 3.24 mg/kg DM by late-May 2015.
Removal of herbage was an effective method to reduce coumestrol as regrowth material typically
iii Based on the field data, a model which used relative humidity and rainfall terms was created to
predict when lucerne was likely to have heightened coumestrol. From this model a risk assessment
analysis was created for a range of New Zealand locations. The assessment showed that four week
old lucerne regrowth was at lower risk of elevated coumestrol than the standard six week regrowth
which ewes are typically grazed on. Blenheim was least likely of the four locations to have at-risk
levels of coumestrol and in all locations except Napier, the risk of high coumestrol increased as the
autumn progressed. This would have greatest effect in Otago/Southland, where mating is
concentrated late in the season. Indirect prediction of coumestrol content was also identified
through ewe lambs that showed increased growth of teats and udder protrusion as an indicator of
the crop oestrogenicity.
Ideally, high quality forage provided by lucerne is beneficial for live weight and thus reproductive
performance, but grazing must avoid coumestrol-induced impairment of ovulation rates. A grazing
experiment removed ewes at different intervals prior to a CIDR-induced ovulation. This experiment
demonstrated that the risk of impaired lambing performance due to moderately oestrogenic lucerne
consumption decreased with time on grass prior to ovulation. Removal of ewes two weeks prior to
ovulation sufficed to mitigate the risk of decreased lambing performance in this situation.
The main results of this thesis indicate coumestrol levels are elevated by fungal infection of lucerne,
but grazing management can be utilised to mitigate the effects on ewe reproductive performance.
Keywords: alfalfa, carbendazim, coumestan, development, drought, dryland, flower, flushing, grazing
management, Medicago sativa L., nutrition, ovulation, phyto-oestrogen, sheep, Stemphylium, water
iv
Acknowledgements
First and foremost I would like to thank my excellent supervisor Professor Derrick Moot, for his
guidance, encouragement and enthusiasm throughout my studies. I am very grateful for the
dedication that he committed to this project. I was also privileged to have Associate Professor
Graham Barrell as my associate supervisor. I am incredibly appreciative of the advice and support
that he provided me. His extensive knowledge was a valuable contribution to this thesis.
I am extremely grateful for the financial support that I received for this thesis from Mr Roland Stead,
Struthers Trust Scholarship and Beef + Lamb New Zealand. Their contributions made this research
possible.
I would like to thank Dr Ian Harvey for his valuable advice and enthusiasm for my fungal research and
Dr Richard Sedcole for assistance with statistical analyses. I also had the privilege of collaborating
with Dr Alan Gash, his encouragement and research experience was of great benefit to me. I would
like to acknowledge Sharyn and Julian Price of Creedmoor Supersheep for bringing to my attention
the ewe lamb mammary development at their farm. Their enthusiasm towards research and farming
is outstanding, and it was great to be able to work with them. I also would like to thank Dr Catherine
Davis and Adrian Bibby for supplying me with the yeast bioassay methodology for oestrogenicity
measurement.
Without the help of all of the fantastic staff at Lincoln University, running experiments would not be
possible. In particular Martin Wellby provided guidance with the laboratory procedures and
tremendous assistance with the sheep experiments. I also recognise and acknowledge the huge
amount of support, advice and kindness I received from Dave Jack, Dan Dash, Malcolm Smith, Keith
Pollock, Anna Mills, Jenny Zhao, James Meyer, Rebecca Johnson, Brent Richards and Leona Meachen.
Thank you also to Hamish Monteath from FarmTech New Zealand LTD for technical assistance.
I would also like to thank Yeganeh Eslami for her friendship, enthusiasm and assistance in the
laboratory. I have enjoyed sharing this experience with the other postgraduate students from my
department including Shirin, Daliya, and Hung. A special thanks to Teresa for painting plants with me
and making the last months of my write-up particularly enjoyable.
I would like to thank my friends and family for their love and continuous support. I am incredibly
grateful to my husband Adam Fields for his love, patience and encouragement throughout my
v
Declaration
A substantial amount of the data from the on-farm study described in Chapter 7 has been published
in Journal of New Zealand Grasslands* and therefore includes contributions from co-authors. I was
involved in all aspects of the study including sample collection and animal measurements, assay of
coumestrol levels and statistical analyses, plus the drafting and final edits of the manuscript.
Technical assistance was provided for animal handling and the farm owners were responsible for
bringing this event to my attention.
Publications
Fields, R. L., Barrell, G. K. and Moot, D. J. 2016. Premature mammary development in ewe lambs exposed to an oestrogenic lucerne pasture. Journal of New Zealand Grasslands, 78, 41-44. Fields, R. L., Moot, D. J. and Barrell, G. K. In press. Coumestrol content of lucerne under drought
stress. Proceedings of the Australian Agronomy Conference.
vi
Table of Contents
Abstract ... ii
Acknowledgements ... iv
Declaration... v
Publications ... v
Table of Contents ... vi
List of Tables ... xi
List of Figures ... xiii
General Introduction ... 1
Chapter 1 Research aims and objectives ... 2
1.1 Review of the Literature ... 3
Chapter 2 Agronomy of common oestrogenic forage legumes ... 3
2.1 2.1.1 Lucerne ... 3
2.1.2 Red clover ... 4
2.1.3 Subterranean clover ... 4
Phyto-oestrogens ... 6
2.2 2.2.1 Phyto-oestrogen structures ... 6
2.2.2 Oestrogen receptors ... 8
2.2.3 Activation of oestrogen receptors by phyto-oestrogens ... 9
2.2.4 Oestrogenic and anti-oestrogenic effects ... 10
Determination of phytoestrogen concentration ... 11
2.3 2.3.1 Material preparation ... 11
2.3.2 Chemical assays ... 12
2.3.3 Bioassay ... 13
Factors which affect formononetin content of red and subterranean clovers. ... 15
2.4 The effect of isoflavones on ewes ... 16
2.5 2.5.1 Lambing performance ... 16
Factors which affect coumestrol content of lucerne ... 19
2.6 2.6.1 Fungal pathogens ... 19
2.6.2 Aphids... 25
2.6.3 Stage of development ... 25
2.6.4 Plant part ... 26
2.6.5 Water stress ... 26
2.6.6 Mechanism of coumestrol accumulation ... 27
The effect of coumestrol on ewes ... 27
2.7 2.7.1 Lambing performance ... 27
2.7.2 Morphological changes in organs ... 29
2.7.3 Live weight ... 30
2.7.4 Mechanism of reproductive disruption ... 30
Implications for future research ... 31
2.8 Further research ... 34
2.9 Method Development ... 35
Chapter 3 Introduction ... 35
vii
3.2.1 Lucerne sampling ... 36
3.2.2 Lucerne processing and extraction experiments ... 36
3.2.3 Measurement of coumestrol by HPLC ... 38
3.2.4 Experiment 5- HPLC and Yeast Assay Validation... 38
3.2.5 Statistical analysis ... 40
Results ... 40
3.3 3.3.1 Experiment 1 results: Cellulase versus methanol-only extraction ... 40
3.3.2 Experiment 2 results: Freeze-dried versus oven-dried lucerne ... 42
3.3.3 Experiment 3 results: Duration of sonication ... 43
3.3.4 Experiment 4 Pre-HPLC processing ... 44
3.3.5 Experiment 5 HPLC and yeast assay validation ... 46
Discussion... 49
3.4 Conclusions ... 52
3.5 Materials and Methods ... 53
Chapter 4 Main Experimental Sites ... 53
4.1 4.1.1 I12... 53
4.1.2 H7 ... 53
4.1.3 H14 ... 54
4.1.4 I9... 54
4.1.5 Glasshouse experiments ... 54
Meteorological conditions ... 56
4.2 4.2.1 Measurements ... 56
4.2.2 Long-term meteorological conditions ... 56
Soil water budget ... 57
4.3 4.3.1 SMD in Iversen 12 for the entire experimental period ... 57
4.3.2 SMD in Iversen 12 for cutting frequency experiment: first season ... 59
4.3.3 SMD in Iversen 12 for cutting frequency experiment: second season ... 60
4.3.4 SMD in Iversen 12 for fungicide and insecticide experiment ... 61
4.3.5 SMD at Ashley Dene for cultivar experiment ... 62
Field measurements and lucerne collection ... 63
4.4 Lucerne processing ... 63
4.5 Lucerne extraction ... 64
4.6 HPLC measurement of coumestrol in lucerne ... 64
4.7 Coumestrol rating scale ... 65
4.8 Plasma collection ... 65
4.9 Plasma extraction... 65
4.10 HPLC Measurement of Coumestrol in Plasma ... 66
4.11 Statistical Analyses ... 66
4.12 4.12.1 Agronomic screening chapter ... 66
4.12.2 Chapters 6-8 ... 66
Agronomic Screening ... 67
Chapter 5 Experiment 6 Cutting frequency and development stage ... 67
5.1 5.1.1 Introduction ... 67
5.1.2 Methodology ... 68
5.1.3 Experiment 6a results ... 69
5.1.4 Experiment 6b results ... 80
5.1.5 Discussion ... 87
viii
5.2.1 Introduction ... 89
5.2.2 Methods ... 89
5.2.3 Results ... 91
5.2.4 Discussion ... 95
Experiment 8 Fungicide and insecticide treatment ... 97
5.3 5.3.1 Introduction ... 97
5.3.2 Methods ... 97
5.3.3 Results ... 99
5.3.4 Discussion ... 105
Experiment 9 Lucerne infected with fungal pathogens ... 107
5.4 5.4.1 Introduction ... 107
5.4.2 Methods ... 107
5.4.3 Results ... 109
5.4.4 Discussion ... 115
Experiment 10 Water stress ... 117
5.5 5.5.1 Introduction ... 117
5.5.2 Methods ... 117
5.5.3 Results ... 119
5.5.4 Discussion ... 123
Experiment 11 Aphids ... 124
5.6 5.6.1 Introduction ... 124
5.6.2 Methods ... 125
5.6.3 Results ... 126
5.6.4 Discussion ... 127
Conclusions ... 128
5.7 Modelling of coumestrol in lucerne ...129
Chapter 6 Introduction ... 129
6.1 Methods ... 130
6.2 6.2.1 Predictors ... 130
6.2.2 Initial regression model ... 130
6.2.3 Model 1: Estimation of coumestrol content of a lucerne crop ... 131
6.2.4 Model 2: Conditions behind increased coumestrol ... 131
6.2.5 Testing the prediction model ... 131
6.2.6 Decision tree ... 133
6.2.7 Regional risk assessment ... 134
Results ... 135
6.3 6.3.1 Selection of predictors ... 135
6.3.2 Model 1 ... 137
6.3.3 Model 2 ... 139
6.3.4 Prediction model validation ... 141
6.3.5 Decision Tree ... 143
6.3.6 Regional risk assessment ... 145
Discussion... 154
6.4 6.4.1 Prediction of coumestrol in a lucerne crop ... 154
6.4.2 Requirements for a coumestrol spike ... 155
6.4.3 Regional risk of heightened coumestrol ... 155
Experiment 12 Morphological response of ewes to coumestrol ...157
Chapter 7 Introduction ... 157
ix 7.2.1 Experiment 12a: Ewe lambs exposed to an oestrogenic lucerne pasture (an on-farm
study) ... 158
7.2.2 Experiment 12b: Response of ewe lambs and mixed age ewes to coumestrol ... 159
Results ... 160
7.3 7.3.1 Experiment 12a: Ewe lambs exposed to an oestrogenic lucerne pasture ... 160
7.3.2 Experiment 12b: Response of ewe lambs and mixed age ewes to coumestrol ... 164
Discussion... 166
7.4 Experiment 13 Ewe fecundity after removal from lucerne ...168
Chapter 8 Introduction ... 168
8.1 Methodology ... 168
8.2 8.2.1 Experimental design ... 168
8.2.2 Pasture sampling ... 169
8.2.3 Control of ovulation and measurement of reproductive performance ... 169
8.2.4 Plasma sampling and extraction ... 169
8.2.5 Statistical analyses ... 170
Results ... 170
8.3 8.3.1 Pasture analyses ... 170
8.3.2 Ewe reproductive performance ... 173
8.3.3 Plasma analysis ... 175
Discussion... 176
8.4 General Discussion ...179
Chapter 9 Introduction ... 179
9.1 Measurement of coumestrol ... 179
9.2 Agronomic factors that increased coumestrol ... 180
9.3 9.3.1 Fungal pathogens ... 180
9.3.2 Aphids... 181
9.3.3 Development stage ... 182
9.3.4 Water stress ... 183
Prediction of coumestrol content ... 184
9.4 Mitigation of the effects of coumestrol in ewes ... 185
9.5 9.5.1 Risk reduction... 185
9.5.2 Risk removal ... 189
Recommendations for future research... 190
9.6 Conclusions ... 191
9.7 Appendix A Meteorological conditions ...192
A.1 Weather during Iversen 12 cutting frequency experiment (first season) ... 192
A.2 Weather during Iversen 12 cutting frequency experiment (second season) ... 193
A.3 Weather during Ashley Dene cultivar experimental period ... 194
A.4 Weather during Iversen 12 fungicide and insecticide experimental period ... 195
A.5 Weather during Iversen Field ewe fecundity grazing experiment... 196
Appendix B Growth media for yeast assay (Experiment 5) ...197
B.1 Media solution ... 197
Appendix C Supplementary information for Chapter 6 ...199
C.1 Coefficient selection for coumestrol model ... 199
x
C.3 Model 2 Best subsets regression analysis ... 200
C.4 Independent data used to validate prediction model ... 201
Appendix D Sequence data from Experiment 9 ...202
xi
List of Tables
Table 3.1 The relationships between oestradiol (E2) concentration (ng/L) and 570:620
absorbance in media solution across 16 separate assays. ... 49
Table 4.1 Monthly long-term means from 1960 to 2015 for air temperature (°C), rainfall (mm), and Penman potential evapotranspiration (mm). Data from the CliFlo database (NIWA), recorded at Broadfield Meteorological Station, Lincoln, Canterbury, New Zealand. ... 57
Table 4.2 Damage severity score categories for fungal and insect damage ... 64
Table 4.3 Morphological stages of development of lucerne shoots. ... 65
Table 4.4 Coumestrol content (mg/kg DM) rating scale for lucerne samples. ... 66
Table 5.1 Stated resistance ratings of the 5 established lucerne cultivars at Ashley Dene H7 and 10 lucerne cultivars sown at Lincoln University HRA91. ... 90
Table 5.2 Total monthly rainfall recorded at Broadfield EWS (NIWA) between 1 October 2015 and 25 May 2016. ... 99
Table 6.1 Distribution of mating and lambing dates in New Zealand and regions of interest in New Zealand (East Coast, Canterbury and Marlborough, and Otago and Southland). Lambing data are from 2014 Sheep and Beef Survey (Beef and Lamb New Zealand). Mating dates are based on an estimated gestation length of 147 days. ... 136
Table 6.2 The refined list of coefficients used to predict coumestrol content of a lucerne crop, following removal of obsolete, collinear parameters. F-statistic, P-values and VIF are from the ANOVA of a regression model which contained all terms. The R2 of the regression (0.766) is the adjusted R2 and includes all terms. The individual predictor R2 values are based on the regression between each predictor and coumestrol content. Coefficients are ranked by F-value. ... 137
Table 7.1 The probabilities of 0, 1, 2 and 3 fetuses per ewe at scanning for ewe live weights between 40 and 65 kg as predicted from Creedmore data with logistic regression. ... 163
Table 7.2 Mean (± SEM) number of fetuses (from ultrasonic scanning), percentage of ewes with at least two fetuses, and live weight of ewes with live weight above 53 kg (lightest grass-fed ewes). ... 164
Table 8.1 Nutritional data for the lucerne, ryegrass and white clover components of the pastures. Means within a column with letter subscripts in common were not significantly different (α = 0.05). ... 174
Table 8.2 The probabilities of 0, 1, 2 and 3 corpora lutea per ewe against days on grass prior to ovulation as predicted with logistic regression... 175
Table B.1 Chemicals in minimal media ... 199
Table C.2 The initial coefficients used to predict coumestrol content of lucerne. F-statistics, P -values and VIF are from the ANOVA of a regression model which contained all terms. The R2adj of the regression is 0.779 and includes all 16 terms. Degrees of freedom was 288 total, with error of 272. The predictor R2 values are based on the regression between each individual predictor and coumestrol content. Coefficients are ranked by F-value. ... 200
Table C.3 The first four levels of predictors identified via best subsets regression as best relating to coumestrol content in lucerne. For clarity, terms that were not identified by best subsets regression were not included in this table. ... 201
Table C.4 The first three levels of predictors identified by best subsets regression as relating to coumestrol content in lucerne. For clarity terms not identified by best subsets regression are not included in this table. ... 201 Table C.5 The independent data used to validate the prediction model from a range of
xii rainfall during the regrowth period, predicted coumestrol and average coumestrol content for that date. These climate data were used with Equation 6.3 to predict
coumestrol. ... 202
Table D.6 ITS nucleotide sequence from Stemphylium sp. ... 203
Table D.7 β-tubulin gene sequence from Stemphylium sp. ... 203
Table D.8 ITS nucleotide sequence from Colletotrichum sp. ... 203
xiii
List of Figures
Figure 2.1 The chemical structures of the phyto-oestrogen containing chemical classes, isoflavones and coumestans, compared with 17β-oestradiol found in animals.
Image from Wikimedia Commons... 6
Figure 2.2 The chemical structures of enterodiol (left) and enterolactone (right), which are mammalian lignans with both oestrogenic and anti-oestrogenic activity. Images from Wikimedia Commons. ... 8
Figure 2.3 The oestrogen-induced expression system of the recombinant yeast bioassay, which causes chlorophenol red- β-D-galactopyranoside to change from yellow to red in the presence of oestrogenic compounds. Diagram commissioned from Adam Fields Illustration & Design for this thesis, 2017. ... 14
Figure 2.4 A leaflet infected with Pseudopeziza medicaginis. Photo: R. L. Fields, 2016. ... 19
Figure 2.5 Cool biotype stemphylium leaf spot symptoms. Photo: R. L. Fields, 2016. ... 20
Figure 2.6 A leaf infected with Leptosphaerulina trifolii. Photo: R. L. Fields, 2016. ... 21
Figure 2.7 Spring black stem lesions on a section of lucerne stem. Photo: R. L. Fields, 2016. ... 22
Figure 3.1 Coumestrol content (mg/kg DM) of cellulase-extracted lucerne samples correlated (r = 0.906) with methanol-only extracted lucerne samples. Solid line is the line of best fit and the dotted line is the line of equality. ... 41
Figure 3.2 Difference in average coumestrol content (mg/kg DM) measurements of methanol and cellulase extracted samples increased (R2 = 0.921) with the average coumestrol measured with both methods. Solid horizontal line is the average difference (55.7 mg/kg DM); dashed lines are 95% limits of agreement. ... 41
Figure 3.3 Coumestrol content (mg/kg DM) of freeze dried lucerne correlated (r = 0.991) with oven dried lucerne. Solid line is the line of best fit and the dotted line is the line of equality. ... 42
Figure 3.4 Difference in average coumestrol content (mg/kg DM) measurements of freeze dried and oven dried samples versus the average coumestrol content measured by both methods. Solid line is the average difference (2.89 mg/kg DM); dashed lines are 95% limits of agreement. ... 43
Figure 3.5 Coumestrol extracted after sonication for 0, 2.5, 5 or 10 minutes of lucerne samples collected from Iversen 12 on 21 April 2014 and 25 May 2014 in duplicate (△; ■) and on 25 March 2015, 15 April 2015 and 17 May 2015 in triplicate (●;○;▼). Error bars are standard error of the mean of the duplicate or triplicate samples. ... 44
Figure 3.6 Peak area measured by HPLC of a lucerne sample (n = 1) following plant debris removal by centrifugation, nylon membrane filter or PTFE membrane filter. ... 45
Figure 3.7 The correlation (r = 0.999) in peak area measured by HPLC between lucerne samples (n = 5) prepared with glass fibre filters and samples prepared with centrifugation. Solid line is the line of best fit, dotted line is the line of equality. ... 46
Figure 3.8 Calibration curves of the HPLC measured peak area against the coumestrol standard solution concentration (mg/L) for four separate HPLC runs. Regression line is the overall relationship (R2 = 0.981) over the four runs described by the equation: 𝒚 = 3.3 x 10⁶⋅ 𝒙 + 1.1 x 10⁶ (± 0.11 x 10⁶; ± 0.88 x 10⁶), with 95% confidence interval (- - -). The individual R2 values of runs one (■; n = 6), three (□; n = 4) and four (◩; n = 5) were 0.9999, the R2 of run two (■; n = 5) was 0.9987. ... 47
Figure 3.9 Lucerne oestrogenicity measured by the yeast assay (µg oestradiol (E2) activity/kg DM) against (r = 0.873) coumestrol content measured by HPLC (mg/kg DM). Samples were from Iversen in autumn 2014 (●) and spring 2015 (○) and from Ashley Dene between spring 2014 and autumn 2015 (●). ... 50 Figure 4.1 The modelled soil moisture deficit (mm) and actual rainfall events (mm) in Iversen
xiv periods of Experiment 6a (+), Experiment 6b (|) and Experiment 8 (x). The water stress threshold was 180 mm. Sampling dates with a symbol below the SMD line are considered to be water stressed with reduced rate of transpiration, while sampling dates with a symbol above the SMD line have access to readily available water. ... 59 Figure 4.2 The modelled soil moisture deficit (mm) and actual rainfall events (mm) in Iversen
12 for Experiment 6a between 10 March 2014 and 2 June 2014 with relation to lucerne sampling dates (+). The water stress threshold was 180 mm. Sampling dates with a symbol below the SMD line are considered water stressed, while sampling dates with a symbol above the SMD line have access to readily available water. ... 60 Figure 4.3 The modelled soil moisture deficit (mm) and actual rainfall events in Iversen 12 for
Experiment 6b between 22 July 2014 and 1 June 2015 with relation to lucerne sampling dates (|).The water stress threshold was 180 mm meaning lucerne was considered to be water stressed with reduced rate of transpiration on each sampling date. ... 61 Figure 4.4 The modelled soil moisture deficit (mm) and actual rainfall events in Iversen 12 for
Experiment 8 between 25 May 2015 and 25 May 2016 with relation to lucerne sampling dates (X). The water stress threshold was 180 mm meaning lucerne was considered to be water stressed with reduced rate of transpiration on each sampling date. ... 62 Figure 4.5 The modelled soil moisture deficit (mm) and actual rainfall events in H7 of Ashley
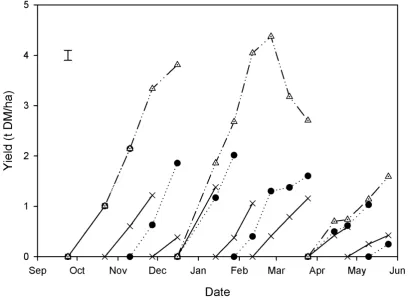
Dene between 21 July 2014 and 1 June 2015 for Experiment 7 with relation to lucerne sampling dates (●).The water stress threshold was 50 mm. Sampling dates with a symbol below the SMD line are considered water stressed, while sampling dates with a symbol above the SMD line have access to readily available water. ... 63 Figure 5.1 Dry matter (DM) yield (t/ha) of lucerne measured fortnightly in autumn 2014 under
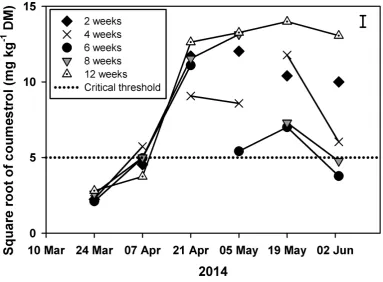
cutting intervals of 2 (◆), 4 (X), 6 (●), 8 (▲) or 12 (◬) weeks. Line breaks indicate when lucerne was mown. Error bar is the standard error of the mean for the interaction between cutting frequency and date. ... 72 Figure 5.2 Square root transformed coumestrol content of lucerne under cutting intervals of 2
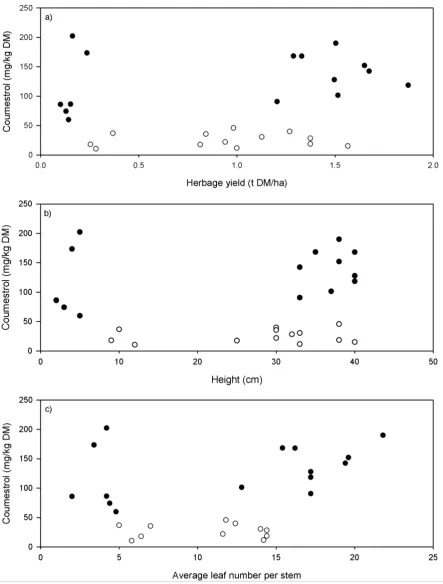
(◆), 4 (×), 6 (●), 8 (▼) and 12 weeks (◬) from 24 March to 2 June 2014. Line breaks indicate when lucerne had been mown. Dotted line is the square root of the critical value (25 mg/kg DM) above which lucerne is a risk for ewe reproductive performance. Error bar is the standard error of the mean for the interaction between treatment and time. ... 74 Figure 5.3 Coumestrol content (mg/kg DM) of lucerne against a) dry matter yield (t/ha), b)
plant height (cm), and c) number of leaves per stem on 7 April 2014 (○) and 21 April 2014 (●). ... 75 Figure 5.4 Fungal damage score (Table 4.2) of lucerne measured fortnightly in autumn 2014
under cutting intervals of 2 (◆), 4 (X), 6 (●), 8 (▲) weeks and unmown (◬). Line breaks indicate when lucerne has been mown. Error bar is the standard error of the mean for the cutting frequency treatment x date interaction. ... 77 Figure 5.5 Coumestrol content (mg/kg DM) against fungal damage score was weakly correlated
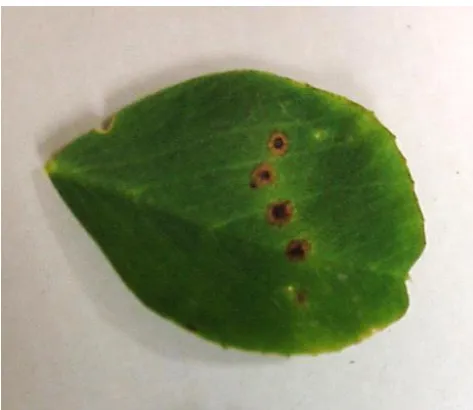
(r = 0.361) in lucerne sampled during autumn 2014. Dotted line is the level (25 mg/kg DM) above which lucerne is a risk for ewe reproductive performance. ... 78 Figure 5.6 Fungal damage due to stemphylium on two week old lucerne regrowth (Stage 1-2)
from 24 March 2014 in Experiment 6a. This lucerne had a low mean coumestrol content of 5.92 ± 0.483 mg/kg DM. Photo: R. L. Fields, 2014. ... 78
Figure 5.7 Fungal damage symptoms fromstemphylium and spring black stem on six week old
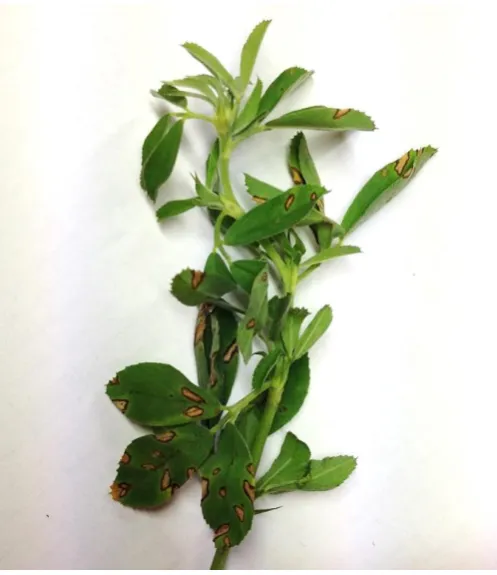
xv Figure 5.8 Fungal damage due to stemphylium on four week old lucerne regrowth (Stage 1)
from 19 May 2014. This lucerne had a moderate mean coumestrol content of 49.3 ± 4.16 mg/kg. Photo: R. L. Fields, 2014. ... 79 Figure 5.9 Dry matter (DM) yield (t/ha) of lucerne measured between Dec 2014 and May 2015
under approximately four (X), six (●) and 12 (◬) week cutting intervals. Coumestrol content was measured between January 2014 and June 2015 of this period. Error bar is the standard error of the mean for the interaction between date and cutting treatment. ... 82 Figure 5.10 Log10 transformed coumestrol content of lucerne under short (×), medium (●) and
long (◬) cutting intervals between January 2015 and May 2015. Line breaks indicate when lucerne had been mown. Dotted horizontal line is the log of the critical value (25 mg/kg DM) above which lucerne is a risk for ewe reproductive performance. Error bar is the standard error of the mean for the interaction between treatment and time. ... 84 Figure 5.11 Log10 coumestrol content (mg/kg DM) between 14 January and 25 May 2015
against (r = -0.134; P = 0.218) with development stage, where Stage 1-3 is vegetative, Stage 4-5 is bud, Stage 6-7 is flowering and Stage 8-10 is seed pod (Table 4.3). Dotted horizontal line is the log of the critical value (25 mg/kg DM) above which lucerne is a risk for ewe reproductive performance. ... 85 Figure 5.12 Fungal Damage Score of lucerne measured between 14 January and 25 May 2015
under short (X), medium (●) and long (◬) cutting intervals. Error bar is the standard error of the mean for the interaction between date and cutting frequency. ... 86 Figure 5.13 Coumestrol content of lucerne was correlated (r = 0.707; P < 0.001) with fungal
damage score in summer and autumn 2015. Dotted line is the level (25 mg/kg DM) above which lucerne is a risk for ewe reproductive performance. ... 86 Figure 5.14 Mean dry matter (DM) yield (t/ha) of five lucerne cultivars sampled at Ashley Dene,
over two regrowth periods between 15 January and 25 May 2015. Error bar is the standard error of the mean for the effect of date. ... 92 Figure 5.15 Coumestrol content (mg/kg DM) of ‘Stamina 5’ (◆), ‘Stamina 6GT’ (◆), ‘Grasslands
Kaituna’ (●), ‘Rhino’ (▼) and ‘Runner’ (△) at Ashley Dene H7. Dashed (- - -) lines are the 95% confidence interval. Error bar is the standard error of the mean for date. Dotted line is the level (25 mg/kg DM) above which lucerne is a risk for ewe reproductive performance. ... 93 Figure 5.16 Mean coumestrol (mg/kg DM) of 10 lucerne cultivars from HRA9, Lincoln sampled
on 7 March and 20 April 2016 (n = 4). Error bar is the standard error of the mean for cultivar. ... 94 Figure 5.17 Coumestrol content (mg/kg DM) of lucerne against (r = 0.766) fungal damage score
in summer and autumn 2015 at Ashley Dene H7. Dotted line is the level (25 mg/kg DM) above which lucerne is a risk for ewe reproductive performance. ... 95 Figure 5.18 Yield of unsprayed (●), fungicide sprayed (▲), insecticide sprayed (▽) and
fungicide + insecticide sprayed (●) lucerne between 2 November 2015 and 25 May
2016. Error bars are the standard errors of the mean for a) date and b) fungicide treatment. ... 101 Figure 5.19 There was no difference in mean coumestrol content (mg/kg DM) of lucerne
xvi Figure 5.20 The seasonal change in overall fungal damage score (‒ – ‒) and individual damage
scores for common leaf spot (●), stemphylium (●), spring black stem (▼) averaged across all lucerne plots. Error bar is the standard error of the mean for date. ... 104 Figure 5.21 Coumestrol content (mg/kg DM) against fungal damage score for fungicide sprayed
(▲) and unsprayed (●) lucerne with a split-line relationship (R2 = 0.631). Dotted line is the level (25 mg/kg DM) above which lucerne is a risk for ewe reproductive performance. ... 105 Figure 5.22 Phylogenetic tree based on the β-tubulin gene sequence, showing relations among
species including the specimen of interest ‘Unknown’. Scale bar is 0.02 nucleotide substitutions per site. ... 109 Figure 5.23 Phylogenetic tree based on the β-tubulin gene sequence, showing relations among
species including the specimen of interest ‘Unknown’. Scale bar is 0.01 nucleotide substitutions per site. ... 110 Figure 5.24 Mean coumestrol contents (mg/kg DM) 1-2 weeks after ‘Stamina 5’ (■) and
‘Wairau’ (■) lucerne shoots were inoculated with anthracnose or stemphylium, or not inoculated (control). Error bar is the standard error of the mean for infection. Dotted line is the level (25 mg/kg DM) above which lucerne is a risk for ewe reproductive performance. ... 111 Figure 5.25 Wairau lucerne leaflets from a leaf needle damaged and infected with
stemphylium two weeks prior, with and without ‘Leaf Doctor’overlay. ... 112 Figure 5.26 Stamina 5 lucerne leaflets from the control treatment, needle damaged two weeks
prior, with and without ‘Leaf Doctor’overlay. ... 112 Figure 5.27 Mean coumestrol contents (mg/kg DM) 1-2 weeks after ‘Stamina 5’ (■) and
‘Wairau’ (■) lucerne leaves were inoculated with anthracnose or stemphylium, or not inoculated (control), following six needle punctures per leaflet. Error bar is the standard error of the mean for the interaction of treatment and cultivar on coumestrol. Dotted line is the level (25 mg/kg DM) above which lucerne is a risk for ewe reproductive performance. ... 113 Figure 5.28 Mean coumestrol contents (mg/kg DM) of ‘clean’ (□) and ‘diseased’ (▨) parts of
lucerne leaves, one and two weeks after inoculation with stemphylium. Error bar is the standard error of the mean for the interaction of inoculation duration and leaf part. Dotted line is the level (25 mg/kg DM) above which lucerne is a risk for ewe reproductive performance. ... 115 Figure 5.29 Mean coumestrol contents (mg/kg DM) of ‘clean’ (□) and ‘diseased’ (▨) parts of
‘Stamina 5’ and ‘Wairau’ lucerne leaves, 1-2 weeks after inoculation with stemphylium. Error bar is the standard error of the mean for the interaction of cultivar and leaf part. Dotted line is the level (25 mg/kg DM) above which lucerne is a risk for ewe reproductive performance. ... 115 Figure 5.30 Lucerne from Harvest 1 of Experiment 10 on 21 September. From left: ‘Grasslands
Kaituna’ at field capacity; ‘Grasslands Kaituna’ at permanent wilting point. ‘Wairau’ at field capacity; ‘Wairau’ at permanent wilting point. Photo: R. L. Fields, 2016. ... 121 Figure 5.31 ‘Wairau’ at field capacity (left) vs ‘Wairau’ at senescence (right) at Harvest 2 of
Experiment 10 on 6 October 2016, following four weeks of no water. Photo: R. L. Fields, 2016. ... 122 Figure 5.32 Mean coumestrol (mg/kg DM) of glasshouse grown ‘Grasslands Kaituna’ (■) and
‘Wairau’ (■) lucerne under well-watered and water stressed treatments on two dates. Error bar is the standard error of the mean for the interactions between cultivar x treatment and date x treatment. ... 122 Figure 5.33 ‘Wairau’ at field capacity (left) vs. ‘Wairau’ re-watered after water stress induced
xvii Figure 5.34 Aphid clip cages attached to individual leaves of lucerne in a greenhouse at Lincoln
University, Canterbury, New Zealand (R. L. Fields, 2015). ... 127 Figure 6.1 Coumestrol content (mg/kg DM) of lucerne against days above 95% relative
humidity that the lucerne crop had been exposed to. The regression line (R2adj =
0.735) is described by the equation: 𝒚 = =6.51𝒙−13.3 (± 0.227; ± 2.35), with 95% confidence (— — —) and prediction (- - -) intervals. Data from Lincoln in 2014 (◇), 2015 (○) and 2016 (X), and from Ashley Dene in 2015 (◆). ... 139 Figure 6.2 Coumestrol content (mg kg-1 DM) against fungal damage score in field samples
alfalfa sampled in Experiments 1a, 1b, and 2a. The relationship (P < 0.001; R2 = 0.388) is described by the equation: y = 100.45 + 0.31x. Dashed lines around the regression line are the 95% confidence interval. Dotted line is the critical level (25 mg kg-1 DM) above which alfalfa is reported to be a risk for ewe reproductive performance. ... 140 Figure 6.3 Independent reported coumestrol content of lucerne (mg/kg DM) against predicted
coumestrol content (mg/kg DM) from Model 1. Solid line is the relationship (R2 = 0.664) between reported and predicted coumestrol as described by: 𝒚 = 1.44𝒙 + 9.26. Dashed line is the identity line. Data sourced from Logan, Utah 1961 (●); Brookings, South Dakota 1963 (●); Lincoln, Canterbury, NZ 1980 (▲); Oamaru, North Otago, NZ 2015 (■); and Lincoln, NZ 2016 (▼). ... 142 Figure 6.4 Measured coumestrol content (mg/kg DM) against (r = 0.847) predicted coumestrol
content of lucerne from the second iteration of Model 1. Dotted line is the level (25 mg/kg DM) above which lucerne is a risk for ewe reproductive performance. Data sourced from Logan, Utah 1961 (●); Brookings, South Dakota 1963(●); Lincoln in 1980 (▲), 2014 (◇), 2015 (○) and 2016 (X); Oamaru, North Otago, NZ 2015 (■) and Ashley Dene in 2015 (◆). ... 143 Figure 6.5 A decision tree to estimate mean coumestrol content based on rainfall (mm) and
days above 95% relative humidity. ... 144 Figure 6.6 Coumestrol against the sum of rainfall (mm) during the regrowth period of lucerne
samples. From left: horizontal lines are mean coumestrol for rainfall less than 61 mm, rainfall between 61 and 131 mm, and rainfall above 131 mm. ... 145 Figure 6.7 Coumestrol against days above 95% relative humidity for lucerne samples with
rainfall less than 61 mm during the regrowth period. From left: horizontal lines are mean coumestrol for less than 5.5 days over 95% RH and greater than 5.5 days. ... 145 Figure 6.8 Predicted median coumestrol content (mg/kg DM) of six week old lucerne regrowth
over successive mating dates for Lincoln (●), Lauder (○), and Blenheim (▼). ... 147 Figure 6.9 Predicted median coumestrol content (mg/kg DM) of four week old lucerne
regrowth over successive mating dates for Lincoln (●), Lauder (○), and Blenheim (▼). ... 147 Figure 6.10 Cumulative distribution functions for predicted coumestrol content (mg/kg DM) in
six week lucerne regrowth for five mating dates based on a simulation analysis using long-term meteorological data from four areas of New Zealand (Lauder, Lincoln, Blenheim & Napier). Drop-lines are the probability of lucerne not exceeding 25 mg coumestrol/kg DM on 23 February (a: 0.55), 20 April (b: 0.35), 15 June (c: 0.21). ... 148 Figure 6.11 Cumulative distribution functions for predicted coumestrol content (mg/kg DM) in
xviii Figure 6.12 Cumulative distribution functions for predicted coumestrol content (mg/kg DM) in
six week lucerne regrowth at four sites (Blenheim, Lauder, Lincoln and Napier) based on a simulation analysis using long-term meteorological data of nine dates between February and June. Drop-lines are the probability of lucerne not exceeding 25 mg coumestrol/kg DM in Blenheim (a: 0.51), Lauder and Napier (b: 0.34), and Lincoln (c: 0.26). ... 150 Figure 6.13 Cumulative distribution functions for predicted coumestrol content (mg/kg DM) in
four week lucerne regrowth at four sites (Blenheim, Lauder, Lincoln and Napier) based on a simulation analysis using long-term meteorological data of nine dates between February and June. Drop-lines are the probability of lucerne not exceeding 25 mg coumestrol/kg DM in Blenheim (a: 0.71), Lauder and Napier (b: 0.64), and Lincoln (c: 0.50). ... 150 Figure 6.14 The distribution of lambing date (△) in Otago/Southland and the likelihood (%) of
coumestrol content over 25 mg/kg DM in four week old (●) and six week old (●)
lucerne on corresponding mating dates in Lauder based on a simulation analysis using long-term meteorological data. Regression lines (R2 = 0.898) are parallel (P = 0.101) lines of slope ‘0.43 ± 0.048%/d’ for the relationship between date and risk for the four (dashed line) and six (solid line) week old lucerne. Error bar is the standard error of the mean for regrowth age. ... 151 Figure 6.15 The distribution (%) of lambing date (△) in Canterbury/Marlborough and the
likelihood (%) of coumestrol content over 25 mg/kg DM in four week old (●) and six week old (●) lucerne on corresponding mating dates in Lincoln based on a simulation analysis using long-term meteorological data. Regression lines (R2 = 0.922) are parallel (P = 0.482) lines of slope ‘0.45 ± 0.040%/d’ for the relationship between date and risk for the four (dashed line) and six (solid line) week old lucerne. Error bar is the standard error of the mean for regrowth age. ... 152 Figure 6.16 The distribution of lambing date (△) in Canterbury/Marlborough and the likelihood
(%) of coumestrol content over 25 mg/kg DM in four week old (●) and six week old (●) lucerne on corresponding mating dates in Blenheim based on a simulation analysis using long-term meteorological data. Regression lines (R2 = 0.857) are parallel (P = 0.399) lines of slope ‘0.27 ± 0.039%/d’ for the relationship between date and risk for the four (dashed line) and six (solid line) week old lucerne. Error bar is the standard error of the mean for regrowth age. ... 153 Figure 6.17 The distribution of lambing date (△) on the East Coast and the likelihood (%) of
coumestrol content exceeding 25 mg/kg DM in four week old (●) and six week old
(●) lucerne on corresponding mating dates in Napier, based on a simulation analysis using long-term meteorological data. Error bar is the standard error of the mean for regrowth age. ... 154 Figure 7.1 Mammary gland and teat development of a ewe lamb that had grazed lucerne (top)
in comparison with one that had grazed a ryegrass/white clover pasture (lower). Photographs taken 12 March, 2015. ... 162 Figure 7.2 Mean teat width of ewe lambs grazing grass (■) or lucerne (■) up to 12 March
2014, then grass only until 16 April 2014. Vertical bars represent SEM, ** indicates the significance (P = 0.004) between treatment groups on 12 March. ... 163 Figure 7.3 The probabilities of 0, 1, 2, and 3 fetuses per ewe at scanning for ewe live weights at
mating between 40 and 65 kg as predicted from Creedmore data with logistic regression. ... 164 Figure 7.4 Mean change in teat length (mm) of ewe lambs (■) and mixed aged ewes (■)
xix Figure 7.5 Mean change in teat width (mm) of ewe lambs (■) and mixed aged ewes (■)
between Day 1 and Day 12 after nine days of injection with either coumestrol or vehicle only. Values were not significantly different. Error bars are SEM. ... 166 Figure 8.1 Mean coumestrol content of lucerne and grass sampled from 1 April to 9 May 2016.
Samples were taken pre-grazing for each pasture break. Vertical bars represent ± SEM... 172 Figure 8.2 Pre-grazing yields (t DM/ha) of ryegrass (■), white clover (■) and dead material (■)
in the grass pasture at the onset of each break from 5 April 2016 to 11 May 2016. Error bar (a) is the standard error of the effect (P = 0.039) of date on dead material yield. Error bar (b) is the standard error of the date versus (P = 0.417) the combined yield of ryegrass and white clover. ... 173 Figure 8.3 The probabilities of 0, 1, 2 and 3 corpora lutea per ewe against days on grass prior to
ovulation as predicted with ordinal logistic regression. Dashed lines are 95% confidence intervals. ... 175 Figure 8.4 The expected number of corpora lutea per ewe against the number of days on grass
prior to ovulation. The change in expected ovulation rate with days on grass is described by the equation 𝒚 = 1.42 + 0.65(1 -0.896𝒙). Dashed lines are 95% confidence intervals. ... 176 Figure A.1 Rainfall (mm) in Iversen 12 during the first cutting frequency experiment from 10
March to 2 June 2014 recorded at Broadfield EWS (NIWA). ... 193 Figure A.2 Mean daily temperature (°C) in Iversen 12 during the first cutting frequency
experimental period from 10 March to 2 June 2014 recorded at Broadfield EWS (NIWA). ... 193 Figure A.3 Rainfall (mm) in Iversen 12 during the second cutting frequency experiment from 1
October 2015 to 31 May 2015 recorded at Broadfield EWS (NIWA). ... 194 Figure A.4 Mean daily temperature (°C) in Iversen 12 during the second cutting frequency
experiment from 1 October 2015 to 31 May 2015 recorded at Broadfield EWS (NIWA). ... 194 Figure A.5 Rainfall (mm) during the Ashley Dene cultivar experiment from 1 August 2014 to 25
May 2015 recorded at Burnham Sewage Plant (NIWA). ... 195 Figure A.6 Mean daily temperature (°C) during the Ashley Dene cultivar experiment from 1
August 2014 to 25 May 2015 recorded at Broadfield EWS (NIWA). ... 195 Figure A.7 Rainfall (mm) during Iversen 12 fungicide and insecticide experiment from 1
October 2015 to 31 May 2015 recorded at Broadfield EWS (NIWA). ... 196 Figure A.8 Mean daily temperature (°C) during Iversen 12 fungicide and insecticide experiment
from 1 October 2015 to 31 May 2015 recorded at Broadfield EWS (NIWA). ... 196 Figure A.9 Rainfall (mm) in Iversen Field during the ewe fecundity grazing experiment from 01
March to 15 May 2016 recorded at Broadfield EWS (NIWA). ... 197 Figure A.10 Mean daily temperature (°C) in Iversen Field during the ewe fecundity grazing
1
Chapter 1
General Introduction
Lucerne (Medicago sativa L.) is a high quality, high yield forage legume promoted for use in New
Zealand dryland pasture systems. In New Zealand, lucerne was widely used for the majority of the
20th century, with a peak of 220,000 ha during the mid-1970s. Lucerne use then declined, mainly due
to susceptibility of the available cultivars to pests and diseases (Douglas, 1986). With the advent of
new cultivars, bred specifically for resistance to these factors (Purves and Wynn-Williams, 1989), and
renewed interest in productive forages for dryland systems, demand for lucerne has steadily
increased throughout New Zealand since the turn of the 21st century, with an estimated 150,000 ha
now in lucerne (Monk et al., 2016).
A potential impediment to the further adoption of lucerne as the main pasture source in dryland
sheep systems is a perception that it can reduce ewe reproductive performance. Lucerne has been
shown to produce a phyto-oestrogen called coumestrol which can reduce the fecundity of grazing
ewes through decreased ovulation rate, and therefore lambing rate (Coop, 1977; Scales et al., 1977;
Smith et al., 1979). The effect of coumestrol on ovulation rate is temporary and animals fully recover
upon removal from the lucerne (Coop, 1977; Adams, 1995). Thus, farmers are generally advised not
to feed ewes on lucerne in the weeks prior to and during mating. However, as lucerne is a high
quality forage it can also be used to increase live weight gains of grazing stock relative to other
non-oestrogenic but potentially lower quality forages, such as grasses. Heightened ewe live weight
increases ovulation (Rattray et al., 1980; Thompson et al., 1990) and for this reason, prior to mating,
ewes are often put on high quality pastures such as lucerne. This is particularly relevant in dry
summer/autumn periods when lucerne may be the only feed available (Brown et al., 2005; King et
al., 2010).
Coumestrol levels within lucerne herbage are highly variable. When coumestrol levels are low,
mating ewes on lucerne benefits lambing rate (Smith et al., 1979). However, when coumestrol levels
are high, lucerne can be detrimental (Coop, 1977; Scales et al., 1977; Smith et al., 1979). Coumestrol
levels are elevated in response to fungal infection (Hanson et al., 1965; Bickoff et al., 1967; Sherwood
et al., 1970; Saba et al., 1972), and research indicates other factors including aphids and
developmental stage may also cause an increase (Bickoff et al., 1960a; Hanson et al., 1965; Loper,
1968). The ability to identify whether a lucerne crop on offer has high or low coumestrol, prior to and
during mating, plays a large role in decisions of whether or not to graze lucerne with a reproductive
2
Research aims and objectives
1.1
The main aim of this thesis was to identify lucerne crops that may be at risk of high coumestrol
content. From this, a second aim was to develop management strategies to mitigate the risk of
depressed ovulation from ewes grazing lucerne before and during mating.
This thesis is presented in nine chapters. Chapter 2 is a review of the literature about
phyto-oestrogens and the responses of ruminants upon ingestion, with particular emphasis on coumestrol
in lucerne and its effect on ewe reproduction. Chapter 4 is a description of the field sites and
methodology. In addition, five results chapters (Chapter 3 & Chapters 5-8) are presented. These
chapters relate to the following specific objectives developed from the aims:
Objective 1: To refine methods used for coumestrol measurement (Chapter 3):
Experiment 1 Cellulase versus methanol-only extraction
Experiment 2 Freeze-dried versus oven-dried material
Experiment 3 Sonication length
Experiment 4 Pre-HPLC processing
Experiment 5 Bioassay and HPLC validation
Objective 2: To isolate factors which increase the risk of high coumestrol in lucerne and identify
strategies to minimise coumestrol accumulation (Chapter 5):
Experiment 6 Cutting frequency and development stage
Experiment 7 Cultivar
Experiment 8 Fungicide and insecticide treatment
Experiment 9 Lucerne infected with fungal pathogens
Experiment 10 Water stress and recovery from stress
Experiment 11 Aphids
Objective 3: To develop a predictive tool to estimate coumestrol content of lucerne:
Chapter 6: Modelling coumestrol in lucerne
Objective 4: To quantify animal responses to elevated coumestrol:
Chapter 7: Experiment 12 Morphological response of ewes to coumestrol
Chapter 8: Experiment 13 Ewe fecundity after removal from lucerne
Finally, Chapter 9 provides a general discussion of how the results of this study could be applied in
3
Chapter 2
Review of the Literature
This chapter reviews the literature on factors that affect phytoestrogen content in plants, and the
effects of those phyto-oestrogens on the ruminants that consume them. The review focuses on
lucerne (Medicago sativa L.) predominantly, but also considers research with other forages that
contain phyto-oestrogens. Finally, this review discusses the research required to identify high
coumestrol lucerne crops and to reduce the negative effects of coumestrol on reproductive
performance, which forms the basis of the experimental chapters in this thesis.
Agronomy of common oestrogenic forage legumes
2.1
Legumes are grown in pasture systems because they can fix nitrogen through symbiosis with
rhizobia. Nitrogen fixation makes legumes high quality, high protein feed sources (Evans and Barber,
1977), and increases the nitrogen status of the soil. This improves the production and quality of other
pasture species, such as perennial ryegrass (Lolilum perenne L.).
Many forage legumes produce phyto-oestrogenic compounds. Lucerne, red clover (Trifolium
pratense L.) and subterranean clover (T. subterraneum L.) are the main forage legumes that may
affect ruminant reproductive performance in New Zealand and Australian dryland pasture systems.
This section discusses the growth forms and agronomy of these species.
2.1.1
Lucerne
Lucerne, also known as alfalfa, is a high nutritional quality perennial legume species with a deep
taproot which allows it to reach soil moisture that species with shallower rooting depths cannot.
Lucerne has comparatively high yield with annual yields of 20 to 28 t DM/ha recorded in Canterbury,
New Zealand under irrigation (Brown et al., 2000).
Lucerne is typically grown as a pure sward, although in grazing systems it is sometimes used in
mixtures with a grass species (Dunbier, 1983). Direct grazing of lucerne is uncommon in Europe and
the United States where most lucerne is cut for hay or silage. However, in New Zealand, Australia and
Argentina lucerne is an important forage crop grazed by sheep, beef cattle and dairy cattle (Dunbier,
1983).
Lucerne produces erect stems from a crown at the base of the plant. This means that it is not
recommended for set stocking as a rotational grazing system is required to allow the plant to
4 reserves for spring production and in autumn will replenish these reserves with increased
partitioning of photosynthates below ground (Brown et al., 2006). To facilitate this, management
advice is to spell the crop in late summer to early autumn until flowering to enable the plant to
replenish its root reserves, which improves stand persistence for regrowth in subsequent years
(Moot et al., 2003b).
Lucerne produces the phyto-oestrogen coumestrol, a potent phyto-oestrogen that can affect ewe
reproductive performance. A background on the chemical structure of coumestrol is provided in
Section 2.2.1. The agronomic factors that are implicated to cause and control coumestrol
accumulation in lucerne are described in Section 2.6. The literature regarding the affect that
coumestrol has on sheep that consume it are described in Section 2.7. Based on the literature,
research undertaken in this thesis (Chapters 3 to 8) to improve lucerne grazing management is
outlined in Section 2.8.
2.1.2
Red clover
Red clover is a short-lived perennial species (two to four years) that grows from a crown. Its growth
form ranges from prostrate to erect. Red clover provides high quality feed and is often used for
finishing stock or for dairy cattle.
Red clover yield is typically lower than lucerne with annual irrigated red clover yields of 15 and 20 t
DM/ha recorded in Canterbury (Brown et al., 2000). As with lucerne, red clover should be
rotationally grazed to increase stem production from basal buds.
Red clover and subterranean clover (Section 2.1.3) produce the compound formononetin which is
metabolised in ruminants to the phyto-oestrogen equol. Equol can cause reproductive organ
disorders and infertility in ewes that consume it. A background on the chemical structures of
formononetin and equol is provided in Section 2.2.1. The agronomic factors that are implicated to
cause formononetin accumulation in subterranean and red clover are described in Section 2.4. The
literature regarding the affect that formononetin has on sheep that consume it are described in
Section 2.5. Due to awareness of the problems formononetin causes and extensive plant breeding to
decrease formononetin, subterranean clover and red clover are no longer considered major issues to
ewe reproductive performance, and are not the subjects of the research contained in this thesis. A
5
2.1.3
Subterranean clover
In New Zealand, subterranean clover is the recommended annual clover species sown for dryland
east coast hill and high country pastures where summer dry can be 3-5 months long (Chapman et al.,
1986; Lucas et al., 2015). Subterranean clover is a winter annual species with a prostrate growth
form. The plant germinates following autumn rainfall and grows through winter, with the main
production period in spring. Subterranean clover sets seed from late spring and produces a burr that
is pushed underground as it matures to bury its seeds. After seed-set the plants die to avoid the
summer drought.
Management of subterranean clover, particularly in the first season after sowing, requires lax grazing
in the spring when the plants are flowering and producing seed (Smetham and Dear, 2003). This
allows the build-up of a large seed reserve in the soil which can last for many years. Adequate areas
of open ground are necessary in the autumn for the plants to successfully re-establish after
germination.
In New Zealand, pure sward yields of 1.8 t/ha in May-germinated subterranean clover and 7 t DM/ha
in March-germinated clover were reported (Moot et al., 2003a). In mixed pastures with cocksfoot
(Dactylis glomerata L.), subterranean clover yields from 2.4 to 3.7 t DM/ha have been measured
7
2.2.1.1
Phyto-oestrogenic coumestans
Coumestrol is a potent phyto-oestrogenic coumestan and the main phyto-oestrogen in lucerne. It is
also present in other perennial and annual Medicago species, soybean (Glycine max L. Merr.) and
white clover (Trifolium repens L.) (Shutt et al., 1969; Wong et al., 1971; Thompson et al., 2006).
Coumestrol is present in lucerne both in its active form and as 4’-methoxycoumestrol, which is
de-methylated in ruminants to coumestrol (Adams, 1995). Coumestrol orients its two hydroxyl groups in
the same position as the two hydroxyl groups in 17β-oestradiol. Coumestrol can range between
0-600 mg/kg DM, with highest concentrations primarily measured in diseased plant material (Hanson
et al., 1965; Saba et al., 1972). Biological effects on ewe reproduction and reproductive organ
development have been suggested to occur in lucerne at coumestrol levels greater than 25 mg/kg
DM (Smith et al., 1979).
2.2.1.2
Phyto-oestrogenic isoflavones
Isoflavones have two benzene rings linked through a pyran ring and are the main phyto-oestrogens in
species which includes subterranean clover, red clover and soybean. Phyto-oestrogenic isoflavones
include biochanin A, genistein, formononetin, and daidzein (Stochmal et al., 2001). These compounds
can be metabolised by ruminants to other oestrogenically active or inactive compounds.
Formononetin is an isoflavone that is detrimental to reproduction in ruminants. It is present in older
cultivars of subterranean and red clover at levels of 1-2% of dry weight (Cox and Braden, 1974).
Formononetin is the 4-methyl ether of daidzein, and has low phyto-oestrogenicity. However, in the
rumen, formononetin is demethylated to daidzein and further metabolised to equol (Nilsson et al.,
1967; Dickinson et al., 1988). Equol is oestrogenic and rapidly absorbed through the ruminal wall and
gastrointestinal tract (Shutt and Braden, 1968; Adams, 1995). It can cause reduced lambing rates,
permanent infertility, and prolapse of the uterus (Bennetts et al., 1946; Lundh et al., 1990; Adams,
1995). The proportion of formononetin converted to equol changes little with time and so the
oestrogenicity remains high (Lindsay and Francis, 1969). With the release of low-formononetin
cultivars of subterranean clover these severe clinical symptoms are now uncommon (Adams, 1995).
Biochanin A and genistein are present in subterranean clover, red clover and lucerne. Genistein along
with daidzein are the main phyto-oestrogens in soybean (Thompson et al., 2006). In the digestive
tract, biochanin A is metabolised to genistein and then to the non-oestrogenic compound
4-ethylphenol (Batterham et al., 1965). Biochanin A and genistein may produce oestrogenic effects in
sheep for a few days following introduction to the pasture. However, once rumen microflora adjust,
genistein and biochanin A are metabolised to 4-ethylphenol and are no longer oestrogenic (Lindsay
and Francis, 1969; Cox and Braden, 1974). This means that their levels in forage are relatively
9 β was approximately 5% of that expressed in the ovaries (Couse et al., 1997). In the male
reproductive tract, ER-α and ER-β was detected in the prostate and epididymis, while only ER- α was
detected in the testes (Couse et al., 1997).
Oestrogen receptors in their inactive states are monomers with a heat shock protein (hsp90) that
inhibits their action. Hsp90 stabilises proteins and inhibits degradation of unbound oestrogen
receptors (Beliakoff and Whitesell, 2004; Sanchez, 2012). When a ligand such as oestradiol-17β binds
to the oestrogen receptor, hsp90 is displaced and the receptor becomes a dimer with another
oestrogen receptor. This can be a homodimer, or in tissues with co-expression of ER- α and ER-β, a
heterodimer comprised of both receptor forms (Cowley et al., 1997; Pettersson et al., 1997). Once
activated the oestrogen receptor complex can bind to oestrogen response elements (EREs) in DNA
and regulate the activity of different genes (Kushner et al., 2000).
2.2.3
Activation of oestrogen receptors by phyto-oestrogens
Phyto-oestrogens differ in both their binding affinity for oestrogen receptors and their ability to
induce transcription through the binding of an oestrogen receptor to the oestrogen response
element.
Many phyto-oestrogens have greater binding affinity for ER-β than ER-α. Kuiper et al. (1998)
reported that compared with a normalised binding affinity of 17β-oestradiol for ER-α of 100, the
binding affinity of coumestrol was 20, genistein was 4 and daidzein was 0.1. When compared with a
normalised binding affinity of 17β-oestradiol for ER-β of 100, the relative binding affinity of
coumestrol was 140, genistein was 87, and daidzein was 0.5. Formononetin and biochanin A had
binding affinities less than 0.01 for both oestrogen receptor forms. Another study found that (S
)-equol preferentially bound ER-β, with an affinity comparable to genistein (Muthyala et al., 2004). The
difference in binding affinity between the isoflavones was due to the presence or absence of the two
hydroxyl groups. Compounds with one less hydroxyl group than genistein (daidzein, biochanin A) or
two less hydroxyl groups (formononetin) had less binding affinity for both oestrogen receptor forms
(Kuiper et al., 1998).
Although some phyto-oestrogens have similar binding affinities to 17β-oestradiol they are not as
potent. In the Ishikawa cell alkaline phosphatase assay (Markiewicz et al., 1993), compared to
oestradiol, coumestrol was 500 times less oestrogenic. Genistein, equol and daidzein were 1250,
1700 and 7700 times less oestrogenic, respectively.
Kostelac et al. (2003) reported the concentrations of the phyto-oestrogens that were required
10 concentrations of various ligands required to induce an increase in the binding of the oestrogen
receptor to the ERE by 50%, relative to oestrogen receptors without a ligand, were:
For ER-α: 17β-oestradiol (0.03 μM) > coumestrol (0.2 μM) > equol (3.5 μM) > genistein (15
μM) > daidzein (>300 μM)
For ER-β: 17β-oestradiol (0.01 μM) > coumestrol (0.025 μM) > genistein (0.03 μM) > daidzein
(0.35 μM) > equol (0.4 μM).
Lower concentrations of the phyto-oestrogens were required to activate the binding of ER-β to the
ERE compared to ER-α Kostelac et al. (2003). In particular, 500 times more genistein or 800 times
more daidzein was required to activate ER-α than ER-β. Of note however, is that daidzein is
metabolised in the rumen to equol, which was only 8.8 times more effective at activating ER-β than
ER-α. In addition, coumestrol at concentrations higher than 50 μM inhibited binding of ER-α to EREs.
For ER-β coumestrol did not inhibit binding, although it was lowered.
As well as interacting with oestrogen receptors, phyto-oestrogens can regulate endogenous
oestradiol concentration by binding or inactivating enzymes and modulate the bio-availability of
hormones by increasing sex hormone-binding globulin (SHBG) synthesis, which binds to oestradiol
and testosterone, inhibiting their function (Pino et al., 2000; Low et al., 2007).
2.2.4
Oestrogenic and anti-oestrogenic effects
Phyto-oestrogens can act in an oestrogenic or anti-oestrogenic manner. Anti-oestrogenic effects
occur when oestrogens compete with 17β-oestradiol for oestrogen receptors because
phyto-oestrogen bound receptors are less able to activate EREs than receptors bound with oestradiol (Tang
and Adams, 1980). In contrast, oestrogenic effects occur when the 17β-oestradiol concentration is
relatively low or absent. There is less competition for the receptor sites, and a net increase in
activation of EREs occurs.
This may explain why oestrogenic effects tend to occur in sheep, which have relatively low levels of
endogenous oestradiol, while anti-oestrogenic effects are usually reported in humans, who have
relatively high circulating oestrogen concentrations (Adams, 1995). Studies have also suggested a
biphasic effect of phyto-oestrogens (Mousavi and Adlercreutz, 1992; Hsu et al., 1999; Miodini et al.,
1999). At low concentrations some phytoestrogens have estrogenic activity which stimulates cell
growth, while at higher doses these phyto-oestrogens are anti-oestrogenic and inhibit cell growth.
The protective effects of the mammalian lignans enterodiol and enterolactone in humans against
11 SHBG, and by acting as antioxidants. Breast cancer cells in culture with either 17β-oestradiol or a low
concentration (0.5-2 μM) of enterolactone had proliferative growth, while both compounds together,
or a high concentration (10 μM) of enterolactone, had no stimulatory effect (Mousavi and
Adlercreutz, 1992). In postmenopausal women the oestrogenic lignans enterodiol and enterolactone
were associated with increased SHBG and decreased plasma testosterone, while equol was
associated with decreased oestradiol levels (Low et al., 2007).
Determination of phytoestrogen concentration
2.3
Isoflavones can comprise up to 5% of the dry weight of pasture plants and are not difficult to
measure, while coumestrol occurs in 10-fold lower concentrations and may also be more difficult to
extract (Adams, 1995).
2.3.1
Material preparation
2.3.1.1
Storage of fresh samples
Hanson et al. (1965) compared effects of aerobic and anaerobic storage of freshly cut lucerne on
coumestrol content. Heavily diseased lucerne was stored at 3°C and 29°C, in humid conditions. The
aerobic storage of lucerne was comparable to unfavourable field-curing conditions which would
normally result in mould and decomposition, while anaerobic conditions were compared to silage
production conditions. Aerobic samples were placed in perforated cellophane bags, and anaerobic
samples were placed in jars and air was replaced with nitrogen.
Coumestrol content of freshly cut lucerne ranged from 70 to 83 mg/kg DM. Under aerobic
conditions, coumestrol content increased during the first two days of storage. Material stored at 3°C
then levelled off slightly above the original amount while material stored at 29°C coumestrol content
declined rapidly, reaching 26 mg/kg DM on day six. After eight days the 29°C samples had begun to
decompose. Under anaerobic conditions coumestrol content of the material at 29°C remained
elevated but was variable, while at 3°C coumestrol remained constant between days 4 and 12.
2.3.1.2
Sample Drying
The preparation of material can alter the phytoestrogen concentration of plant samples. Bickoff et al.
(1960a) assayed lucerne as fresh forage and after oven drying. Although some of the samples lost no
oestrogenic activity on drying, others lost as much as three quarters or more of their original
oestrogenic activity. Drying time ranged from 45 minutes to 24 hours at 70°C, which depended on
the maturity and original moisture content of the sample. Little additional loss after 24 hours as
compared to 1 hour was found. Livingston et al. (1961) found that drying at 80°C in a forced-air oven