A REVIEW OF SOME EXISTING DRAG
MODELS DESCRIBING THE
INTERACTION BETWEEN THE
SOLID-GASEOUS PHASES IN A CFB
Paladi Lela Naga Ramesh (a) ; Dr. M.Raajenthiren (b) (a) Ph.D.Scholar at Anna Univeristy, Chennai;
(b) Professor, Anna University, Chennai
ABSTRACT
This paper examines the suitability of various drag models for predicting the hydrodynamics of the turbulent fluidization of FCC particles on the Fluent V6.2 platform. The drag models reviewed are Syamlal–O’Brien, Gidaspow, Arastoopour and Syamlal–O’Brien, . Comparison between experimental data and simulated results showed that the Syamlal–O’Brien, Arastoopour and Gidaspow models highly overestimated gas–solid momentum exchange and could not predict the formation of dense phase in the fluidized bed. The standard Syamlal–O’Brien drag model was then modified based on the minimum fluidization condition. This has proved applicable for FCC particles in turbulent fluidization for the high dense phase, density solid-up phase and low density phases under fast fluidization conditions. This was finally proposed to calculate the gas–solid exchange coefficient in the turbulent fluidization of FCC particles and was validated by satisfactory agreement between prediction and experiment.
Keywords: Fluidized Bed, Drag Model, FCC Partcles, Modeling
INTRODUCTION: Widespread industrial use of fluidized bed technology in coal & biomass combustion and
gasification depends on improved control of the fluidization process that demands a better understanding of fluidized bed hydrodynamics. These, for their very nature, are highly dependent on their hydrodynamic behavior which in turn is affected by the system geometry and size. Critical scale-up problems therefore arise, related to how accurately changes in performance with plant size can be accounted for at the design stage. Hence an appropriate model will attend the critical problems to maximize the operating performance characteristics. Every approach will have a set of constitutive equations. The closure models used with every constitutive equations need to close the solid phase momentum conservation equation for phase stress tensor τq, solid pressure, ps, and the momentum exchange between the solid and gas phases, Kgs. The momentum exchange is a function of virtual mass, lift and drag force. Stock [1] has shown that for gas-particle flows with ρs/ ρg= 1000 the virtual mass effect is insignificant and can be neglected. On the other hand, the lift force will be more significant for larger particles, but since the particle size used in this study is relatively small (70µm), the inclusion of lift force was neglected. Therefore, the gas-solid momentum exchange coefficient is assumed only to include the drag contribution. Selection of a drag model plays an important for any multiphase flow approach. The current paper discusses various different drag models available and suggests a best fitting model. The proposed drag model is validated against the existing data in the literature data.
LITERATURE REVIEW: Several drag models exist for the gas-solid interphase exchange coefficient. In this
combination of the Wen and Yu drag model and the Ergun equation[6]. The Wen and Yu drag model uses a correlation from the experimental data of Richardson and Zaki. This correlation is valid when the internal forces are negligible which means that the viscous forces dominate the flow behavior. The Ergun equation is derived for a dense bed and relates the drag to the pressure drop through porous media.
METHODOLOGY:As a result of the investigation, which involved applying different drag models for the
same system modeled in this study, the Syamlal and O’Brien drag model with a modification for the actual particle minimum fluidization condition was found to result in a better modeling results compared to the Gidaspow and Arastoopour drag models. Therefore, modified Syamlal and O’Brien drag model was used in this study to calculate the gas-solid interphase exchange coefficient.
Modifications done to the existing Syamlal and O’Brien drag model are:
Two constants P and Q are introduced
Limiting value for αg is defined while determining value for the constant B Gas-solid momentum exchange coefficient
(1)
The solids Reynolds number, Re, is calculated by
(2)
CD, the drag coefficient, is expressed as
(3)
And vr,s , the terminal velocity is expressed by:
(4)
With
(5)
and
(6)
B= for (7)
Where P&Q are specified based on minimum fluidization velocity.
The procedure applied to specify the parameter P and Q for the corresponding minimum fluidization velocity in the Syamlal and O’Brien drag model (equations 6 and 7) is explained in this appendix. User defined functions ( UDFs) of Fluent software allow a user to customize FLUENT to fit his particular modeling needs in order to enhance the existing FLUENT models. UDF used to modify the original Syamlal and O’Brien drag model .
Procedure for Specifying P and Q Values
Procedure for Specifying P and Q Values
(8)
(9)
Rel , the Reynolds number under terminal setting conditions for the multiparticle system, is given by Rel =γr,sRels
Rels the Reynolds number under terminal settling conditions for a single particle, is given by Syamlal and O’Brien (1987) as follows
(10)
Ar, Archimedes number, is expressed as
(11)
By combining Equations 4 and 9 the final equation can be modified as
(12)
The following equation can be used to correct the value of Q:
Q=1.28+log(P) / log(0.85) (13)
DATA USED: In the work this paper is based on a set of initial conditions used, is the same for all the drag models. Drag
or interfacial momentum exchange for two phases, one gas and one particle phase, is a function of the volume fraction of gas, gas density and viscosity, slip velocity and particle diameter. For comparison, all are assumed to be constant except the slip velocity. The gas will move faster if the volume fraction of particles is increased. It is assumed that the slip velocity is the fluidization gas velocity divided by the gas volume fraction. The values for the properties of the flow are given in Tab. (1) [7].
Table:1 Standard data used
Inlet Diameter of the Riser 76.2 mm
Height of the Riser 3.8 m
Gas Density 1.2 kg/m3
Gas Viscocity 1.85 x 10⁻⁵kg/ms
Particle average diameter 70µm
Particle Density 1600kg/m3
Mass flux 453kg/m2s
Particle to particle coefficient of restitution 0.99 Wall to Particle coefficient of restitution 0.9,0.95,0.99
Specularity coefficient 0,0.5,0.9
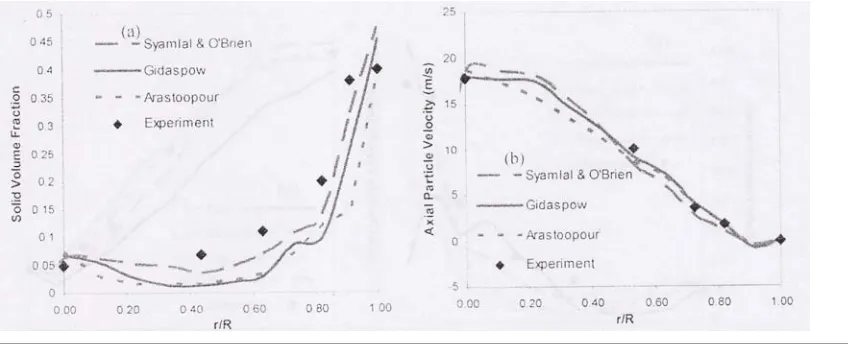
Figure 1: Radial profiles of solid volume fraction (a) and axial particle at different drag models (Z=3.8m, =0)
RESULTS AND DISCUSSION: Several drag models including Gidaspow, Arastoopour, and Syamlal and
O’Brien were compared. As the Syamlal and O’Brien drag model was near and accurate to the experimental values, it was modified for further accuracy . A modified Syamlal and O’Brien drag model is suggested based on the minimum fluidization condition of the FCC particles. As presented in Figure 1, the above mentioned drag models were examined and predicted quite similar solid volume fraction and axial particle velocities. The modified Syamlal and O’Brien drag model showed a better prediction at the core area. Syamlal and O.Brien drag model and Gidaspow drag model are default drag models in Fluent 6.2 [10], whereas the modified Syamlal and O.Brien drag model has been implemented by the author. Simulations with Fluent 6.2 are performed on a 2D fluidized bed with a uniform gas distribution. The results from the simulations with the different drag models are compared with respect to various minimum fluidization velocities. The computational results are also compared to experimental results. The computational results obtained using Modified Syamlal and O.Brien drag model give the best agreement with experimental data.
NOMENCLATURE
Symbols
A Area ,m2
Ar Archimedes number
C Courant number
CD Drag coefficient Cfr j Coefficient of friction
dl Diameter ,m
ei Restitution coefficient
Fi Force, N
g Acceleration due to gravity, m/s2 Gs Solid mass flux, kg/m2s
H Height ,m
I Stress tensor
K Turbulent kinetic energy, kg/s3m
Kgs Gas-solid momentum exchange coefficient
R,r Radius ,m
Re Reynolds number
T,t Time, s
U,u Velocity, m/s
vi Velocity, m/s
vrs Terminal velocity m/s
δ Delta function ( units vary) ρi Density, kg/m3
τi Stress tensor ,Pa φ Angle of Internal friction, 0
φgs Transfer rate of kinetic energy, kg/s3m
Others
∂ , d Differential operator Subscripts
B Bulk Dr Drift G Gas
I General index
Max Maximum
Mf Minimum fluidization
Min Minimum
P Particles
s solids
t Terminal (e.g., γt , is the terminal velocity) t Turbulent
q phase
w wall
Abbreviations
2-D Two dimensional 3-D Three dimensional CFB Circulating fluidized bed CFD Computational Fluid dynamics FCC Fluid catalytic cracking
Fluent CFD software developed and distributed by Fluent Inc HDCFB High density circulating fluidized bed
REFERENCES
[1] Stock,D.,Particle dispersion in flowing gases,J. Fluids Eng. 1966,118,4-17
[2] Gidaspow,D.,Bezburuah,R., and Ding,J., Hydrodynamics of circulating fluidized beds, kinetic theory approach. In Fluidization VII,Proceedings of the 7th
Engineering Foundation Conference on Fluidization 1992,75-82
[3] Arastoopour,H.,Pakdel,P., and Adewumi,M.,Hydrodynamic analysis of dilute gas-solids flow in a vertical pipe,Powder Technol.
1990,62,163-170
[4] Syamlal, M.,O’ Brien, T., Derivation of a drag coefficient from velocity-voidage correlation, US dept of Emery, Office of Fossil Energy, National Energy Technology Laboratory, Morgantown, West Virginia; April,1987.
[5] M. Syamlal, and T. J. O.Brien. The Derivation of a Drag Coefficient Formula from Velocity-Voidage Correlations. Unpublished report, April 1987.
[6] D. Gidaspow. Multiphase Flow and Fluidization-Continuum and Kinetic Theory Descriptions. academic Press, San Diego,1994. [7] J. Lundberg. CFD study of a bubbling fluidized bed. Master thesis Process Technology Hogskolen i Telemark, 2008.
[8] Liu,J.,Grace,J.,and Bi,X.,Novel multi functional optical fiber probe:I. development and validation, AICHE I. 2003,49,1405-1420 [9] Liu,J.,Grace,J.,and Bi,X.,Novel multi functional optical fiber probe:II. development and validation, AICHE I. 2003