Performance Comparison between
Gaussian NLFM, Rayleigh NLFM signals
B. Leelaram Prakash1 K. Raja Rajeswari2
1
Vignnan’s Institute of Information Technology, Visakhapatnam, India, [email protected]
2
A.U. College of Engineering (A), Visakhapatnam, India, [email protected]
Abstract— Pulse compression achieved with unweighted linear FM suffers from relatively high autocorrelation (ACF) sidelobes. Linear Frequency Modulation (LFM) is in practice. Non-linear Frequency Modulation (NLFM) is an alternative search. Two simple methods of shaping the signal are Gaussian NLFM, Rayleigh NLFM. In this paper an attempt is made to compare these NLFM signals with respect to their ambiguity plots and range resolution plots.
Key Words: Pulse Compression, LFM, NLFM, Ambiguity plot, Auto correlation function and Range resolution plot.
1. Introduction
In LFM [6] instantaneous frequency is linearly related to time i.e., in LFM the amplitude of the signal is kept constant while its frequency is varied linearly with time. The time frequency plot may have positive or negative slope which results in upward and downward chirps respectively. In NLFM [1], i.e., the instantaneous frequency is related to time in a non linear fashion. The nonlinearity here in Gaussian [5] NLFM is similar to the Gaussian distribution whereas in Rayleigh NLFM is similar to the envelope of Rayleigh [5] pulse, i.e., the frequency variations are similar to amplitude variations of these pulses. In this paper concept of NLFM is introduced and their ambiguity functions are obtained using MATLAB which are compared for further analysis i.e., for Range and Doppler resolutions.
2. Ambiguity Function
The ambiguity function[7] (AF) represents the time response of a filter matched to a given finite energy signal when the signal is received with a delay τ and a doppler shift υ relative to the nominal values (zeros) expected by the filter.
u
t
u
t
e
j tdt
,
*
2
(1)
where u is the complex envelope of the signal [2]. A positive υ implies a target moving toward the radar/sonar. Positive τ implies a target farther from the radar/sonar than the reference (τ = 0) position. The ambiguity function is a major tool for studying and analyzing radar/sonar [5] signals.
3. Linear Frequency-Modulated pulse
kt
dt
kt
d
t
f
2
2
1
1
j kt2e
T
t
rect
T
t
u
(2)where
T
B
k
(3)B is the bandwidth and T is the time period.
Fig.1 LFM signal u(t)
Fig.1 represents the LFM signal u(t). The instantaneous frequency f (t) is obtained by differentiating the argument of the exponential.
(4)
The instantaneous frequency is indeed a linear function of time. The frequency slope k has the dimensions s−2. The ambiguity function (AF) of a linear-FM (LFM) pulse is given by
(5)
For
T
Fig.2 Ambiguity plot of LFM signal for BT =10.
Fig.2 represents the 3-dimensional ambiguity plot of an LFM pulse which is obtained using MATLAB. 4. Wave form generation [3]
4.1 Gaussian NLFM:
The expression for a Gaussian pulse is given by
t
e
x
t
22
2
2
1
(6)where σ is known as the standard deviation. The Gaussian distribution is as shown in Fig.3.
.
Fig.3 The Gaussian Pulse
Fig.4 The Gaussian NLFM
It can be observed that in the Gaussian pulse the amplitude is increasing during the negative time axis and is decreasing during positive part of the time axis. Accordingly the NLFM signal that is obtained using the above Gaussian pulse will also vary its frequency in the similar manner. Fig.4 illustrates Gaussian NLFM the increase and decrease of frequency.
4.2 Rayleigh NLFM:
Fig.5 The Rayleigh Pulse for σ = 1.5
The expression for a Rayleigh pulse is given by
22
2 2
t
e
t
t
f
(7)where σ is known as the standard deviation.
The Rayleigh distribution is shown in Fig.5. The corresponding Rayleigh NLFM is shown in Fig. 6. It can be observed that in the Rayleigh pulse the amplitude is increasing first and then decreases. Accordingly the NLFM signal that is obtained using the above Rayleigh pulse will also vary its frequency in the similar manner. Fig.6 illustrates the increase and decrease of frequency. It may be observed that in both the Gaussian and Rayleigh NLFM the amplitude remains constant.
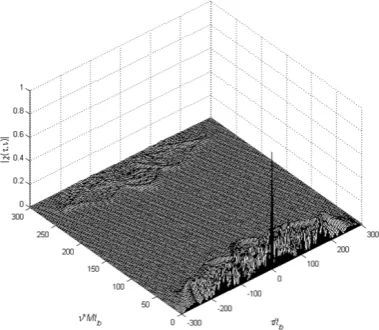
5. Ambiguity Functions of Gaussian, and Rayleigh NLFM
The ambiguity functions of Gaussian, Rayleigh NLFMs that are obtained using MATLAB are shown in Fig.7. From Fig.7 it is observed that Rayleigh NLFM has better range resolution among the two NLFM signals because the side lobe level in the Rayleigh NLFM is approximately -6.9dB whereas in the Gaussian NLFM it is nearly -6.2dB. The range resolution plot is also called auto correlation plot which may be obtained from Ambiguity plot because the Ambiguity function is a function of τ (range) and υ (doppler) where as the range resolution plot is only a function of the delay (τ).
6. Conclusion
In this paper Gaussian and Rayleigh NLFM signals are generated. Range resolution plots are used for the comparison purpose. From the figures it is concluded that Rayleigh NLFM is better compared to Gaussian NLFM as it contains low sidelobes with respect to range resolution. In the doppler domain the volume of the ambiguity plot with Gaussian NLFM is slightly higher compared to Rayleigh NLFM. Higher volume is undesirable as it possesses higher sidelobes. Because of its flat ambiguity plot Rayleigh NLFM is one of the best suitable in the sonar scenario.
Fig. 7(b) Ambiguity plot for Rayleigh NLFM
Fig. 8(a) Range resolution plot for Gaussian NLFM
Fig. 8(b) Range resolution plot for Rayleigh NLFM
REFERENCES
[1] Collins, T., and P. Atkins, Non-linear
[2] frequency modulation chirp for active sonar, IEE Proceedings: Radar, Sonar and Navigation, vol. 146, no. 6, December 1999, pp. 312– 316.
[3] Cook, C. E., and M. Bernfeld, Radar
[4] Signals: An Introduction to Theory and Application, Academic Press, New York, 1967.
[5] Johnston, J. A., and A. C. Fairhead, Waveform design and Doppler sensitivity analysis for nonlinear FM [6] chirp pulses,” IEE Proceedings, vol.
[8] Price, R., Chebyshev low pulse compression sidelobes via a nonlinear FM, National Radio Science Meeting of URSI, Seattle, WA, June 18, 1979.
[9] D. Waite, Sonar for Practicing Engineers John Wiley & Sons Ltd, England, 2002.
[10] Bassem R. Mahafza, Radar Systems Analysis and Design Using MATLAB, Chapman & Hall/CRC Press Washington, D.C, 2000 [11] Nadav Levanon & Eli Mozeson, Radar Signals, John Wiley & Sons Inc.., Hoboken, NJ, 2004
About Authors:
Mr.B.L.Prakash obtained his B.Tech. degree from Nagarjuna University, Nagarjuna Nagar, Guntur District, Andhra Pradesh, India in the year 1988. He obtained his M.E. degree from Andhra University, Visakhapatnam, India in the year 2003. Presently he is doing Ph.D at Andhra University under the guidance of Prof.K.Raja Rajeswari and working as a Professor in the department of Electronics and Communication Engineering, Vignan’s Institute of Information Technology, Visakhapatnam. He has published 8 papers in various National and International conferences. He is the recipient of Sastra award by Vignan’s Institute of Information Technology for the year 2008. He is the Vice-Chairman of I.E.T.E. Visakhapatnam center.
Prof.K. Raja Rajeswari obtained her B.E., M.E. and Ph.D. degrees from Andhra University, Visakhapatnam, India in 1976, 1978 and 1992 respectively. Presently she is professor in the Department of Electronics and Communication Engineering, Andhra University. She is Dean for Quality Assurance, Andhra University College of Engineering. She has published over 100 papers in various National, International Journals and conferences. She is the author of the textbook Signals and Systems
published by PHI. She is co-author of the textbook Electronics Devices and Circuits published by Pearson Education. Her research interests include Radar and Sonar Signal Processing, Wireless Communication Technologies. She has guided twelve Ph.D.s and presently she is guiding fifteen students for Doctoral degree. She is immediate past chairperson of IETE, Visakhapatnam Centre. Present she is Governing Council Member of IETE, New Delhi. She is the recipient of prestigious IETE Prof SVC Aiya Memorial National Award for the year 2009, Best Researcher Award by Andhra University for the year 2004 and Dr. Sarvepalli Radhakrishnan Best Academician Award of the year 2009 by Andhra University. She is expert member for various national level academic and research committees and reviewer for various national/international journals.