https://doi.org/10.5194/cp-14-1915-2018 © Author(s) 2018. This work is distributed under the Creative Commons Attribution 4.0 License.
Documentary data and the study of past droughts:
a global state of the art
Rudolf Brázdil1,2, Andrea Kiss3,4, Jürg Luterbacher5,6, David J. Nash7,8, and Ladislava ˇRezníˇcková1,2 1Institute of Geography, Masaryk University, Brno, Czech Republic
2Global Change Research Institute, Czech Academy of Sciences, Brno, Czech Republic
3Institute for Hydraulic Engineering and Water Resources Management, Vienna University of Technology, Vienna, Austria 4Department of Historical Auxiliary Sciences, Institute of History, University of Szeged, Szeged, Hungary
5Department of Geography, Climatology, Climate Dynamics and Climate Change,
Justus Liebig University Giessen, Giessen, Germany
6Centre for International Development and Environmental Research, Justus Liebig University Giessen, Giessen, Germany 7Centre for Aquatic Environments, School of Environment and Technology, University of Brighton, Brighton, UK
8School of Geography, Archaeology and Environmental Studies, University of the Witwatersrand, Johannesburg, South Africa
Correspondence:Rudolf Brázdil ([email protected])
Received: 30 August 2018 – Discussion started: 4 September 2018
Revised: 6 November 2018 – Accepted: 22 November 2018 – Published: 11 December 2018
Abstract.The use of documentary evidence to investigate past climatic trends and events has become a recognised ap-proach in recent decades. This contribution presents the state of the art in its application to droughts. The range of doc-umentary evidence is very wide, including general annals, chronicles, memoirs and diaries kept by missionaries, trav-ellers and those specifically interested in the weather; records kept by administrators tasked with keeping accounts and other financial and economic records; legal-administrative evidence; religious sources; letters; songs; newspapers and journals; pictographic evidence; chronograms; epigraphic evidence; early instrumental observations; society commen-taries; and compilations and books. These are available from many parts of the world. This variety of documentary in-formation is evaluated with respect to the reconstruction of hydroclimatic conditions (precipitation, drought frequency and drought indices). Documentary-based drought recon-structions are then addressed in terms of long-term spatio-temporal fluctuations, major drought events, relationships with external forcing and large-scale climate drivers, socio-economic impacts and human responses. Documentary-based drought series are also considered from the view-point of spatio-temporal variability for certain continents, and their employment together with hydroclimate recon-structions from other proxies (in particular tree rings) is
dis-cussed. Finally, conclusions are drawn, and challenges for the future use of documentary evidence in the study of droughts are presented.
1 Introduction
The term “drought” encompasses a complex phenomenon; it is used to express a prolonged period of negative devia-tion in water balance compared to the climatological norm in a given area (Wilhite and Pulwarty, 2018). Drought is a normal, recurrent feature of climate that occurs in virtually all climate zones (Svoboda and Fuchs, 2018). One of the related environmental phenomena associated with more fre-quent and severe drought can be desertification, which not only has an impact on the environment but may also have severe consequences for human society (e.g. Trnka et al., 2018). Thus, a better understanding of the processes lead-ing up to droughts, includlead-ing their predictability, is highly relevant to social well-being and individual quality of life.
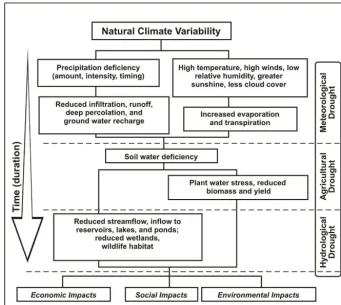
Figure 1. Sequence of drought occurrence and impacts for commonly accepted drought types. Source: http://drought.unl.edu/Education/ DroughtIn-depth/TypesofDrought.aspx, last access: 27 August 2018. Copyright: National Drought Mitigation Center, University of Nebraska-Lincoln, USA.
area. It can be enhanced by other meteorological factors like air temperature, air humidity or wind speed. Meteorological drought precedes other drought types. Agricultural drought is typically associated with a lack of water for plant growth and may last from several weeks to 6–9 months; forest stands may also be influenced by drought at the same timescales. Hydrological drought is characterised by a shortage or ab-sence of water in water courses, reservoirs or aquifers, typi-cally lagging behind meteorological and agricultural drought by weeks or months. Socio-economic drought occurs when the negative effects of drought appear in the whole society, influencing everyday life and socio-economic activities. Fig-ure 1 shows the sequence of drought occurrence and im-pacts for generally accepted types. Mishra and Singh (2010) add underground water drought to these types, as a sepa-rate category of hydrological drought. Recently, Van Loon et al. (2016a, b) proposed reworking the concept of drought to include the human role in mitigating and enhancing drought. The current authors consider drought the result of “complex interactions between meteorological anomalies, land surface processes, and human inflows, outflows, and [water] storage changes”.
Drought may be defined in terms of several different char-acteristics and indices (e.g. Heim, 2000, 2002; Keyantash
A range of indices have been used in many related stud-ies analysing worldwide drought patterns on the basis of temperature and precipitation measurements in the instru-mental period (e.g. Briffa et al., 2009; Dai, 2011; Sousa et al., 2011; van der Schrier et al., 2013; Spinoni et al., 2014, 2015), sometimes covering a time span of 2 or 3 centuries (e.g. van der Schrier et al., 2007; Todd et al., 2013; Haslinger and Blöschl, 2017). For the pre-instrumental period, two data sources in particular may provide drought information at quite high temporal resolution: tree rings and documentary data. The growth of trees – reflected particularly in tree ring widths, late-wood density and isotopes – may react signifi-cantly to moisture availability. Using long-term tree ring se-ries to reconstruct hydroclimate variables constitutes an im-portant part of dendroclimatology (e.g. Hughes et al., 2011). Such reconstructions may reflect spring–summer precipita-tion (e.g. Brázdil et al., 2002; Oberhuber and Kofler, 2002; Touchan et al., 2005; Wilson et al., 2005, 2012; Kern et al., 2009; Cooper et al., 2012; Dobrovolný et al., 2018b) or in-dicate drought directly, as expressed by PDSI (Esper et al., 2007; Nicault et al., 2008; Büntgen et al., 2010a, b; Touchan et al., 2010; Cook et al., 2014). In a recent approach, Cook et al. (2015) presented the Old World Drought Atlas (OWDA), a tree-ring-based reconstruction of the summer season (JJA) self-calibrated Palmer Drought Severity Index (scPDSI; van der Schrier et al., 2013). For an even more recent worldwide overview of hydroclimate reconstructions based on tree rings and other natural proxies, the reader is referred to PAGES Hydro2k Consortium (2017); for African hydroclimatic vari-ability over the past 2000 years see Nash et al. (2016a).
While tree ring information may facilitate resolution of precipitation or drought reconstruction for a specific season of the year, such seasonal restrictions do not apply to docu-mentary evidence (e.g. Brázdil et al., 2005, 2010). Depend-ing on the spatio-temporal availability of weather-related documentary data, it is possible to reconstruct monthly, sea-sonal and annual precipitation indices (e.g. Glaser et al., 1999; Pfister, 1999; Glaser, 2001, 2008); precipitation totals (e.g. Pfister and Brázdil, 1999; Dobrovolný et al., 2015a); in-dividual droughts (e.g. Dodds et al., 2009; Hao et al., 2010; Zhang and Liang, 2010; Brázdil et al., 2013; Wetter at al., 2014; Brázdil and Trnka, 2015; Kiss and Nikoli´c, 2015; Kiss, 2017; Brázdil et al., 2018); drought frequency (e.g. Bar-riendos, 1997; Piervitali and Colacino, 2011; Brázdil et al., 2013; Noone et al., 2017); and drought indices (Brázdil et al., 2016a; Možný et al., 2016b; Dobrovolný et al., 2018a).
The aim of this article is to present the state of the art for spatio-temporal analyses of droughts derived from documen-tary evidence for a special issue ofClimate of the Past enti-tled “Droughts over the centuries: what can documentary ev-idence tell us about drought variability, severity and human responses.” Following the Introduction, Sect. 2 describes the types of documentary evidence that contain drought-related information. The general features of such evidence – to-gether with reconstructions of precipitation series, drought
frequency series and drought indices series – are discussed in Sect. 3. Section 4 provides an overview of papers on documentary-based droughts with respect to their long-term fluctuations, their severity, the effects of atmospheric circu-lation and forcings, socio-economic impacts and human re-sponses. Spatio-temporal drought variability in a number of areas and the use of documentary-based droughts in hydrocli-mate reconstructions from other natural proxies are discussed in Sect. 5. This is followed by some concluding remarks and perspectives upon future drought studies in Sect. 6.
2 Documentary evidence
Detailed descriptions of documentary evidence related to past droughts available in a range of countries may be found in, for example, Nicholson et al. (2012a), Brázdil et al. (2013), Brázdil and Trnka (2015), and Domínguez-Castro and García-Herrera (2016). The main source types of docu-mentary data used for such investigations are described be-low. This overview provides examples of each. It does not aim to provide an overview of spatial world coverage, since practically all the types of documentary evidence are poten-tially available in any part of the inhabited world with a writ-ten tradition, whether or not utilised in drought reconstruc-tions to date. Typical examples have been chosen to describe each (commonly known and defined) source type in a brief and informative way; the length of each section is not propor-tionate to the spatial distribution of available drought-related documentary sources or published analyses.
re-ports drought in CE 823 (Pertz, 1826, p. 93): “Hard winter, equally severe drought, and great famine.” The Russian Nov-gorod chronicle mentions drought and its impacts in the re-port for Polotsk (Belarus) in CE 1092 (Cross and Sherbowitz-Wetzor, 1953, pp. 173–174): “6600 [1092]. An extraordinary event occurred at Polotsk. At night there was heard a clat-ter and groaning in the streets, and demons ran about like men. [. . .] At this time, a sign appeared in the heavens like a huge circle in the midst of the sky. There was a drought in this year, so that the earth was burned over, and many pine forests and peat-bogs were consumed. There were many por-tents in various localities, and incursions of the Polovcians were reported from all quarters.”
2.2 Diaries
For the purposes of this contribution, diaries are considered more-or-less regular daily visual observations of the weather and related phenomena, recorded by their authors for var-ious reasons in ephemerides, calendars, and work-related or personal diaries (for a review of private diaries see e.g. Adamson, 2015). Some of these concentrate largely upon weather records such as that kept (in Latin) by the Reverend William Merle, Rector of Driby, Lincolnshire, England, be-tween 1337 and 1344. In his record for May 1342 he men-tions a drought that year (Symons, 1891, unpaginated): “It is to be noted that not much rain fell between the 9th of April and 20th of May, but there was dryness [siccitas] with con-siderable heat.” He returned to this drought in his final com-ment for 1342 (ibid.): “It is to be noted that there was dryness about April this year, as there was in the years of Our Lord 1333 and 1340.”
Detailed daily weather records may also be gleaned from standard diaries from among other, non-meteorological, in-formation – see, for example, the diaries of the Premon-stratensian order in Hradisko Monastery and the abbey Svatý Kopeˇcek near Olomouc (Czech Republic), which span the 52 years from 1693 to 1783 (Brázdil et al., 2008a). Drought is reported in these diaries for 17 years, with particular mention of dry periods that occurred during the April–September pe-riod (which is critical to agricultural crop production). For example, according to the record for 19 September 1750, drought prevented autumn sowing, and prayers for rain were organised on 23 September (archival source 7 – AS7).
Missionary and travel diaries are also important sources of weather information for regions in which meteorological ob-servations started comparatively very recently. One example is provided by Peter Heinrich Brincker, a German missionary of the Rheinische Missionsgesellschaft from Wuppertal, who described a drought in Otjikango, central Namibia, in a report dated 10 September 1869 (AS1; Grab and Zumthurm, 2018, p. e656): “The drought and its consequences, the hunger, impacts us all very hard and many poor people are dying from exhaustion. Yes, some days back it was mentioned that amongst the Ovatjimba or poor Herero, the hunger is so
large, that they have resorted to cannibalism, which might well be an exaggeration.”
2.3 Financial and economic-administrative records Financial and economic-administrative sources consist of documents prepared at various levels of governmental or state administration. Compared to narrative sources, they contain much more practical, exact or numerical information (in addition to descriptive evidence) on socio-economic im-pacts, such as the low quantity (or worse quality) of harvests and the extent of other negative consequences such as the level of food shortage, loss of domestic animals etc. Further, the different economic aspects of drought may be listed in a more systematic way than in other types of sources, giving an opportunity to obtain additional information about less out-standing drought events. For example, damage to agricultural production related to extreme hydrological and meteorologi-cal events constituted grounds, in some regions, for the rebate of taxes, a system well developed in the Czech Lands in the 17th–20th centuries (e.g. Brázdil et al., 2006, 2012; Dolák et al., 2013). A plethora of documents relevant to Czech appli-cation processes are preserved at the level of local, regional and state administrations. A good example of this important source type may be cited in the form of a request for finan-cial support from the Valašská Polanka settlement, addressed to the I. R. District Office in Valašské Meziˇríˇcí on 28 Au-gust 1904 (AS6): “[...] this year [1904], our poor peasants are very distressed, because the grain – due to great drought – became dry 14 days earlier than in other years, the grains are small and the straw on local hills has remained short, [there was] no aftermath from dried-out meadows and no second clover, [while the] potatoes in some places [are] already dry and small and starting to rot, and of cabbage there is nearly none. Because there is neither aftermath nor second clover, [people] are having to give their livestock dry feed already, of which there is very little, and therefore, for shortage of feed, much livestock, the main farming resource in the local moun-tainous landscape, has to be sold off by whatever means [...]”. An example from Asia may be found in an imperial edict from the early spring of 1878, reporting a dry episode in northern China (Hao et al., 2010, p. 2003): “Shanxi, Henan, Shaanxi and other provinces in the prior year [1877] expe-rienced severe drought, snow in the winter [1877/1878] was insufficient; although the farmers prayed for many times, it did not get enough precipitation yet.”
2.4 Legal-administrative evidence
witchcraft were often held responsible for drought by their “taking the rain/dew away”. A typical example is the great Szeged (Hungary) witchcraft trial that started in 1718 and ended in 1728 and 1729 (see e.g. Petrovics, 2005). Drought was reported in the witchcraft trial confession protocols in 1728 (Reizner, 1899, pp. 375–376), as follows: “10th wit-ness. The proud and respected Stephanus Vastagh, citizen, aged c. 80. Confessed in Christian faith that not long ago the problem of the great drought was mentioned, and also that it would be in fact a scourge of God. Pál Kovács, the judge of the beggars, suggested that this great drought was not from God, but in fact the rain was sold to Turkey by the witches.” There also exists legal-administrative evidence in the form of a juridical manuscript from Litomˇeˇrice (Czech Republic) that contains a record dated to 1503 (AS8): “The summer was so dry that such aridity could not be recalled in thirty years [and] on many brooks and rivers they could not mill because of the drought, and there was a bad harvest in the fields; of the spring grain there was almost nothing and in many places they had to tear it off [by hand] because it was impossible to reap; the wine was very good this year and [there was] great frost this summer in the mountains on St. Laurentius for three full days [20–22 August], but the dryness was huge [sic].” Other controversies generated by drought could be related to the use and allocation of water resources, a perennial problem that always tended to be ex-acerbated by periods of hot and dry weather (see e.g. Kiss, 2017). A third type of legal documentation relates to dis-putes centring around field surveys, land ownership and the boundaries of lands that were made available for utilisation in multi-annual dry/drought periods. For example, along the southern shoreline of Lake Fert˝o/Neusiedl in western Hun-gary, historic land surveys document in detail investigations of ownership debates over dried pastures, together with de-scriptions of 17th–18th-century drought events presented by eyewitnesses (Kiss, 2005).
2.5 Religious sources
Rogation ceremonies – formal, organised congregations and processions gathered to beseech God for rain – are described in important ecclesiastic sources. They tend to be a feature of Roman Catholic church accounts but were also reported by other branches of religion. Rogation ceremonies were per-formed for two main reasons: to plead with God for the end of drought (pro-pluviarogations) or cessation of wet/stormy periods (pro-serenitate rogations) that endangered or even damaged agricultural production (e.g. agricultural drought). They were often included in “Chapter Acts”, i.e. documents produced by local governments. Pro-pluvia rogations pro-vide a good drought indicator from the 15th to the 19th cen-turies in Europe (in certain areas in Spain they are performed to this day). For example, a report for level I of the rogation ceremony in Barcelona from 3 March 1691 reads as follows (AS2; Martín-Vide and Barriendos Vallvé, 1995, pp. 217–
218): “The syndic of the city [municipal authority] has ar-rived in the Chapter [ecclesiastical authority] on behalf of the Council, bringing the message of the very great need for Wa-ter and they have deemed it justified that the ChapWa-ter convoke rogation ceremonies; after hearing this message, the Chap-ter has deChap-termined to follow the usual way in similar situa-tions, and to have the prayer for rain at Mass, beginning on the 4th of this month [March] [. . .]”. Martín-Vide and Bar-riendos Vallvé (1995) and BarBar-riendos (1997) developed the Drought Rogation Index, taking into account five levels of drought intensity/duration according to the hierarchic system of rogation ceremonies performed in Barcelona (Spain). Ro-gation ceremonies as dry/wet proxies have been analysed in many papers covering Spain and Portugal (see Domínguez-Castro et al., 2008, 2012; Fragoso et al., 2018; Tejedor et al., 2018, and references therein), Italy (Piervitali and Cola-cino, 2001) and France (Garnier, 2014). Rogations are also well known in former Spanish colonies in Central and South America (e.g. Domínguez-Castro and García-Herrera, 2016; Domínguez-Castro et al., 2018; Guevara-Murua et al., 2018): in Mexico starting in the 1590s (Garza and Barriendos, 1998; Garza Merodio, 2002); in Equador, Peru and Argentina since the 16th century (Huertas Vallejos and Ortlieb, 1992; Prieto et al., 2000; Prieto and García Herrera, 2001, 2009; Gascón and Caviedes, 2013); in Colombia between the 16th and 20th centuries (Jurado Jurado, 2004; Ulloa, 2014); and in Brazil from the 18th century to the current day (Heathcote, 2013). Finally, rogations have also been reported from the Philip-pines since the 16th century (Warren, 2013).
2.6 Letters
Figure 2.(a)Title page of “Key to the Rain, or a New Song for a Time of Drought”, second edition, published in Prague in 1679 (AS4); (b)introductory page of “Song in Need of Rain” from manuscript records of Antonín Štˇepán, a citizen of Pelhˇrimov (Martínková, 2005).
2.7 Songs
Songs may provide an expression of certain extreme events in artistic or common form, describing both conditions at the time (e.g. flood, windstorm, hail) and their damaging effects. Two examples have been described from the Czech Lands (Brázdil and Trnka, 2015; Fig. 2). The severe drought in 1678 was the inspiration for the song “Key to the Rain, or a New Song for a Time of Drought” (Klíˇc od deštˇe aneb Nová píseˇn v ˇcas sucha), published in Prague in 1678 and a year later (AS4). From its first lines it follows that the first post-drought rain fell as late as Saint Wenceslas Day (i.e. 28 September): “In this year of grace one thousand / And at the same time six hundred / And seventy-eight / On the Day of Saint Wenceslas / Honour and glory be to God / Water is given to us from the sky. / At the intercession of the Mother of God / [Crop] Yields gladly increase / Little rains serve well. / Through heaven’s Majesty / A little rain fell in quietness / Aside from all human concerns.” A similar song entitled “Song in Need of Rain” (Píseˇn za d隡t potˇrebný), related to a severe drought in 1790, stems from the manuscript of Antonín Štˇepán, a wealthy cit-izen of Pelhˇrimov (Martínková, 2005).
2.8 Newspapers and journals
Droughts and their impacts are types of hydrometeorologi-cal extremes frequently reported in newspapers and
Sunday [21 June 1885], will be beyond recall, since it has al-ready turned yellow and dried up completely. The latest [bar-ley] is not even coming into ear. The legumes are coming to the end of their flowering very poorly and are also about to dry up. [. . .] The fruit appeared to be coming on nicely; now it has already started to fall, Walnut trees have suffered the most. The clover was sparse [. . .].” Farther afield, another ex-ample of newspaper coverage reports a drought (1887–1888) in Tasmania (Mercury, 3 February 1888, p. 3; Evans, 2012, p. 209): “The weather continues to be dry and hot, and the surface of the earth [. . .] presents a uniformity of parched and blackened barrenness. The remains of what was once grass is now almost powder, and could be blown away, and the young growth of trees, which would otherwise yield a subsistence for cattle, has been consumed by the bush fires.”
2.9 Paintings and pictographic evidence
Paintings and pictures have been used throughout history to present and commemorate various events, including those re-lated to the weather, that have had important impacts upon societies. The Aztec people in central Mexico produced pic-torial “books” (or “codices”) painted on skins or native amatl (bark) paper, which described religious and political events and natural phenomena for individual city states ( al-teptl). Therrell et al. (2004) identified 13 drought years be-tween CE 1332 and 1543 from such codices. The Aztec belief was manifested in cyclical drought-induced famines associ-ated with the calendar icon known as One Rabbit (Fig. 3). Nine of the identified droughts were also reflected in below-average tree ring widths in Douglas fir chronologies from central and northern Mexico (ibid.).
Gallo and Wood (2015) used Native American picto-graphic evidence (known as “winter counts”) for the study of past drought events in the US Great Plains. Starting with annual documentation of significant events from the late 1600s, these counts evolved into drawings or picto-graphic records of the major events of the year (see Fig. 1 in the quoted paper). Winter counts were related to the pe-riod between the first snowfalls of successive years. Win-ter counts were the responsibility of a specific keeper who would consult with a council of elders as to which events were important enough to be recorded. From these counts, included in five printed or online documents, Gallo and Wood (2015) identified 10 prolonged dry or drought events between 1700 and 1880 that correspond with other observa-tions or available information (particularly with PDSI values from the North American Drought Atlas by Cook and Kru-sic; http://iridl.ldeo.columbia.edu/SOURCES/.LDEO/.TRL/ .NADA2004/.pdsi-atlas.html, last access: 27 August 2018).
2.10 Chronograms
Chronograms are paintings or carvings depicting memorable events (years) that significantly affected society (including
Figure 3.Expression of dust storms and people who succumbed to famine, from the Codex Telleriano-Remensis (AS3), folio 32v(erso), portraying the famine of the year of the One Rabbit in 1454 (year sign for One Rabbit, top right). According to Therrell et al. (2004), the famine resulted from a multi-year drought, possibly coupled with an early autumn frost in 1453.
droughts) for common/public remembrance/memory. Many were not only painted on walls of buildings or carved on stone statues but could also form a part of chronicles or other narratives, at least from the Antique period onwards. Selected letters in the record are then interpreted as Roman figures (in the form of large or highlighted letters) and indi-cate the year of the event. One example is a Latin entry in the records of Hieronymus Haura, a member of the Augus-tinian order in Brno (Czech Republic), commemorating the drought of 1746 (AS5):
“Personat heV! tuIstIs VoX: SVCCIs aret aDeMptIs / Noster ager sItIVnt fontes, herbaeqVe, feraeqVe.”
Figure 4.A hunger stone that appeared during the severe 1904 drought, situated on the left bank of the river Elbe at Dˇeˇcín-Podmokly, with records of years and low water levels and a warning inscription (O. Kotyza archive).
2.11 Epigraphic evidence
Low water levels in rivers were often recorded by marks on large stones located in river beds and appearing during low-water stages, in this way identifying long periods of hydro-logical drought. Because drought periods were usually ac-companied by bad harvests and even famines, they became known in some areas as “hunger stones”. Using this type of epigraphic evidence requires analysis of the reliability of the marks in question, as some could have been created with-out direct relation to a low-flow event. A stone located on the left bank of the river Elbe at Dˇeˇcín-Podmokly (Czech Republic) is one example (for other hunger stones on the Elbe in German Magdeburg and Dresden, see Elleder, 2016). Records chiselled on the stone commemorate low water lev-els in 1417, 1616, 1707, 1746, 1790, 1800, 1811, 1830, 1842, 1868, 1892 and 1893 (Fig. 4). They are accompanied by the inscription:Wenn du mich siehst, dann weine(If you see me, then weep), warning of the consequences of drought, e.g. a bad harvest, lack of food, high prices and hunger for poor people. A similar hunger stone known as the “Laufenstein” was used by Pfister et al. (2006) to study low water levels in-dicating hydrological drought in the river Rhine in Switzer-land; a stone named the “dearth stone” is also known on the river Danube at Budapest (Hungary) (Palotay et al., 2012).
2.12 Early instrumental observations
Instrumental meteorological observations, initiated by indi-viduals or official bodies before the establishment of stan-dard meteorological networks in certain countries, may be considered “early instrumental observations” (e.g. Camuffo and Jones, 2002; Domínguez-Castro et al., 2014b, 2017; Slonosky, 2014). As well as instrumental data, they may also incorporate weather descriptions, including
hydromete-orological extremes such as drought. For example, Thomas Heberden added information about very dry years in 1749 and 1750 to his meteorological measurements (1747–1753) at Funchal (Madeira), in which “the corn was destroyed, and the fruit-trees suffered much, particularly the peach-trees, the fruit either falling to the ground, whilst green, or, if it re-mained longer on the tree, being full of white worms” (Alco-forado et al., 2012, pp. 357–358).
2.13 Society reports
2.14 Weather compilations
Weather compilations, including information about drought events, are available for many different areas and time intervals (e.g. see Weikinn (1958–2002) for Europe, and Réthly (1962, 1970) and Réthly and Simon (1999) for the Carpathian Basin; for a critical source evaluation see Kiss (2009)). If such compilations are not prepared by historians, past and present, biases may arise out of unreliable documen-tary sources that lead in turn to the inclusion of erroneous data and the duplication or misidentification of reported events (e.g. Bell and Ogilvie, 1978). Such compilations should, therefore, be checked for socio-temporal reliability, and any unreliable, uncertain and clearly non-contemporary references should be removed. Even better source collections or databases, compiled by skilled historians with a source-critical approach (e.g. Malewicz, 1980; Alexandre, 1987), sometimes require additional source analysis. Despite these problems, the importance of such compilations or books should be emphasised here, as they may be the only available sources for direct climatological analyses in certain regions. For example, Borisenkov and Pasetskiy (1988) published a thousand-year history of unusual natural events, including drought events (zasucha), based on Russian written sources (for an extension of unusual natural events back to the 5th century BCE see Borisenkov and Pasetskiy, 2002). The same study also reported droughts beyond Russian territory, particularly in “western Europe”.
Several historical climatology research groups have de-veloped electronic databases containing information about drought and related phenomena (Decker, 2018). Most were initiated due to the need to manage and analyse large amounts of historical-climatological data, and to make these data accessible to international researchers. The first such database, with roots in the late 1970s, was initiated by the historian Christian Pfister in Bern, containing data not only from his native Switzerland but also for other countries within Europe and beyond. The historical development of the Euro-Climhist database and its recent status are described in detail at http://www.euroclimhist.unibe.ch (last access: 27 August 2018). In Germany, Rüdiger Glaser (University of Freiburg) was a prime mover in the creation of the HISKLID historical climatological database, which was subsequently extended into https://www.tambora.org/, a new web-based collaborative research environment (CRE) for historical cli-matology and environmental research (Riemann et al., 2015). Documentary data and early instrumental meteorological observations for Japan are available at http://jcdp.jp (last access: 27 August 2018), a result of rescue activities under the Japan-Asia Climate Data Program. A large set of Chinese documentary sources, published by De’er Zhang in 2004 (first edition) and 2013 (second edition), was digitised under the supervision of Pao-Kuan Wang from the Research Cen-ter for Environmental Changes, Academia Sinica, Taipei,
Taiwan, in the form of the REACHES (Reconstructed East Asian Climate Historical Encoded Series) database (Wang et al., 2018).
3 Methods of drought reconstruction from documentary evidence
The individual categories of drought reported in Sect. 1 may be well described by the various types of documentary data mentioned in Sect. 2. As follows from Table 1, reliably dated accounts describing a lack of precipitation, as well as infor-mation summarising dry periods during particular months or seasons, can be used to identify meteorological droughts. Ac-counts of low water levels in rivers, lakes and ponds, together with descriptions of a general shortage of water, are clear sig-nals of the occurrence of hydrological drought. Bad or failed harvests of agricultural crops, accompanied by a description of their causes, can be indicators of agricultural drought. Be-cause documentary data also provide important details about societal behaviour, accounts of drought consequences and impacts can be used to detect socio-economic drought.
The extraction of drought information from documentary sources requires a source-critical approach generally applied to scientific work in historical climatology (for more detailed discussion see e.g. Brázdil et al., 2005, 2010). It includes the following important steps: (i) the use of primary sources to avoid possible errors that may appear in secondary sources (e.g. weather compilations as mentioned in Sect. 2.14 or in-formation from hearsay, i.e. events not directly experienced by the author); (ii) a source-critical approach to eliminate the effects of non-climatic factors (e.g. to avoid possible “so-cial bias”, taking in account broader socio-economic knowl-edge related to the given source); (iii) cross-checking of data from spatial and temporal perspectives by combining differ-ent types of documdiffer-entary sources; and (iv) careful meteo-rological (climatological) interpretation and analysis of the available evidence based on knowledge of recent climatic patterns in the area. Applying these principles allows the true spatial extent, duration, severity and impacts of individual drought events to be identified.
A number of approaches may be taken to compile long-term series of drought frequency and/or magnitude from doc-umentary evidence. Rich docdoc-umentary evidence allows the creation of various types of precipitation/drought indices, many of which may result in different hydroclimate recon-structions:
Table 1.Indicators of individual types of drought in documentary evidence.
Type of drought Documentary indicators
Meteorological Accounts of a lack of rain, drought, dry weather, hot and dry weather, periods without rain, dust on roads, rain that hardly moistened the soil, rain needed, “beyond-living-memory” drought (dryness)
Agricultural Accounts of complete failure of crops or bad harvest, lack of seed, lack of feed for livestock, cracked earth, dried-out pastures, limited availability of straw, conditions that are impossible for soil cultivation or sowing, tearing of grain by hand rather than reaping, caterpillars and other pests, damage to crops
Hydrological Accounts of the appearance of hunger stones; low water levels in rivers; stand-ing and/or green water in rivers; crossstand-ing of otherwise large rivers “barefoot” or with wagons; drying out of springs, wells, fountains, brooks, streams and fish cultivation ponds; lack of water for people and animals; sale of water; water-mills out of operation; cessation of river transport; lack of water for extinguish-ing fires. (Note that many of these indicators require careful interpretation in dry-climate regions of the world where dry seasons are a common part of the hydrological pattern.)
Socio-economic Accounts of food shortages, increase of prices (grain and other crops), poverty, debt, distress, famine, requests for tax reduction, administrative measures, raised awareness of witchcraft and other rain-related ritual practices, human mortality, disease, epidemics, emigration, building and forest fires, sale of live-stock at below normal market prices
dry; −1: dry; 0: normal; 1: wet; 2: very wet; 3: ex-tremely wet) scales are the most widely used in Europe (e.g. Pfister, 1992, 1999, 2001; Glaser, 2001, 2008; Xo-plaki et al., 2001; Dobrovolný et al., 2015a) and Africa (e.g. Nicholson et al., 2012a, b; Nash et al., 2016b, 2018). Monthly indices may be added up to obtain sea-sonal (e.g. between−9 and 9 on a seven-degree scale) or annual (e.g. between−36 and 36 on a seven-degree scale) series of indices (Fig. 5a). Other similar scales may also be used (cf. Rodrigo et al., 1999; van Enge-len et al., 2009; Ge et al., 2016; Guevara-Murua et al., 2018). Where there is an overlap of indices with se-ries employing instrumental precipitation records, stan-dard palaeoclimatological approaches based on the use of calibration/verification periods may be employed for quantitative precipitation reconstruction (see e.g. Do-brovolný et al., 2009, 2015a). The lack of an over-lapping period between documentary and instrumental data is more challenging. However, Rodrigo (2008) pre-sented one approach to reconstructing precipitation for decadal or longer time units based on counting the num-ber of extreme events in the past and inferring mean and standard deviation using the assumption of normal distribution. This approach was used to develop winter rainfall series for 30-year periods in Andalusia (Spain) for 1501–2000. Quantitative precipitation series may subsequently be used for the statistical analysis of wet and dry periods, trends, and extremes in the long-term.
ii. Drought frequency series.The types of drought infor-mation recorded in documentary evidence allow se-lected drought episodes to be identified and presented as long-term chronologies (e.g. Gioda and Prieto, 1999; Jiang et al., 2005; Mendoza et al., 2005a; Noone et al., 2017). In these types of series, the criteria used by individual authors to identify droughts may have a significant influence upon homogeneity. For example, Brázdil et al. (2013), applying precipitation indices be-tween−1 and−3 (see point i), used at least two consec-utive “dry” months to define episodes of drought for the Czech Lands in the pre-instrumental 1501–1803 period. In the instrumental period from 1804, the frequency of drought episodes was compiled from the calculation of SPEI-1 andZ-index values, from which those of con-current occurrence and a return period of 2 years or more were reflected as drought episodes to obtain a long-term drought chronology (Fig. 5b).
calcula-tion of drought indices from documentary data is still in its early stages. A further drought index reconstruc-tion from the Czech Lands has been derived from series of grape harvest dates, which are normally used only for air temperature reconstructions (e.g. Chuine et al., 2004; Meier et al., 2007; Maurer et al., 2009; Moreno et al., 2016). The series created for the Bohemian wine-growing region (located particularly north-west of Prague) since CE 1499 has been used not only for the reconstruction of April–August temperatures (Možný et al., 2016a) but also for the reconstruction of April– August SPEI (Možný et al., 2016b). This SPEI recon-struction (Fig. 5d) is a challenge for testing similar rela-tionships and possible drought reconstructions in other relatively drier wine-growing areas in Europe.
4 Results
This section presents a global overview of papers dealing with documentary-based drought reconstructions with re-gard to long-term spatio-temporal variability, major extreme events, atmospheric circulation and climate forcing, socio-economic impacts and human responses.
4.1 Long-term precipitation and drought series
As a large number of papers describing documentary-based droughts exist worldwide, this section is further divided geo-graphically, by individual continents.
4.1.1 Europe
In the British Isles, Ogilvie and Farmer (1997) used “precip-itation scores” to classify the character of monthly precipi-tation for England in CE 1200–1439 based on available doc-umentary evidence. For dry patterns they used scores of−2 (slightly more dry than normal) and −3 (particularly dry). Despite many absent scores, it was possible to at least inter-pret relative precipitation characteristics for June and July. Several papers have addressed drought conditions in Ireland. Noone et al. (2017) used SPI values calculated from a precip-itation network (1850–2015) and reconstructed precipprecip-itation from newspapers and other documentary data from 1765 to create a drought catalogue for the island of Ireland. Excep-tionally long drought periods were identified for 1854–1860 (continuous droughts) and 1800–1809 (three droughts with brief interludes). For the period after 1850, they reported six other droughts with island-wide fingerprints and increasing dryness expressed by SPI from the 1990s onwards. Mur-phy et al. (2017) compiled a 250-year drought catalogue for Ireland. Although most of the descriptions concentrated on particular events and their socio-economic consequences, drought poems as well as prayers for rain were also found among newspaper entries. Multi-seasonal droughts occurred
in the 1800s, 1820s, 1850s, 1880s, 1920s, 1930s, 1950s and 1970s (some of the characteristic drought years – such as 1806, 1887 and 1893 – were analysed individually). More recently, Murphy et al. (2018) extended the Ireland monthly precipitation series back to 1711 using early instrumental and documentary series from before 1850.
For central Europe, Gimmi et al. (2007) used eight differ-ent weather diaries from observers around the city of Bern (Switzerland) to compile qualitative information about pre-cipitation from 1760 to 1863. These data were combined with precipitation measurements from 1864 onwards to recon-struct precipitation series for Bern for the entire 1760–2003 period. As noted in Sect. 3, several papers have reported on droughts in the Czech Lands. Brázdil et al. (2013) analysed droughts for the past millennium based on documentary data and instrumental records. Although the oldest credible docu-mentary source speaks of a dry winter in CE 1090/1091, only 36 drought episodes prior to CE 1501 were reported in the Czech documentary evidence. Based on monthly drought in-dices in the pre-instrumental period between 1501 and 1803, they delimited various drought episodes; these were com-bined with SPEI-1 andZ-index indices calculated for the in-strumental period from 1804 to compile a 500-year drought frequency series (Fig. 5b). Later, Brázdil et al. (2016a) recon-structed series of seasonal, half-year and annual SPI, SPEI,
Z-index and PDSI for the 1501–2014 period (Fig. 5c). The driest episodes occurred around the beginning and end of the 18th century, and 1540 was identified as a particularly ex-treme dry year. Možný et al. (2016b) reconstructed April– August SPEI series from grape harvest dates in the Bo-hemian hop- and wine-growing region north-west of Prague for CE 1499–2012 (Fig. 5d). The reconstructed SPEI se-ries, explaining 75 % of the drought variability since 1841, showed a firm agreement with other SPEI reconstructions from the Czech Lands based on documentary and instrumen-tal data.
et al. (2010) also used rogation series from Bilbao, Catalo-nia, Zamora, Zaragoza, Toledo, Murcia and Seville to study drought occurrence over the Iberian Peninsula for the 1600– 1750 period. While droughts during the first half of the 17th century were quite localised, those in subsequent years af-fected broader regions, or even the whole peninsula. The two most extended droughts occurred in 1664 and 1680. Teje-dor et al. (2018) compiled a new dataset of rogation cere-monies from 13 cities in the north-east of Spain and investi-gated annual drought variability from CE 1650 to 1899. They found common periods with prolonged droughts (during the mid- and late 18th century) and extreme drought years (1691, 1753, 1775, 1798 and 1817) associated with more blocking situations.
In addition to information about rogation ceremonies, Domínguez-Castro et al. (2014a) analysed 11 Islamic chron-icles for Iberia, covering the period CE 711–1010 at high temporal and spatial resolution. They identified three severe droughts in 748–754 (drought reported each year), 812–823 (droughts with long famines) and 867–879 (droughts with references to famine). Fernández-Fernández et al. (2014) described available documentary evidence and qualitative weather records for Zafra, the capital of the Duchy of Feria in the south-western Iberian Peninsula, for the 1750–1840 period. Documentary data, particularly a quasi-weekly re-port of the weather in Zafra, were used for the reconstruction of a monthly rainfall index, which showed two dry periods, in 1796–1799 and 1816–1819 (Fernández-Fernández et al., 2015).
Rodrigo et al. (1999) used a number of documentary sources from southern Spain to create an ordinary rainfall index and describe monthly patterns since CE 1500 on a five-degree scale: −2: hydrological drought; −1: weather drought; 0: normal; 1: hard and/or constant rain; and 2: rain-induced flood. Results were calibrated with modern precip-itation data and other studies of historical climate. The dri-est periods in the pre-instrumental period were detected in the first half of the 16th century and around 1750. In several other papers reconstructing precipitation from documentary data in Spain (e.g. Rodrigo et al., 1995, 2012; Rodrigo and Barriendos, 2008), droughts were not directly reported.
For southern Portugal, Do Ó and Roxo (2008) used pub-lished and archival documentary evidence, supplemented by newspaper records, to analyse droughts from the 12th to the 18th centuries for the Algarve region (supplemented by data for the neighbouring region of inner lower Alentejo). The years 1385–1398 stand out as a long dry period, while the first halves of both the 16th and the 18th centuries were richer in reported multi-annual drought events. The 17th cen-tury was characterised by a low occurrence of drought re-ports. In the 19th century, covered mainly by newspapers (referring to long-term dry spells rather than long-lasting drought events), the 1873–1878 drought was identified as the longest documented event with hunger, increased crime,
sanitation/disease and other severe problems, culminating around 1875.
For Italy, Piervitali and Colacino (2001) reported 50 prayer processions for the relief of droughts, based on records from Erice in western Sicily relating to the 1565– 1915 period. These processions were at their most frequent during the 17th century (21 years, compared to only 8 years in the 19th century) and in April (28 years), followed by May and March (a total of 44 years in any spring month). Later, Diodato (2007) used documentary data for the River Sam-nium region (continental southern Italy) in the 1675–1868 period to develop a numerical index characterising the rain-fall regime and its evolution. Combining this with the precip-itation series of Benevento for 1869–2002, he reconstructed the series for the entire 1675–2002 period. The driest periods were detected in the 18th century and the wettest in the 19th century. In a follow-on paper, Diodato and Bellocchi (2011) investigated drought conditions in central-southern Italy for 1581–2007, based on documentary evidence. Their drought index (DI) was defined as value 1 for meteorological drought associated with agricultural drought at least in two places; otherwise DI=0. A drought year was defined as having at least three successive months with DI=1. A drought-weighted index sum was also calculated, taking the duration of the dry episode into account.
Telelis (2008) identified 183 droughts for the eastern Mediterranean and the Middle East using Byzantine docu-mentary sources for the period CE 300–1500. Taking into account decades with more than two dry events of extended duration, he reported a higher frequency of dry episodes in CE 360–390, 530–580, 690–720 and 1090–1200 for the tem-perate semi-arid regions; in CE 320–340, 390–420, 450–480, 510–560, 600–630, 740–770, 1040–1070, 1130–1200 and 1290–1320 for the desert region; and in CE 560–590, 740– 790, 1020–1050, 1070–1110 and 1140–1160 for the Mediter-ranean regions. Grove and Conterio (1995) used documen-tary data to analyse winter and spring droughts, severe win-ters, and summer rains during the period 1548–1648 on the island of Crete. They concluded that some of the winter droughts were longer-lasting and more extreme than those recorded in the instrumental period, as well as probably be-ing related to the extension of southerly air masses from the Sahara. Based on different documentary proxy evidence, Xo-plaki et al. (2001) found a higher number of droughts for the Maunder Minimum period and early 19th century across the southern Balkans and Greece.
Figure 6.Annual dryness-wetness indices in China in CE 1484: 1 – very wet; 2 – wet; 3 – normal; 4 – dry; 5 – very dry (adapted after the Academy of Chinese Meteorological Science, 1981).
4.1.2 Asia
In Asia, China provides the most reports of documentary-based droughts. More than 2200 local chronicles and many other historical writings in China, divided into 120 regions, have been used to create annual maps of dryness-wetness indices for the period CE 1470–1979 (Academy of Chinese Meteorological Science, 1981; for types of Chinese histori-cal documents and climate information see Ge et al., 2008). An example of such a map, for CE 1484, appears in Fig. 6. A five-degree scale was used for classification: 1: very wet; 2: wet; 3: normal; 4: dry; and 5: very dry. The reported dryness-wetness indices were subsequently extended to 1992 by Zhang and Liu (1993) and to 2000 by Zhang et al. (2003), and have been further used as a basic comparative dataset in many Chinese studies, usually analysing floods and droughts together. In the following description of drought analyses in China, we follow Ge et al. (2016) by dividing the Chinese territory into three climatic zones: (i) a monsoonal climate in the east, (ii) a continental arid climate in the north-west and (iii) a highland cold climate on the Qinghai–Tibet Plateau.
Song (2000), through a statistical analysis of the above dry/wet evidence, reported dry conditions during the grow-ing season from 125 sites in north-eastern China in the 16th and 17th centuries, and prevailing dryness in most areas of China during the 20th century. Qian et al. (2003) used the above data, extended to 1999, to interpret the spatio-temporal
detected 20- and 30-year drought cycles in the periods 1480– 1670 and 1825–1940, and∼60-year cycles in the 16th and 17th centuries.
Many Chinese studies have analysed historical droughts and floods together. For example, Chen et al. (2001) as-sessed the spatial distribution of the 10 greatest drought and flood years in China during the previous millennium, pre-senting descriptions and maps related to each catastrophic year, including the great droughts in 1321 and 1835. Jiang et al. (2005) analysed floods and droughts in the middle Yangtze River and the Yangtze River delta using the fre-quency of floods and droughts for CE 1000–1950 recorded in collected historical documents, as well as discharges with precipitation totals for later periods. A positive trend in drought frequency was found from CE 1400 to the present. Yin et al. (2005), applying a database from local administra-tive documentation covering 2300 years, analysed drought hazards along the Wei River, a major tributary of the Yellow River. Two periods between CE 610 and 850 and from 1580 to 2000 (1810–1940 in particular) emerged as major, long-lasting episodes during which droughts and other hydrologi-cal hazards were prevalent. Shen et al. (2007) used Chinese drought/flood proxy data for the past 500 years to study ex-ceptional drought events over eastern China (east of 105◦E). They identified three such events in 1586–1589, 1638–1641 and 1965–1966. Drought occurred over more than 40 % of the affected area, with a significant summer rainfall reduc-tion of ∼50 % or more in the core areas. Yi et al. (2012) combined a documentary-based drought–flood index and tree ring data for the larger part of north-central China and distin-guished between droughts related to the combination of rain-less and intensely hot patterns (CE 1484, 1585–1587, 1689– 1691, 1784–1786 and 1876–1878), rainless summers driven by low precipitation and/or high temperatures (1560–1561, 1599–1601, 1609, 1615–1617, 1638–1641 and 1899–1901), and torrid summers driven by low precipitation and ex-ceedingly high temperatures (1527–1529, 1720–1722, 1813– 1814, 1856–1857 and 1926–1930). More recently, Wan et al. (2018) analysed drought and flood data derived from doc-umentary sources for the Baoji area (western Guanzhong re-gion) in the period 1368–1911. Droughts occurred 191 times and there were 106 flood events. Relatively dry patterns were recognised between 1368 and 1644, followed by a phase of droughts and floods to 1804 and comparatively wet patterns thereafter.
Zheng et al. (2006) used Chinese historical documents and instrumental measurements for the statistical reconstruction of a proxy precipitation index dataset for the period CE 501– 2000 over eastern China (ca. 25–40◦N, east of 105◦E). For the whole of eastern China they disclosed long-term dry pe-riods in the 530s–570s, 640s–700s, 750s–800s, 840s–870s, 1000s–1230s, 1340s–1360s, 1430s–1570s, 1620s–1640s and 1920s–1930s, and from the 1980s. The most severe drought occurred in 1634–1644, particularly on the North China Plain (ca. 34–40◦N) and in the Jiang-Huai area (ca. 31–
34◦N), also extending to Jiang-Nan (ca. 25–31◦N). Zheng et al. (2018) used the Yu-Xue-Fen-Cun historical archive, con-taining quantitative records of the depth of infiltration into the soil after each rainfall event, or the depth of each snow-fall, combined with instrumental data for the reconstruc-tion of seasonal precipitareconstruc-tion at 17 sites in northern China, for 1736–2000. They identified 29 extreme droughts, with higher drought frequencies during the 1770s–1780s, 1870s, 1900s–1920s, 1940s and 1980s–1990s. A higher probability of drought occurrence was related to El Niño during the year in question or the previous year.
Ge et al. (2016) reviewed advances in high-resolution tem-perature and precipitation reconstructions over China for the past 2000 years. For eastern China, they reported more fre-quent extreme droughts in the periods CE 301–400, 751–800, 1051–1150, 1501–1550 and 1601–1650. Extreme droughts and floods occurred together most frequently between 1551 and 1600. For the area between the north-eastern Qinghai– Tibet Plateau and the western margins of the Qin Mountains, they mentioned several multi-decadal, severe droughts dur-ing the past millennium, in particular durdur-ing the 1480s and 1710s. The arid and semi-arid zones of north-western China were relatively dry between 1000 and 1350.
Because of the long tradition of writing systematic of-ficial and local chronicles in the Chinese dynasties (since ∼200 BCE), a team of researchers led by Zhang De’er com-piled all meteorological as well as weather- and climate-related records (harvest, famine, flood, drought etc.) from 7930 historical documents into a compendium of Chinese meteorological records for the past 3000 years (Zhang, 2013; first edition: 2004). The recently created REACHES database (Wang et al., 2018) may offer a significant new dataset for further climatological analyses (including drought), facilitat-ing the use of computfacilitat-ing technology for climate (drought) reconstructions in China.
Only a few other papers related to documentary-based droughts in Asia appertain to countries other than China. For example, Grotzfeld (1991) evaluated Arabic chronicles from the Near East between CE 800 and 1900 and presented (graphically and with great time gaps) decadal frequencies of dry winter half-years for the regions of Iraq, Syria-Palestine and Egypt. A remarkable drought series for the period 1777– 2008 is available for Korea, where Kim et al. (2011) used daily rainfall totals measured at Seoul with the traditional chukwookeeKorean rain gauge between 1777 and 1907, sup-plemented by instrumental measurements from other sta-tions. Using the Effective Drought Index (EDI), they iden-tified 114 drought episodes from CE 1788 onwards, with the most extreme of them in 1899–1903.
4.1.3 Africa
al., 2012a). The continent does, however, have rich writ-ten records, particularly from the late 18th century onwards, due to the activities of explorers, traders, settlers, mission-aries, and (later) (mainly European) colonial government officials. Some sources provide extensive evidence for the spatio-temporal distribution and societal impacts of histori-cal droughts at inter-annual to multi-decadal shistori-cales. While, strictly speaking, an indicator of rainfall over the Nile catch-ment areas in Ethiopia (Blue Nile) and equatorial Africa (White Nile), nilometer records from Cairo (stone structures at which levels of the Nile River were recorded with respect to a vertical column, a series of steps leading down to the river or a deep well with culvert; see Popper, 1951) also pro-vide a near-annually resolved drought chronology for north-eastern Africa dating back to the 7th century.
Drought chronologies derived from documentary sources exist at a variety of spatial scales from the regional to the continental. Arguably the most important studies for the con-tinent as a whole are those of Sharon Nicholson. Her pioneer-ing work since the late 1970s has involved the compilation of historical accounts of drier and wetter conditions from across the continent, mainly from published late-18th- and 19th-century sources. Her basic methodology is described in Nicholson (1979, 1981a, 1996), with early sketches of the spatial extent of periods of unusual rainfall in Nichol-son (1978, 1980). Other works detail historical fluctuations of lakes, mainly in eastern Africa (e.g. Nicholson, 1981b, 1998a, 1998b, 1999; Nicholson and Yin, 2001). The raw his-torical citations used in these studies have been combined into a database (see Nicholson, 2001b) and made accessi-ble, alongside early-19th-century rainfall data, via the World Data Service for Paleoclimatology in Boulder, Colorado (https://www.ncdc.noaa.gov/paleo/study/12201, last access: 27 August 2018; Nicholson et al., 2012a).
The most recent publications by Nicholson et al. (2012a, b) and Nicholson (2014) have analysed combined documentary and gauge evidence to generate a seven-class index (from −3 to 3) time series of rainfall variability for 90 homogenous rainfall regions across mainland Africa for the period after 1800. These studies rely on the premise that information pertaining to any location within a zone may be considered to represent wider conditions across that zone at that time. Statistical inference is also used to extend rainfall conditions from zones with available documentary or gauge data to adjacent zones that show high interzonal correlation (see Nicholson et al., 2012b). With the exception of northern Algeria and parts of eastern Africa, these studies reveal extensive aridity during the first 3 decades of the 19th century. Given the occurrence of widespread drought conditions during the 1790s (Nicholson, 1996, 2001a), this arid interval probably commenced around 1790. Most of the rainfall zones also show a general tendency towards higher rainfall throughout the early and mid-20th century, and later. Other drought chronologies for Africa are either regional or sub-continental in scale. Despite some breaks, the longest
available indirect record of drought for Africa is the Nile flood series (see Toussoun, 1925; Ghaleb, 1951; Popper, 1951; Hurst, 1952; Hassan, 1981, 2007b; Kondrashov et al., 2005). Analyses of calibrated Nile minimum flood levels re-veal that discharge during the Medieval Climate Anomaly (MCA) was not constant. Instead, this period was charac-terised by episodes of considerably low flood levels from 930 to 1070 and from 1180 to 1350 (Hassan, 2007b), re-flecting drier conditions over the catchment. The start of the MCA was particularly marked by a dramatic increase in the frequency of extreme low floods (Hassan, 2011). Peri-ods of low flood discharge are also identifiable in nilometer records from 1470 to ca. 1500 and from 1725 to 1800 (Has-san, 2007b).
For western Africa, Norrgård (2015) analysed various British documents from locations along the Guinea coast of present-day Ghana, to establish drier and wetter periods from 1750 to 1800. These were compared against analyses of oral traditions and Arabic chronicles from the Sahel (e.g. Cis-soko, 1968; Curtin, 1975; Nicholson, 1978). In the Guinea coastal interior, drier phases occurred between the 1740s and mid-1750s, between the mid-1760s and early 1780s (with several famines and shortages of corn), and finally in the 1790s, again with famines and corn shortages. The last two dry periods also affected the Sahel area, while the coastal dry zone experienced severe drought in 1777–1787.
Regional rainfall chronologies are at their most concen-trated for the southern African summer rainfall zone. Most of these chronologies are based solely upon written sources and, in contrast to Nicholson, utilise gauge data only for val-idation and/or calibration. They also use a five-point scale (−2 to+2) to classify rainfall and have employed a relatively non-standard methodology for the classification of drier and wetter seasons (Nash, 2017). In the majority of studies, the average rainfall conditions for a specific season in a region are determined via qualitative analysis of the collective docu-mentary evidence for that season. This contrasts with Nichol-son’s approach, which attributes a relative numerical score (−3 to 3) to individual quotations according to how wet or dry conditions appear to have been; overall conditions dur-ing a season are then determined by averagdur-ing these scores. The discrepancies introduced by such different approaches are considered below.
Nash and Endfield (2002a, b) and Endfield and Nash (2002) applied Vogel’s methodology to analysis of cor-respondence, reports and personal papers from British mis-sion stations and other sites in order to reconstruct climatic variability and river flows in the Kalahari Desert of Botswana and northern South Africa from 1815 to 1900. They de-tected major dry periods in 1820–1827, 1831–1835, 1844– 1851, 1857–1865, 1877–1886 and 1894–1899, of which the droughts of 1844–1851, 1857–1865, 1884–1886 and 1894– 1899 were the most widespread. A causal relationship to El Niño events was also suggested. This was further explored by Nash and Endfield (2008). Using maps of historical rain-fall variability and time sequences of documentary evidence, they established that the relationship between ENSO (El Niño–Southern Oscillation) and rainfall variability identified for the 20th century, whereby ENSO warm events are often preceded by wetter conditions and succeeded by drought, has held for much of the last 170 years.
Using analyses of missionary journals, letters, traveller’s writings and governmental reports, Kelso and Vogel (2007) identified major droughts in 1820–1821, 1825–1827, 1834– 1836, 1855–1858, 1860–1862, 1865–1868, 1874–1875, 1880–1883 and 1893–1896 in semi-arid Namaqualand in north-western South Africa. They also suggested that some of these droughts were linked to ENSO episodes. A signifi-cant methodological advance in this study was the inclusion of “confidence ratings” for annual classifications, based on the number and/or quality of historical sources; this approach has been adopted in subsequent reconstructions.
In Lesotho, Nash and Grab (2010) used letters, jour-nals and reports written by British and French missionar-ies and colonial authoritmissionar-ies to classify rainfall levels from 1824–1900. They detected drought episodes in 1833–1834, 1841–1842, 1845–1847, 1848–1851, 1858–1863, 1865– 1869, 1876–1880, 1882–1885 and 1895–1899, with the most severe droughts in 1850–1851 and 1862–1863. Seven of the reported multi-annual droughts coincided with periods of low ENSO values, and a tentative connection with Indian Ocean sea surface temperature (SST) variations was sug-gested. Significantly, this was the first study in the region to draw upon indigenous written sources, in the form of the Lesotho-language newspaperLeselinyana la Lesotho.
Nash et al. (2016b) analysed 19th-century rainfall variabil-ity in the adjacent region of KwaZulu-Natal, South Africa, using English-, German- and Norwegian-language newspa-pers, colonial records and missionary materials. They iden-tified eight multi-year droughts between 1836 and 1900 in the rainy seasons of 1836–1838, 1861–1863, 1865–1866, 1868–1870, 1876–1879, 1883–1885, 1886–1890 and 1895– 1900. Grab and Zumthurm (2018) used various documen-tary sources to construct a hydroclimatic history of central Namibia from 1845 to 1900. Using a similar approach to Nash and Endfield (2002a), they identified a slightly higher proportion of wetter years (42 %) than dry (38 %). In total, 19 dry rainfall seasons occurred; the most severe drought, which
included four consecutive “very dry” seasons, was recorded in 1865–1869.
Using historical documentary materials from British and African archives, Nash et al. (2018) reconstructed rainfall variability in Malawi for the latter part of the 19th cen-tury. They identified widespread and severe droughts dur-ing the rainy seasons of 1861–1863, 1877–1879, 1885–1888 and 1892–1894. The El Niño event of 1877 was particu-larly strong, and was associated with drought from northern Malawi to the eastern Cape, while drier conditions during a strong El Niño in 1855 extended from Malawi as far as the southern Kalahari. The authors compared their reconstruc-tion with results for the equivalent rainfall zones in Nichol-son et al. (2012b). The extreme droughts of the early 1860s, mid- to late 1870s and mid- to late 1880s are visible in both reconstructions. However, discrepancies were identified in other decades, with the Nicholson et al. (2012b) series ap-pearing to overestimate drier conditions, at least for parts of southern Africa.
Hannaford et al. (2015) were the first authors to use data from digitised ships’ logbooks to reconstruct precipitation in southern Africa, focussing their analysis upon four weather stations in the eastern Cape and KwaZulu-Natal for the pe-riod 1796–1854. The reconstructions show a degree of corre-spondence with the regional drought series described above. For example, the mid-1820s to mid-1830s was the driest of the period at Mthatha (eastern Cape) and Royal National Park (KwaZulu-Natal). At Cape Town, drier conditions were observed in the 1830s to the early 1840s. However, there are discrepancies between the authors’ results and those for equivalent zones in the Nicholson et al. (2012b) synthesis. Nicholson et al. (2012b), for example, indicate protracted drought for 1800–1811 in “South Central Africa”, while Hannaford et al. (2015) and a tree ring series for Zimbabwe (Therrell et al., 2006) identify above-mean rainfall alternat-ing with drought duralternat-ing this period.
Using a more qualitative approach, Hannaford and Nash (2016) have analysed fragmentary Portuguese ac-counts of climate-related phenomena in south-eastern Africa between ∼1500 and 1830. They identified five clus-ters of widespread, severe and protracted drought events. The period 1506–1518 saw drought and food shortages along the Mozambique coast, and 1730–1768 saw drought, locust plagues and famine along the Zambezi valley. Droughts throughout south-eastern Africa, with associated food scarcity and famine, were identified in 1560–1590, 1795–1805 and 1824–1830, independently corroborating many of the drought chronologies noted above.
4.1.4 The Americas and Australia
they compiled a series of 70 droughts. Periods of severe drought centred around the years 1483, 1533, 1571, 1601, 1650, 1691, 1730, 1783, 1818 and 1860. In a subsequent pa-per, Mendoza et al. (2006), analysing largely those droughts affecting agriculture in south-eastern Mexico, reported the highest drought frequency around 1650, 1782 and 1884, while no drought reports are known from ca. 1540, 1630– 1640, 1672–1714 and 1740–1760. Clearly more droughts oc-curred between 1760 and 1899 than between 1550 and 1760. The droughts, usually lasting 1 or 2 years, appeared in var-ious cycles. Mendoza et al. (2007) used documentary evi-dence to study the frequency and duration of droughts in the Mexican Maya lands on the Yucatan Peninsula for the period 1501–1900. Severe droughts were detected only for 1648– 1661, 1725–1727, 1765–1773 and particularly 1800–1850. They usually lasted for 1 year at a quasi-decadal frequency.
In the USA, Dupigny-Giroux (2009) used daily journal entries covering the 1680–1900 period in the New Eng-land states of Vermont and New Hampshire to investigate droughts (among other climatic matters). She developed a qualitative drought index with categories from S1 (“flash” droughts of 1–2 months’ duration) to S5 (multi-year, severe droughts). The region was especially drought-prone in the late 1700s, with a shift to a wetter climate around 1850. Multi-year, severe droughts (S4, S5) were particularly evi-dent in 1762, 1794, 1849 and 1864.
Guevara-Murua et al. (2018) derived information from Catholic rogation ceremonies, together with flooding events and crop shortages recorded in the minutes of meetings of the city and municipal councils in Antigua Guatemala and Guatemala City on the Pacific coast of Central Amer-ica in the 1640–1945 period. Classifying patterns of rainy seasons from May to October on a five-point scale, from very wet to very dry, they detected 34 years of drier con-ditions and 21 years of very dry concon-ditions. Drier peri-ods occurred between the 1640s and the 1740s (related to the southward displacement of the Intertropical Con-vergence Zone), in the 1820s and the 1840s. Berland et al. (2013) used over 13 250 items of documentation (mis-sionary, plantation and government papers, as well as con-temporary scholarly publications) from Antigua (Lesser An-tilles) to create a five-degree classification (very wet, wet, normal, dry, very dry) of precipitation patterns, subsequently applied in the reconstruction of rainfall variability in the pe-riod 1770–1890. Significant dry phases were identified in the rain years 1775–1780, 1788–1791, 1820–1822, 1834–1837, 1844–1845, 1859–1860, 1862–1864, 1870–1874 and 1881– 1882.
In South America, Prieto et al. (2000) used documentary data from Bolivia and Argentina from the 17th and 18th centuries to provide new information relevant to the great droughts in the Andes between 1780 and 1810, identify-ing that heavy rains and extreme floods occurred frequently in the Río de la Plata basin. Prieto and Rojas (2015) re-constructed a series of droughts and high water flows on
the Bermejo River (Argentina) during the 17th–20th cen-turies on the basis of a content analysis of documentary evidence, calibrated against instrumental data. They identi-fied a significant decrease in extreme droughts that began in 1890. Longer dry periods were identified between the 1680s and 1710, while episodic droughts occurred in the 1720s, 1760s, 1780s, 1790s, 1870s, 1890s and 2000s. These re-sults correlated well with fluctuations of the Mendoza River. Domínguez-Castro et al. (2018) studied wet and dry ex-tremes in Quito (Ecuador) using rogation ceremonies in the Chapter Acts of Quito (1600–1822) and instrumental rainfall series (1891–2015) for which SPI had been calculated. Ro-gations proved a sound proxy for droughts and extremely wet conditions during January–March and wet conditions during June–August. The most important drought periods occurred in 1692–1701 (the most severe drought), 1718–1723, 1976– 1980, 1990–1993 and 2001–2006. The frequency and dura-tion of droughts appeared to intensify, particularly from the mid-20th century.
In Australia, Nicholls (1988) used early documentary records (mainly letters) from the British colony of New South Wales to identify droughts in the 1788–1841 period. Only three droughts (1796–1797, 1798–1799 and 1810–1811) were not associated with ENSO events, compared with a fur-ther eight droughts detected (1790–1791, 1803–1804, 1813– 1815, 1817–1818, 1819–1820, 1823–1824, 1826–1829 and 1837–1839). Later, Fenby and Gergis (2013) used 12 sec-ondary documentary sources, starting with the first Euro-pean settlement in Australia in 1788 and continuing through widespread meteorological observations from 1860 onwards, to create 12 documentary-based rainfall chronologies for south-eastern Australia. They identified 27 drought years in the whole period. The longest and most widespread event, influencing all subregions, occurred in 1837–1841, but peri-ods of considerable drought were also detected in some parts of south-eastern Australia between (1825–)1826 and 1830, as well as in 1809–1812 and 1813–1816. The results of this paper were used by Gergis and Ashcroft (2012) to create an extended rainfall index for eastern New South Wales for 1788–2008, in which they identified 81 dry years (Fig. 7). Ashcroft et al. (2014) analysed early meteorological obser-vations from 39 archival sources in south-eastern Australia for the 1788–1859 period. Establishing regional means, they identified prolonged dry conditions in various parts of the re-gion during 1837–1843 and 1845–1852.
4.2 Individual and major drought events