Research Article
Dry matter partitioning and grain yield
of wheat as affected by sources, methods
and timing of nitrogen application
Muhammad Bakhtiar
1*, Muhammad Zahir Afridi
1, Fazal Munsif
1,
Inayat Ur Rahman Arshad
2, Sohail Rehman
1, Saliman Khan
3,
Muhammad Adil
1, Muhammad Rabnawaz Khan
1, Muhammad Noman
Khan
4and Muhammad Farooq
51. Department of Agronomy, the University of Agriculture, Peshawar-Pakistan
2. Department of Soil and Environmental Sciences, the University of Agriculture, Peshawar-Pakistan 3. Center of Biotechnology and Microbiology, University of Peshawar-Pakistan
4. Department of Horticulture, the University of Agriculture, Peshawar-Pakistan 5. IFST, Sindh Agriculture University, Tando Jam-Pakistan
*Corresponding author’s email: [email protected]
Muhammad Bakhtiar, Muhammad Zahir Afridi, Fazal Munsif, Inayat Ur Rahman Arshad, Sohail Rehman, Saliman Khan, Muhammad Adil, Muhammad Rabnawaz Khan, Muhammad Noman Khan, Muhammad Farooq. Dry matter partitioning and grain yield of wheat as affected by sources, methods and timing of nitrogen
application. Pure and Applied Biology.Vol. 6, Issue 4, pp1198-1215.
http://dx.doi.org/10.19045/bspab.2017.600128
Received: 02/04/2017 Revised: 27/08/2017 Accepted: 06/09/2017 Online First: 21/09/2017
Abstract
The aim of this research was to evaluate source, methods and timing of nitrogen application for dry matter partitioning and productivity in wheat. The experiment was conducted in randomized complete block design at Agronomic Research Farm of the University of Agriculture, Peshawar Khyber Pukhtunkhwa during fall 2015. Wheat variety Atta Habib was used as a test crop, and was seeded @ 100 kg ha-1 during 2nd week of November. Urea was applied as a source of mineral nitrogen @ 90 kg
ha-1 as full and split doses with different growth stages i.e at sowing, at tillering and at booting, while
farmyard manure, poultry manure and legume residue @ of 5 t ha-1 were used as sources of organic
nitrogen. Sources, methods and timing of nitrogen application had significantly influenced dry matter partitioning at pre-anthesis stage, at physiological maturity and final yield. In case of sources of nitrogen higher dry matter partitioning at pre-anthesis stage to leaf (134.31 g m-2), stem (540.91 g m-2), spike
(156.12 g m-2), and at maturity stage to leaf (103.54 g m-2), stem (605.24 g m-2), spike (948.32 g m-2)
and grain yield (3997 kg ha-1) was recorded for poultry manure incorporated plots, Whereas legume
residue performed poor in all measured parameters. In case of timing and methods of nitrogen application dry matter partitioning at pre- anthesis to leaf (147.50 g m-2), stem (613 g m-2), spike (170.70
g m-2), and at maturity to leaf (109.52 g m-2), stem (676.23 g m-2) and to spike (983.85 g m-2) and grain
yield (4419 kg ha-1) were higher when nitrogen was applied half at tillering and half boot stage. It was
concluded that integrated use of poultry manure (5 t ha-1) as source of nitrogen along with 90 kg ha-1 as
a mineral nitrogen in 2 splits half at tillering and half at boot stage had accelerated dry matter partitioning at both stages i.e pre-anthesis and physiological maturity toward the final grain yield under agro-ecological condition of Peshawar, Pakistan.
Keywords: Nitrogen sources; Timing; Methods; Dry matter partitioning; Grain yield Introduction
Wheat (Triticum aestivum L.) is an annual cereal crop and is the primary source of food for human beings and also could be uses as a
in boosting Pakistan economy. The national production of wheat in our country is quite low than progressed countries of the world like Mexico and China. This low yield of wheat in Pakistan mainly due to because of our farmers is un-aware to use good source of nitrogen with suitable method and at proper time [3].
Nitrogen is most important component of chlorophyll and its absence in soil effect the availability of phosphorus, potash and other nutrients to plant [4]. Nitrogen application at proper time decrease the loss of nitrogen
and its best application methods
(split applications) not only increasing wheat yield but also enhancing fertilizers use efficiency [5]. Among all the plant nutrients, nitrogen is the most important element for enhancing plant canopy volume and increasing grain yield [6]. Application of nitrogen fertilizers plays an important role in intensive cropping system [7]. Nitrogen makes cereal crops more nutritive by stimulating protein contents in grains and deficient nitrogen results in yellowing (chlorosis), reduce tillering, and disturbing normal growth and cell division [8].
Organic manures are the chief source of nitrogen and many other necessary plant nutrients [9]. The most important organic sources of nitrogen are PM, FYM and crop residues which are mostly used in organic farming [10]. The re-use of organic materials as bio fertilizers in farming system is not only useful for human health and soil, but it also reduce pollutants and generate more net income [11]. Organic manures contain both macro and micro plant nutrients and also make soil more favourable for plant production [12]. Organic manure incorporation into soil enhancing the water holding potential of soil, cation exchange capacity of the soil and allow the plant roots to have better access to available nutrients [13]. [14] Narrated that use of organic manures in cropping system is better for soil health and obtaining higher production on sustainable basis. Application of organic manures enhancing soil porosity, infiltration rate,
total C, reducing bulk density, check soil erosion and lead to increasing availability of plant nutrients through mineralization [15]. Proper method, balance rate, and time of inorganic fertilizers application along with organic manures is not only decreasing nitrification rate, but also play a key role in increasing crop productivity by increasing nitrogen use efficiency. Time of fertilizer application can influence the nitrogen utilization efficiency by crop plants [16]. Nitrogen applied in 2-3 doses had no sizeable outcome in yield but crucial effect on decreasing lodging [17]. [18] Stated that the optimum application of nitrogen fertilizers at appropriate methods is a key to achieve potential yield. The farmers of our country are unable to use the recommended doses of fertilizers due high cost of fertilizer, so this difficulty can be discarded by using effective fertilizer application methods and managing its application time.
Keeping in view the above facts and figures, the experiment was designed to find out the effect of organic sources of nitrogen and fertilizer nitrogen application methods/time at various growth stages on productivity of wheat under the agro-ecological condition of Peshawar.
Materials and methods
To find out the effect of integrated use of nitrogen from organic sources (farmyard manure, poultry manure and legume residue and mineral nitrogen application methods / time on the production of wheat, a research plan was projected at agronomic
research farm, the University of
ha-1 were incorporated into the soil at before sowing. While FN in form of urea @ 90 kg ha-1 was applied at single and split doses, at various growth stages i.e sowing (S1), tillering (S2) and booting stages (S2). Farmyard manure, poultry manure and legumes residue were obtained from dairy farm and poultry farm of The University of Agricultural Peshawar. The recommended dose of P (90 kg ha-1) and K (60 kg ha-1) was also applied at the time of sowing. The field was irrigated and when it came to suitable moisture state, it was ploughed 3 times with cultivator and sown with the help of seed drill. The field was irrigated after 20 days when the germination was completed. All cultural practices were performed same for all the experimental units.
Data about dry matter partitioning at pre anthesis and maturity stage was recorded by cutting the plant from 0.5 m border row of each plot at ground level. Plant was cut into culms, spikes and leaves and then it was oven dried at 70 oC to constant weight for dry weight determination. Data about grain yield was recorded in 4 central rows in each plot was harvested and threshed separately for calculating grain yield and was converted to kg ha-1.
Statistical analysis
This research plan was planned in a RCB design with four replications and 18 treatment combinations and keeping 1 check plot per replication. The data was analyzed statistically according to the RCB factorial design. LSD test was used for significance at 0.05 levels of probability [19]. Special planned mean comparisons were also made to make the tables more explanatory.
Results
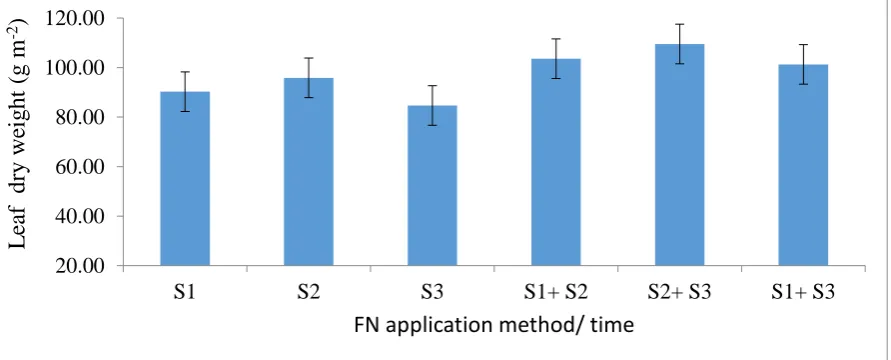
Leaf dry weight (g m-2) at pre anthesis
Data associated to leaf dry weight showed that N application methods (Figure 1) and organic sources (Figure 2) had significant effect on leaf dry weight. The interaction between sources and N application methods was also found significant (Figure 3). The planned mean comparisons for leaf dry weight among control vs rest, full vs split,
full S2 vs full S3, S2+S3 vsS1+S3 were significant, whereas all other mean comparisons were not significant (Figure 4). The higher leaf dry weight was recorded in poultry manure incorporated plots followed by farmyard manure which was statistically similar to poultry manure incorporated plots, whereas legume residue had the lowest leaf dry weight at pre anthesis. Leaf dry weight at pre anthesis was higher when FN was applied in split doses ½ tillering + ½ boot stage, whereas full dose of N at boot stage had the least leaf dry weight at pre anthesis. Maximum leaf dry weight was found for the rest of the treatments as compared to control. Split application had higher leaf dry weight than
full application however nitrogen
application as full dose at tillering had greater leaf dry weight than at boot stage. Leaf dry weight was higher in N applied plots at tillering and booting than sowing and booting stages. Leaf dry weight at pre-anthesis were significantly affected by OS (Organic sources) x FN (Fertilizer nitrogen). The application of N as full dose upto tillering increased Leaf dry weight along with all organic manures. The decrease in Leaf dry weight was more for all organic manure when fertilizer N was applied as full dose at booting. Regarding split application of N the Leaf dry weight for FYM and PM increases significantly from sowing and tillering to tillering and booting and then decreased at sowing and booting. While in case of LR Leaf dry weight seems to be less affected, but decreasing at sowing and booting.
Stem dry weight (g m-2) at pre anthesis
(Figure 8). The maximum stem dry weight of stem was recorded in poultry manure incorporated plots followed by Farm yard manure but it was statistically similar to poultry manure incorporated plots, whereas legume residue had lesser stem dry weight. In case of fertilizer N application, higher stem dry was recorded when N was applied in split doses at tillering and boot stage, where plot receiving full N at boot stage resulted minimum stem dry weight. Stem dry weight was higher for the rest of the treatments as compared to control plots. Split application resulted greater stem dry weight as compared to full application. Full dose of N application at tillering had greater stem dry weight than at booting stage. Application of
N in splits half each at tillering and booting had higher stem dry weight as compared to plots where half of N was applied both at sowing and booting stages. Stem dry weight at pre anthesis were significantly affected by OS x FN. The application of N as full dose upto tillering increased stem dry weight along with all organic manures. The decrease in stem dry weight was more for all organic manure when fertilizer N was applied as full dose was applied at booting. Regarding split application of N the stem dry weight for FYM and PM increases significantly at tillering and booting and then decreased at sowing and booting. While in case of LR stem dry weight seems to be comparatively less affected, but decrease was more at sowing and booting.
Figure 1. Leaf dry weight (g m-2) at pre anthesis stage as affected by FN application
(methods/time). Vertical bars represent standard errors of means within each comparison
50.00 70.00 90.00 110.00 130.00 150.00
S1 S2 S3 S1+ S2 S2+ S3 S1+ S3
L
ea
f
dry
we
ig
ht
(g
m
-2)
FN application method/time
50.00 60.00 70.00 80.00 90.00 100.00 110.00 120.00 130.00 140.00 150.00
FYM PM LR
L
ea
f
dry
wig
ht
(g
m
-2)
Organic sources for N
Figure 2. Leaf dry weight (g m-2) at pre anthesis stage as affected by organic sources for
Figure 3. Interaction between OS x FN for leaf dry weight (g m-2) at pre anthesis
application (methods/ time). Vertical bars represent standard errors of means within each comparison
Figure 4. Planned mean comparison for leaf dry weight (g m-2) as affected by FN
Figure 5. Stem dry weight (g m-2) at pre anthesis stage as affected by FN application
(methods/time). Vertical bars represent standard errors of means within each comparison
C
o
n
tr
o
l
Fu
ll
Fu
ll
S1
Fu
ll
S2
S1
+S2
S2
+S3
R
est
Sp
lit
Oth
er
Fu
ll
Fu
ll
S3
Oth
er
Sp
lit
S1
+S3
50.00 70.00 90.00 110.00 130.00 150.00
C1 C2 C3 C4 C5 C6
L
ea
f
dry
we
ig
ht(
g
m
-2)
Planned means comaprison
100.00 200.00 300.00 400.00 500.00 600.00
S1 S2 S3 S1+ S2 S2+ S3 S1+ S3
S
tem dr
y
we
ig
ht
(g
m
-2)
Figure 6. Stem dry weight (g m-2) at pre anthesis stage as affected by organic sources for
N. Vertical bars represent standard errors of means within each comparison
Figure 7. Interaction between OS x FN for stem dry weight (g m-2) at pre-anthesis
Figure 8. Planned mean comparison for stem weight (g m-2) at pre-anthesis stage as
affected by FN application (methods/ time). Vertical bars represent standard errors of means within each comparison
200.00 250.00 300.00 350.00 400.00 450.00 500.00 550.00 600.00
FYM PM LR
S
tem dr
y
wig
ht
(g
m
-2)
Organic sources for N
C
ontrol
F
ull
F
ull
S
1
F
ull
S
2
S
1+
S
2
S
2+
S
3
R
est
S
pli
t
Othe
r
F
ull
F
ull
S
3
Othe
r
S
pli
t
S
1+
S
3
100.00 200.00 300.00 400.00 500.00 600.00
C1 C2 C3 C4 C5 C6
S
tem dr
y
we
ig
ht
(g
m
-2 )
Planned mean comaprison
Figure 8. Planned mean comparison for stem weight (g m-2) at pre-anthesis stage as
Spike dry weight (g m-2) at pre anthesis
Data on the subject of spike dry are given was statistically analyzed. Mean values the data indicated that fertilizer N application (Figure 9) and organic sources (Figure 10) had significant effect on spike dry weight, whereas their interaction was also
significant (Figure 11).The planned mean comparisons for spike dry weight among control vs rest, full vs split, full S2 vs full S3, S2+S3 vs S1+S3 were significant, whereas all other mean comparisons were not significant (Figure 12).
Figure 9. Spike dry weight (g m-2) at pre anthesis stage as affected by FN application
(methods/time). Vertical bars represent standard errors of means within each comparison
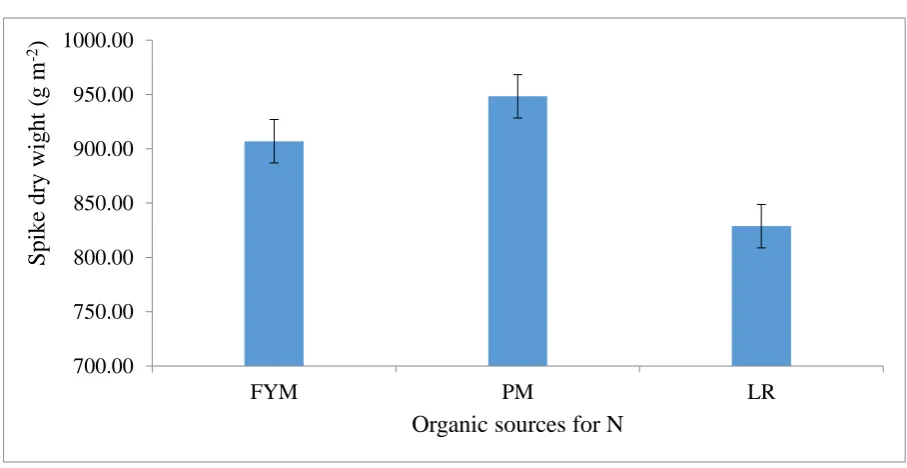
Figure 10. Spike dry weight (g m-2) at pre anthesis stage as affected by organic sources
for N. Vertical bars represent standard errors of means within each comparison
The maximum spike dry weight was recorded in poultry manure incorporated plots followed by farmyard manure, but it was not different from poultry manure plots whereas legume residue resulted in minimum spike dry weight. In case fertilizer N application, higher spike dry weight was recorded when N was applied in split doses at tillering and boot stage
followed by plots receiving N in split doses at sowing and tillering but it was statistically similar to spike dry weight of the plots receiving N in split form at sowing and boot stages whereas plot receiving full N at boot stage resulted in minimum spike dry weight. Maximum spike dry weight was found for the rest of the treatments as compared to control. Split application had
50.00 70.00 90.00 110.00 130.00 150.00 170.00
S1 S2 S3 S1+ S2 S2+ S3 S1+ S3
S
pike dr
y
we
ig
ht
(g
m
-2 )
FN application method/time
50.00 70.00 90.00 110.00 130.00 150.00 170.00
FYM PM LR
S
pike dr
y
wig
ht
(g
m
-2)
produce maximum spike dry weight than
full application however nitrogen
application as full dose at tillering had maximum spike dry weight compared to booting stage. Maximum spike dry weight was recorded in plots where N was applied at tillering and booting than sowing and booting stages. Interaction between organic sources and fertilizers N were significant for spike dry weight. The application of N as full dose upto tillering increased spike dry weight along with LR and FYM, while for PM spike dry weight seems to be less
affected The decrease in spike dry weight was more for all organic manure when fertilizer N was applied as full dose was applied at booting. Regarding split application of N the spike dry weight for FYM and PM increases significantly at tillering and booting and then decreased at sowing and booting. While in case of LR spike dry weight seems to be comparatively less affected increased at tillering and booting, and decreased at sowing and booting.
Figure 11. Interaction between OS x FN for spike dry weight (g m-2) at pre-anthesis
Figure 12. Planned mean comparison for spike weight (g m-2) at pre-anthesis stage as
affected by FN application (methods/ time). Vertical bars represent standard errors of means within each comparison
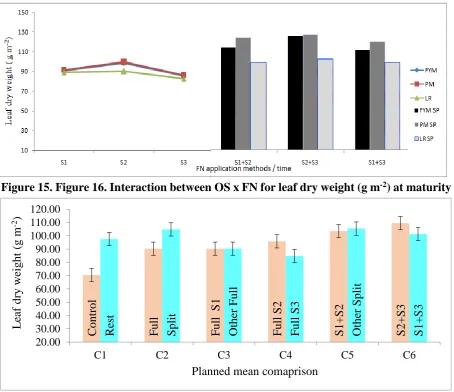
Leaf dry weight (g m-2) at physiological
maturity
Data regarding to leaf dry weight at physiological maturity indicated that mean of the treatment shows that fertilizer N
application (Figure 13) and organic sources (Figure 14) had significant effect on leaf dry weight, whereas their interaction was also significant (Figure 15). The planned mean comparisons for leaf dry weight
C
ontrol
F
ull
F
ull
S
1
F
ull S
2
S
1+
S
2
S
2+
S
3
R
est
S
pli
t
Othe
r
F
ull
F
ull S
3
Othe
r
S
pli
t
S
1+
S
3
50.00 70.00 90.00 110.00 130.00 150.00 170.00
C1 C2 C3 C4 C5 C6
S
pike dr
y
we
ig
ht
(g
m
-2)
among control vs rest, full vs split, full S2 vs full S3, S2+S3 vs S1+S3 were significant (Figure 16), whereas all other mean comparisons were remained not significant. The maximum leaf dry weight was recorded in poultry manure incorporated plots followed by farmyard manure, but it was not different from poultry manure plots whereas legume residue resulted minimum leaf dry weight.
Regarding fertilizer N application maximum leaf dry weight was observed when N was applied in split form ½ tillering + ½ boot stage, where plot receiving full N at boot stage resulted minimum leaf dry weight. Maximum leaf dry weight was found for the rest of the treatments as
compared to control. Split application had produce maximum leaf dry weight than full application however nitrogen application as full dose at tillering had maximum leaf dry weight compared to booting stage. Maximum leaf dry weight was recorded in plots where N was applied at tillering and booting than sowing and booting stages. Interaction between organic sources and fertilizers N were significant for leaf dry weight. The application of N as full dose upto tillering increased leaf dry weight along with PM and FYM, while for LR leaf dry weight seems to be less affected The decrease in leaf dry weight was more for all organic manure when fertilizer N was applied as full dose was applied at booting.
Figure 13. Leaf dry weight (g m-2) at maturity stage as affected by FN application
(methods/ time). Vertical bars represent standard errors of means within each comparison
20.00 40.00 60.00 80.00 100.00 120.00
S1 S2 S3 S1+ S2 S2+ S3 S1+ S3
L
ea
f
dry
we
ig
ht
(g
m
-2 )
FN application method/ time
20.00 30.00 40.00 50.00 60.00 70.00 80.00 90.00 100.00 110.00 120.00
FYM PM LR
L
ea
f
dry
wig
ht
(g
m
-2 )
Organic sources for N
Figure 14. Leaf dry weight (g m-2) at maturity as affected by organic sources for N.
Regarding split application of N the spike dry weight for FYM increases significantly at tillering and booting and then decreased at sowing and booting. While in case of LR
and PM leaf dry weight seems to be comparatively less affected leaf dry weight increased at tillering and booting, and decreased at sowing and booting.
Figure 15. Figure 16. Interaction between OS x FN for leaf dry weight (g m-2) at maturity
Figure 16. Planned mean comparison for leaf dry weight (g m-2) at maturity as affected
by FN application (method/time). Vertical bars represent standard errors of means within each comparison
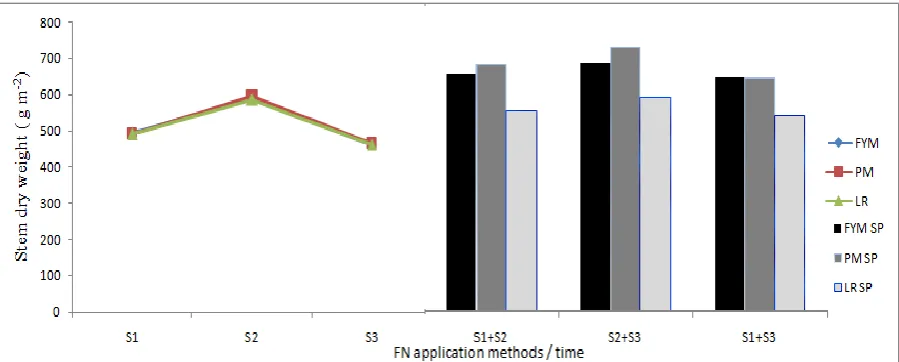
Stem dry weight (gm-2) at physiological
maturity
Data correlated to stem dry at physiological maturity are given in following figures. Mean values of the treatment showed that fertilizer N application (Figure 17) and organic sources (Figure 18) had significant effect on stem dry weight, whereas the interaction was also significant (Figure 19). The planned mean comparisons for stem dry weight at maturity among control vs rest, full vs split, full S2 vs full S3, S2+S3 vs S1+S3 were significant, whereas all
other mean comparisons were remained not significant (Figure 20). The maximum stem dry weight was recorded in poultry manure incorporated plots followed by farmyard manure, but it was not different from poultry manure plots whereas legume residue resulted minimum stem dry weight. Regarding fertilizer N application maximum stem dry weight was observed when N was applied in split doses at tillering and boot, where plot receiving full N at boot stage resulted minimum stem dry weight. Maximum stem dry weight was
C
ontrol
F
ull
F
ull
S
1
F
ull S
2
S
1+
S
2
S
2+
S
3
R
est
S
pli
t
Othe
r
F
ull
F
ull S
3
Othe
r
S
pli
t
S
1+
S
3
20.00 30.00 40.00 50.00 60.00 70.00 80.00 90.00 100.00 110.00 120.00
C1 C2 C3 C4 C5 C6
L
ea
f
dry
we
ig
ht
(g
m
-2)
found for the rest of the treatments as compared to control. Split application had produce maximum stem dry weight than full Application however full dose at sowing had Greater number of tillers than at other stages of full dose. Nitrogen application as full dose at tillering had maximum stem dry weight compared to booting stage. Maximum stem dry weight was recorded in plots where N was applied at tillering and booting than sowing and booting stages. Interaction between organic sources and fertilizers N were significant for stem dry weight. The application of N
as full dose upto tillering increased stem dry weight along with all organic manures. The decrease in stem dry weight was more for all organic manure when fertilizer N was applied as full dose at booting. Regarding split application of N the stem dry weight for FYM and PM increases significantly from sowing and tillering to tillering and booting and then decreased at sowing and booting. While in case of LR stem dry weight seems to be comparatively less affected increased at tillering and booting, and decreased at sowing and booting.
Figure 17. Stem dry weight (g m-2) at maturity as affected by FN application (methods/
time).Vertical bars represent standard errors of means within each comparison
Figure 18. Stem dry weight (g m-2) at maturity as affected by organic sources for N.
Vertical bars represent standard errors of means within each comparison
200.00 250.00 300.00 350.00 400.00 450.00 500.00 550.00 600.00 650.00 700.00
S1 S2 S3 S1+ S2 S2+ S3 S1+ S3
S
tem dr
y
we
ig
ht
(g
m
-2)
FN application method/time
200.00 250.00 300.00 350.00 400.00 450.00 500.00 550.00 600.00 650.00
FYM PM LR
S
pike dr
y
wig
ht
(g
m
-2)
Figure 19. Interaction between OS x FN for stem dry weight (g m-2) at maturity
Figure 20. Planned mean comparison for stem dry weight (g m-2) at maturity as affected
by FN application (methods/ time). Vertical bars represent standard errors of means of each comparison
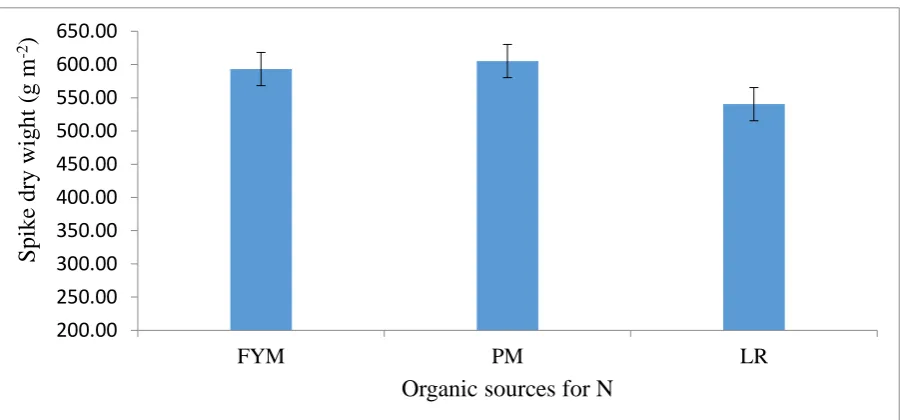
Spike dry weight (g m-2) at physiological
maturity
Data on the subject of spike dry are given was analyzed. Mean of the treatment shows that fertilizer N application (Figure 21) and organic sources of N (Figure 22) had significant effect on spike dry weight, whereas the interaction was also significant (Figure 23).The planned mean comparisons for spike dry weight at maturity among control vs rest, full vs split, full S2 vs full S3, S2+S3 vsS1+S3 were significant, whereas all other mean comparisons were remained not significant (Figure 24). The maximum spike dry weight was recorded in poultry incorporated plots, where legume
residue resulted in minimum spike dry weight. In case of fertilizer N application maximum spike dry weight was observed when N was applied in split doses at tillering and boot, where plot receiving full N at boot stage resulted minimum spike dry weight. Maximum spike dry weight was found for the rest of the treatments as compared to control. Split application had produce maximum spike dry weight than
full application however nitrogen
application as full dose at tillering had maximum spike dry weight compared to booting stage. Maximum spike dry weight was recorded in plots where N was applied
C
ontrol
F
ull
F
ull
S
1
F
ull S
2
S
1+
S
2
S
2+
S
3
R
est
S
pli
t
Othe
r
F
ull
F
ull S
3
Othe
r
S
pli
t
S
1+
S
3
200.00 300.00 400.00 500.00 600.00 700.00
C1 C2 C3 C4 C5 C6
S
tem dr
y
we
ig
ht
(g
m
-2)
at tillering and booting than sowing and booting stages. Interaction between organic sources and fertilizers N were significant for spike dry weight. The application of N as full dose upto tillering increased stem dry weight along with all organic manures, while for LR spike dry weight seems to be less affected. The decrease in spike dry weight was more for all organic manure when fertilizer N was
applied as full dose at booting. Regarding split application of N the spike dry weight for FYM and PM increases significantly from sowing and tillering to tillering and booting and then decreased at sowing and booting. While in case of LR spike dry weight seems to be comparatively less affected increased at tillering and booting, and decreased at sowing and booting.
Figure 21. Spike dry weight (g m-2) at maturity as affected by FN application
(methods/time). Vertical bars represents standard errors of means within each comparison
Figure 22. Spike dry weight (g m-2) at maturity as affected by organic sources for N.
Vertical bars represent standard errors of means of each comparison
200.00 300.00 400.00 500.00 600.00 700.00 800.00 900.00 1000.00
S1 S2 S3 S1+ S2 S2+ S3 S1+ S3
Spi
ke
dr
y
w
eig
ht
(g
m
-2)
FN application methods/time
700.00 750.00 800.00 850.00 900.00 950.00 1000.00
FYM PM LR
S
pike dr
y
wig
ht
(g
m
-2)
Figure 23. Interaction between OS x FN for spike dry weight (g m-2) at maturity
Figure 24. Planned mean comparison for spike dry weight (gm-2) at maturity as affected
by FN application (methods/time). Vertical bars represent standard errors of means of each comparison
Grain yield (kg ha-1)
Data associated to grain yield weight are given in following figures. Mean values of the treatment shows that fertilizer N (Figure 25) and organic sources (Figure 26) application had significant effect on grain yield, whereas the interaction was also significant (Figure 27).The planned mean comparisons for grain yield among control vs rest, full vs split, full S2 vs full S3, S2+S3 vsS1+S3 were significant (Figure 28), whereas all other mean comparisons were remained not significant. The maximum grain yield (3997 kgha-1) was recorded in poultry manure incorporated plots followed by farmyard manure (3688
kgha-1) whereas legume residue LR (3997 kgha-1). In case fertilizer N application maximum grain yield (4420 kgha-1) was observed when N was applied in split doses at tillering and boot stage followed by plots receiving N in split doses at sowing and tillering with (4015 kgha-1) and sowing and boot with (3859 kgha-1) but they are statistically similar, whereas plot receiving full N at boot stage resulted lower grain yield (2747 kgha-1). Maximum grain yield was found for the rest of the treatments as compared to control. Split application had produce higher grain yield than full application however nitrogen application as full dose at tillering had greater grain yield
C
ontrol
F
ull
F
ull
S
1
F
ull
S
2
S
1+
S
2
S
2+
S
3
R
est
S
pli
t
Othe
r
F
ull
F
ull
S
3
Othe
r
S
pli
t
S
1+
S
3
200.00 400.00 600.00 800.00 1000.00
C1 C2 C3 C4 C5 C6
S
pike dr
y
we
ig
ht
(g
m
-2)
compared to booting stage. Maximum grain yield was recorded in plots whereas N was applied at tillering and booting than sowing and booting stages. Interaction between organic sources and fertilizers N were significant for grain yield. The application of N as full dose upto tillering increased biological yield along with FYM and PM, while LR seem to be less affected. The decrease in grain yield was more for all
organic manure when fertilizer N was applied as full dose at booting. Regarding split application of N the grain yield for FYM and LR increases from sowing and tillering to tillering and booting and then decreased at sowing and booting. While in case of PM grain yield seems to be less affected across all split application methods and decreased at sowing and booting.
Figure 25. Grain yield (kg ha-1) as affected by FN application (methods/time).Vertical
bars represents standard errors of means within each comparison
Figure 26. Grain yield (kg ha-1) as affected by organic sources for N. Vertical bars
represent standard errors of means of each comparison
2000.000 2500.000 3000.000 3500.000 4000.000 4500.000 5000.000
S1 S2 S3 S1+S2 S2+S3 S1+S3
Gr
ain
y
ield
(kg
ha
-1 )
FN Application methods /time
2000.00 2500.00 3000.00 3500.00 4000.00 4500.00
FYM PM LR
Gr
ain
y
ield
(kg
ha
-1 )
Figure 27. Interaction between OS x FN for Grain yield (kgha-1)
Figure 28. Planned mean comparison for Grain yield (kgha-1) as affected by FN
application (methods/time). Vertical bars represent standard errors of means of each comparison
Discussion
Both pre and post anthesis dry matter production in plant was positively influenced by organic sources and nitrogen application methods. Among organic sources greater poultry manure had high dry matter partitioned to leaves, stem and spike than other organic sources. Poultry manure had higher nitrogen content that promoted leaf, stem, and spike growth. Nitrogen stimulated dry matter production in leaf, stem and spike because it increased plant vegetative canopy that resulted in improved efficiencies of radiation and water use. Our results are also supported by [20, 21]. In case of nitrogen application methods, higher leaf, stem, spike dry
weight was determined when nitrogen was applied in split doses at tillering and boot stage. This might be due to maximum uptake of nitrogen at tillering and boot stage which generated chlorophyll contents for gaining maximum assimilates. The results are also supported by [14, 18]who reported that split application of nitrogen at tillering and boot stage increased nitrogen uptake and rate of photosynthesis due to which dry matter production are increased in various parts of the plants. Interaction between organic sources and nitrogen application methods revealed that the application of nitrogen as full dose up to tillering increased dry matter partitioning to leaf, stem and spike at both stages i.e
pre-C
ontrol
F
ull
F
ull
S
1
F
ull
S
2
S
1+
S
2
S
1+
S
2
R
es
t
Sp
lit
Ot
h
er
Fu
ll
Fu
ll
S3
Ot
h
er
sp
lit
S1
+S
3
200 700 1200 1700 2200 2700 3200 3700 4200 4700
C1 C2 C3 C4 C5 C6
Gr
ain
y
ield
(kg
ha
-1)
Planned mean comparison
2000.00 2500.00 3000.00 3500.00 4000.00 4500.00 5000.00
S1 S2 S3 S1+S2 S2+S3 S1+S3
Gr
ain
y
ield
(kg
ha
-1)
FN application methods/ time
anthesis and at physiological maturity along with all organic manures. Further application at booting had decreased dry matter partitioning. Regarding split application of nitrogen the dry matter partitioning to leaf, stem and spike for FYM and PM increases significantly at tillering and booting , while LR have less effected by split application of nitrogen. This might be due to that the combine application of nitrogen from organic sources and chemical fertilizer increasing nitrogen availability to the plant which had improved the chlorophyll in the canopy through nitrogen absorption and thus might had increased
canopy of plant for compensating
maximum light and generating of larger photosynthates. Our results are in agreement with [22, 23]who stated that the combine application of nitrogen from organic sources and chemical fertilizer enhanced nitrogen availability to the plants which improved the chlorophyll in the canopy through nitrogen absorption and thus might had increased the leaf area for generation of larger photosynthates, and thus ultimately might have improved the dry matter of individual components like leaves, stem and spike. Organic sources and nitrogen application had considerable effect on grain yield. The maximum grain yield
was recorded in poultry manure
incorporated plots rather than FYM and LR. Our results are in line with the findings of [15, 24]who have reported that application of organic manures preserved soil biota, higher water retention, decreased soil compaction, enhanced soil fertility, increased nutrient availability and reduction in nutrient losses which contributed to increased grain yield. In nitrogen application methods, higher grains yield was recorded when nitrogen was applied in split doses at tillering and boot stage. This might be due to that nitrogen applied in split doses at tillering and booting are less susceptible to losses and maximum availability to the crops due photosynthetic ability of plant improved which increased grain yield. Our results are
in line with the finding of [14, 24, 25].The application of nitrogen as full dose upto tillering increased grain yield along with FYM and PM, while LR seem to be less affected. The decrease in grain yield was more for all organic manure when fertilizer nitrogen was applied as full dose at booting. Regarding split application of nitrogen the grain yield for FYM and LR increases from sowing and tillering to tillering and booting and then decreased at sowing and booting. While in case of PM grain yield seems to be less affected across all split application methods and decreased at sowing and booting. The findings of [14, 16, 25] reported similar results for obtaining higher grain yield with combined application of organic manures and inorganic fertilizers. Authors’ contributions
Conceived and designed the experiments: F Munsif & MZ Afridi, Performed the Experiments: M Bakhtiar, Analyzed the Data: M Bakhtiar & S Rehman, Contributed reagents/ materials/ analysis tools: IUR Arshad, M Rabnawaz, S Khan, M Farooq & MN Khan, Wrote the paper: M Bakhtiar & M Adil.
References
1. Khalil IA & Jan A (2002). Cereal crops. In: Cropping technology. A text book of Agriculture. National Book Foundation Islamabad. pp. 169.
2. Shah P (1994). Rabi cereal crops. In: Crop Production, Bashir E & Bantel R
(Eds) National Book Foundation
Islamabad. pp. 235.
3. Memon KS (1996). Soil and fertilizer phosphorus. In: Soil Science, Bashir E &
Bantel R (Eds) National Book
Foundation, Islambad.pp.291-314. 4. Ali KF, Munsif, Zubair M, Hussain Z,
Shahid M, Din IU & Khan N (2011). Management of organic and inorganic nitrogen for different maize varieties.
Sarhad J Agric 27(4): 525-529.
5. Mandal NN, Chaudhry PP & Sinha D 1992. Nitrogen, phosphorus and potash uptake of wheat (var. Sonalika). Env and Eco 10: 297.
between non-flooded mulching cultivation and varying nitrogen inputs in rice wheat rotations. Field Crop Res 91: 307-318.
7. Habtegebrial K, Singh BR & Haile M (2007). Impact of tillage and nitrogen fertilization on yield, nitrogen use efficiency of wheat and soil properties.
Soil and Tillage Res 94: 55-63.
8. Khalil IA & Jan A (2002). Cereal crops. In: Cropping technology. A text book of Agriculture. National Book Foundation Islamabad. pp. 169.
9. Negassa W, Gebrekidan H & Friesen DK (2005). Integrated use of farmyard manure and NP fertilizers for maize on farmers fields. J Agric and RD 2(106): 131–14.
10.Alam SM, Shah SA, Ali S & Iqbal MM (2003). Effect of integrated use of industrial wastes and chemical fertilizer on phosphorus uptake and crop yields.
Pak J Soil Sci 22: 81-86.
11.Alam SM, Shah SA & Iqbal MM (2005). Evaluation of method and time of fertilizer application for yield and
optimum P-efficiency in wheat.
Songklanakarin J Sci Tech 27(3):
457-463.
12.Mehmood T, Azam F, Hussain F & Malik KA (1997). Carbon availability and microbial biomass in soil under an irrigated wheat maize cropping system receiving different fertilizer treatment.
Biology and Fertility of Soil 25: 63–68.
13.Jan A, Amanullah and Noor M 2011. Wheat response to farm yard manure and nitrogen fertilization under moisture stress conditions. J Plant Nut 34(5): 732- 742.
14.Hussain T, Jullani G & Iqbal MZ (1988). Integrated use of organic and inorganic nitrogen fertilizer in rice- wheat cropping system. Pak J Soil Sci 3: 19–23.
15.Khan A, Jan MT, Marwat KB & Arif M (2009). Organic and inorganic nitrogen treatments effects on plant and yield attributes of maize in a different tillage systems. Pak J Bot 41(1): 99-108. 16.Jan T, Jan MT, Arif M, Akbar H & Ali S
(2007). Response of wheat to source, type
and time of nitrogen application. Sarhad
J Agric 4(23): 871-882.
17.Doberman A and Fairhurst TH (2000). Rice: Nutrient disorders and nutrient management, 1st Ed. International Rice Research Institute of Canada.
18.Shah AS, Shah SM, Mohammad W, Shafi
M, Nawaz H, Shehzadi S & Amir M 2010. Effect of integrated use of organic and inorganic nitrogen sources on wheat yield. Sarhad J Agric 26(4): 559-563. 19.Jan MT, Shah P, Hollington PA, Khan MJ
& Sohail Q (2009). Agriculture Research: Design and analysis. Dept. of Agronomy, NWFP Agric. Uni. Peshawar, Pakistan. 20.Latiri SK, Nortcliff S & Lawlor DW
1998. Nitrogen fertilizer can increase dry matter, grain production and radiation and water use efficiencies for durum wheat under semi-arid conditions. Eur J
Agron 9: 21-34.
21.Anatoliy GK & Thelen KD (2007). Effect of winter wheat crop residue on no-till corn growth and development. Agron J
99: 549-555.
22.Meng L, Ding W & Cai Z (2005). Long-term application of organic manure and nitrogen fertilizer on N2O emissions, soil quality and crop production in a sandy loam soil. Soil Biol and Biochem 37: 2037-2045.
23.Abril A, Baleani D, Casado-Murillo N & Noe L (2007). Effect of wheat crop fertilization on nitrogen dynamics and balance in the Humid Pampas. Argentina. Agric. Ecosyst. and Environ 119: 171-176.
24.Islam MS, Hasanuzzamanb M,
Rokonuzzamanc M & Nahard K (2009). Effect of split application of nitrogen
fertilizer on morpho-physiological
parameters of rice genotypes. Int J Plant Prod 3(1): 51-61.
25.Dang TH, CaiG X, Guo SL, Hao MD &
Heng LK (2006). Effect of N