© Global Society of Scientific Research and Researchers http://ijcjournal.org/
Framework for Evaluation of Enterprise Software in IT
Service Management of Small and Medium Enterprises
Bakhytzhan Azamatov
*Czech Uneversity of Life Sciences, Prague 165 00, Czech Republic
Email: [email protected]
Abstract
The paper is concerned with problems arising in the process of management of enterprise software integration
for better fitting to business needs through evaluation its performance and user’s satisfaction. The method
assumed to be used on the small and medium enterprises (SMEs) to substitute expensive and high human
recourse demanded methods. The paper describes the enterprise software evaluation method which was tested in
three SMEs. The method and findings of this work can certainly be useful for SMEs that need to evaluate their
enterprise software to clarify how it suits to their business processes and what the end-users experiences in
working process.
Keywords: enterprise software; SME; software evaluation.
1. Introduction
Nowadays, enterprise software is attracting more and more organizations because of their usability, simplicity
and effectiveness. These characteristics can support cost reduction for user training. But for organizations with
less financial and human recourses capacity, a less complicated and less costly enterprise software evaluation
method is an advantage. Enterprises use many different kinds of software, but most of that software does not fit
a definition of enterprise software. If an employee buys software used by another company as enterprise
software, but uses it for his personal needs then it is not be considered as enterprise software [1]. The enterprise
software considered in this paper is the specialized integrated suite of software applications that can provide a
common data model and processes at different levels and units of the organization.
The most common examples of enterprise software can be the Enterprise Resource Planning (ERP), human
resource management, online billing and Client Relationship Management (CRM) systems, or even the software
of an organization’s own production.
2. Importance of this Research
The role of small and medium enterprises (SMEs) in a national economy has been accentuated all over the
world for their contribution to total productivity and to job opportunities [2]. At the same time, the rapid growth
of information and communication technologies (ICT) determines the performance and competitiveness of the
SMEs. It is believed that ICTs became a necessity in the management of SMEs in order to survive in the modern
business environment. According to Porter’s theory, ICTs have the potential to attain a competitive advantage
[3]. The main goal of the implementation of ICTs in SME was optimization of the enterprise’s operational
processes. According to Lucchetti and Sterlacchini (2004) adoption of ICT was the reason for the high growth
rate in the US economy during the 1990s [4]. However, some experts argue that because ICTs are now being
widely used by enterprises, it has lost its effectiveness as a strategic instrument of a company’s differentiation
and companies no longer obtain the advantage they did at the onset of ICT [5].
However, most of the organizations do not have clear vision what they need from the enterprise software and
what they actually have. In that case having more effective integrated enterprise software gives advantage to
organizations. Therefore, increasing the effectiveness of enterprise software is crucial for organizations.
Furthermore, such evaluation approach gives the organizations an instrument to make decisions which part of
enterprise software must be extended and which part is not needed as well as to understand how users see the
application.
3. Objective
The aim of the current work is to propose a quality evaluation method to improve integration of enterprise
software in small and medium enterprises (SME) and to clarify the productivity of their software. The
motivation for choosing the object quality modeling systems is the current situation, where quality service
evaluation is not widely used or does not match with the requirements or capabilities of the SMEs. The quality
of the selected area issues are addressed primarily from the perspective of SMEs needs. Does the software that
an organization utilizes suit its expectations? Are users satisfied with it? These are the main questions which
proposed method pretends to solve.
4. Research Methodology
A measurement procedure should be based on two essential questions: organization’s expectations and users’
experience. According to these questions it is possible to decide what should be measured. After determining the
basic parameters for the measurement, we can then choose the method to measure these parameters. The
methods should be selected on the basis of our measurement model, which means that each measured parameter
Representatives from variety levels and departments were chosen to answer to two questions:
1.What the software should do?
2.How it should perform?
Based on the results of the answers from tested organizations there was created a list of possible parameters.
The Organizations were given an overall score of 10 each to divide it between parameters. There are left four
major parameters (table below).
Table 1: List of parameters
Parameter Score
Functionality 6
Reliability 4
Interoperability 3
Usability 3
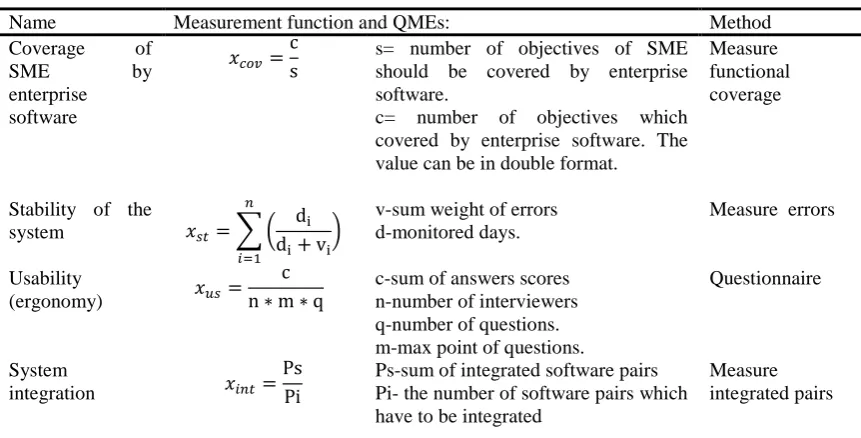
The following table describes measurement functions and quality measurement elements for chosen parameters.
Table 2: Parameters and formulas of proposed method
Name Measurement function and QMEs: Method
Coverage of SME by enterprise
software
𝑥𝑥𝑐𝑐𝑐𝑐𝑐𝑐=cs s= number of objectives of SME should be covered by enterprise software.
c= number of objectives which covered by enterprise software. The value can be in double format.
Measure functional coverage
Stability of the
system 𝑥𝑥𝑠𝑠𝑠𝑠=� � di di+ vi� 𝑛𝑛
𝑖𝑖=1
v-sum weight of errors d-monitored days.
Measure errors
Usability
(ergonomy) 𝑥𝑥𝑢𝑢𝑠𝑠= c
n∗m∗q c-sum of answers scores n-number of interviewers q-number of questions. m-max point of questions.
Questionnaire
System
integration 𝑥𝑥𝑖𝑖𝑛𝑛𝑠𝑠= Ps Pi
Ps-sum of integrated software pairs Pi- the number of software pairs which have to be integrated
Measure integrated pairs
Coverage and Integration are based on the organization’s expectations, whereas the Stability and Usability are
Expectation can indicate absence of some needed features, while user experience more precisely considers what
is already available.
The principle described in SQuaRE i.e. that “every quality measure employs its measurement function which
normalizes the value within 0.0 to 1.0 and makes it interpreted that the closer to 1.0 is better” was followed. [6].
5. Testing method on the organizations
The organizations selected for the research are operating in Kazakhstan. The choice of organizations was based
on the procedure of approaching a contact person within that organization, determining if the organization was
appropriate to study and requesting permission to run the research in that organization. In exchange for access to
certain firms and discussion of their processes, which required commercial confidentiality, I agreed to hide real
names. Therefore the firms will be represented by abbreviation. The various types of firms were studied in order
to increase the number of practices chosen by a variety of organizations.
This part indicates the organizations that participated in the research and displays some analysis. Initially
organizations are identified individually and finally there is common analysis of all organizations.
It was agreed with three organizations that the method would be used in their organizations. Finding suitable
participants took about three months. Each organization agreed to present three circles of evaluation.
6. Short Description Of Organizations Participated
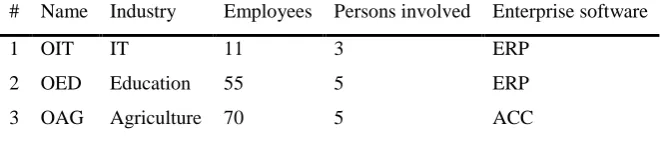
The Table 3 gives a short description of the participants. Since participants asked for privacy, the names of
organizations were substituted by abbreviations consisting of O- which means “organization” and the two letters
from the industry which they represent. The second (OED) and the third (OAG) organization use many seasonal
workers. Therefore average annual figures were taken as the number of employees.
Table 3: Description of the organizations
# Name Industry Employees Persons involved Enterprise software
1 OIT IT 11 3 ERP
2 OED Education 55 5 ERP
3 OAG Agriculture 70 5 ACC
7. Results and discussion
The participants are from various regions. The First organization (OIT) from the table above is from Almaty
region, a quite developed region. It works in IT industry, in the area of providing internet to clients. It is a small
Their end result for three rounds of evaluation shows that they rate the performance of their software quite
highly. Most of the values are around 0.8. Performance was rated higher than other measures. Usability had the
lowest result. In the coverage, they indicated 24 necessary processes and their software covered 19.4 of them.
Unfortunately, the Integration part had very few records. Accordingly, the result was 7 required and 6 solved.
The Integration part faced some difficulties. Therefore, it will be discussed in the end of this chapter.
OED – the organization is medium in number of employees but small in assets organization. It is a college. It
operates in the area of education and provides services for students.
Their estimation results (table above) are lower than those of the previous organization. They also estimated
stability very high. However, they rated integration very low. The remaining graphs are much better. In
particular, the estimation of Usability goes up circle by circle.
In the last round the number of necessary processes is 38 and estimation of their coverage is 25.6, which gives a
result 0.67. It is not a bad result. However, it is not a desirable result.
The last organization OAG is from the agriculture industry. The number of employees is not much more than
OED, but in comparison its assets suit that of medium organization requirements. It is mainly aimed at animal
breeding. It is also engaged in plant growing.
The Table above describes the results received from OAG. The first thing to notice is that the results from the
graph are very similar to the results of the previous organizations. However, Nevertheless, there is greater data
from this organization. For example, processes added are 93 which is three times more than the previous
organization. Furthermore, all the users entered the data in every circle, whereas in OED some users stopped
entering data after first circle. Overall the results given from organizations indicate that they are mostly satisfied
with their enterprise software.
The table below shows how many needed processes organizations entered into the database and there is shown
mean value for the processes in every round. All responses are above average.
Table 4: Processes entered by rounds
Organizations
Round OIT OED OAG
Count Average Count Average Count Average
1 21 0,78 16 0,71 31 0,65
2 3 1 19 0,66 25 0,74
was expected, the number of required coverage functions increased according to the size of the organization.
The first two organizations filled out the needed functions in the first two rounds. The last organization filled it
consistently.
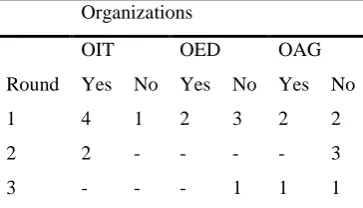
In the Table 5, data from the integration part is represented. This part is fairly questionable. Despite the fact that
organizations insisted on the importance of this part, there were few responses from the responsible persons.
Collected responses revealed less satisfaction with this parameter.
Table 5: Integration pairs.
Organizations
OIT OED OAG
Round Yes No Yes No Yes No
1 4 1 2 3 2 2
2 2 - - - - 3
3 - - - 1 1 1
The integration part was poorly completed. But it is interesting to note how the respondents filled the required
fields. The OIT filled the integration fields with more advanced terms, while the rest mentioned only reports and
other simple requirements for their enterprise software. For example: reports to Tax-officials. OIT indicated
some universal integration instruments as an important value. The main reason for this is that OIT is from a
more developed region and represents the information technology field.
Table 6: Usability comparison of organizations
Organizations
Round User numbers OIT OED OAG
Summ Average Summ Average Summ Average
1 3 110 7,8571 252 7,2 271 7,7429
2 5 94 7,2308 160 7,619 283 8,0857
3 5 156 7,4286 165 7,8571 281 8,0286
In the table above, one can see the results of Usability part where end-users estimated the software they use. The
average number is good for all of the organizations. The ergonomic part was filled by organizations’ end-users.
Overall, 13 people from three organization participated in the estimation. Most of the results show an increase in
the responses round by round. To clarify some aspects, a short discussion was conducted after all three rounds.
The table below describes results duration of error registration and average results for the organizations. The
stability part shows the highest response from all three organizations. As has been mentioned, the reliability part
presents the highest results.
Table 7: Comparison of incidents the organizations
Organizations
OIT OED OAG
Round Days Average Days Average Days Average
1 27 0,9 40 0,84 44 0,8
2 27 0,87 21 0,86 35 0,87
3 27 0,94 25 0,89 30 0,82
These days, most commercial enterprise software works with very few errors due to better development process,
but errors can still occur. The problems can be objectively software faults, but also they can be cause of
interaction of enterprise software with external factors. Some errors can be not due to a fault of the software but
the reason can be poor understanding by users of their software. Also, there were some errors related to the
environment. For instance, in one of the organizations there were many errors associated with network
problems. The organization had poor network infrastructure. Such problems can be avoided by categorization of
the incidents.
8. Method applying
Quality of software is sandwiched between progress in business and technology[7]. If one falls behind, there
will not be high quality. This is why quality control of software is important. However, we must not forget about
the business which uses it. Business must clearly see their needs and track the experience with software in order
to improve or substitute it. Without doubt, the proposed method has it is own limitations. Larger organizations
have more comprehensive requirements and this method is inadequate for them, but SMEs can find a lot of
benefits from it, such as time saving in formulating initial requirements and lack of complicated documentation.
The method will certainly have a positive impact on organizations since it is based on their expectations and the
experience of the users in the organization. It highlights that organizations decide what they need, not the
vendors. In many cases, vendors sell products with many non-needed functions which just will take up space in
the hardware and memory, and these non-used functions can negatively impact the quality evaluation process.
This must be avoided when organizations want to evaluate their software and get more realistic results.
For the enterprise, the method would bring benefits through the possibility of learning and understanding their
ICT in the process of evaluation. Organizations can determine their requirements in the process of evaluation.
The main advantage of this method is that organizations do not need to describe all the processes. They can just
specify the processes which they need in this moment and, over time, if the problem is resolved; it will stay on
the list as unresolved and will not give an additional credit to the software.
9. Conclusion
In this work, the framework for software service evaluation for better integration of enterprise software was
proposed. Practically, many SME organizations quite often do not understand in depth their enterprise software.
A group of organizations with enterprise software agreed on benefits from proposed method and changed their
corporative strategy about software service evaluation. The evaluation process gave them more understanding of
the functionality they needed. In the end of the research they could clearly sort out what they have, what they
need and formulate the ways to achieve higher level.
10. Limitations
In conclusion, some limitations must be mentioned. The organizations that participated in the research were
volunteers so the results from them really depend on what they wished to do depending on their busyness.
Therefore, some important aspects of evaluation can be missed. Also, data from only three organizations that
have the similar enterprise software were used.
References
[1] K. Sitaker. (2005, "Enterprise software" is a social, not technical, phenomenon. Available:
https://www.mail-archive.com/[email protected]/msg00109.html
[2] A. Gunasekaran, Marri, H. B., & Grieve, R. J.,, "Activity based costing in small and medium
enterprises," Computers & Industrial Engineering, vol. 37, pp. 397-410, 1999.
[3] M. Porter and E. Millar, How Information Gives You a Competitive Advantage. New York: Free Press,
1985.
[4] Lucchetti R. and Sterlacchini A., "The Adoption of ICT among SMEs: Evidence from an Italian
Survey," Small Business Economics, vol. 23, pp. 150-167, 2004.
[5] Carr N. G., "‘IT Doesn’t Matter," Harvard Business Review, vol. 41, pp. 5-9, 2003.
[6] ISO/IEC, "ISO/IEC 25022," in Systems and software engineering - Systems and software Quality
Requirements and Evaluation (SQuaRE) – Measurement of quality in use, ed. Japan: ISO/IEC JTC
1/SC 7, 2012.