GSJ: Volume 7, Issue 9, September 2019, Online: ISSN
2320-9186www.globalscientificjournal.com
DESIGN AND IMPLEMENTATION OF SCADA CONTROL
FOR REMOTE INDUSTRIAL PLANT
Engr Oparanwata Chidi Cosmas
Department of Electrical and Electronic Engineering Petroleum Training Institute, Effurun Delta State, Nigeria.
KeyWords
Control, Industrial Plant, microcontroller, SCADA Application, Temperature.
ABSTRACT
INTRODUCTION
SCADA systems are common process automation systems that are used to gather information from instruments and sen-sors placed at remote sites and to transmit information at a central site for either monitoring or controlling purpose. The collected information from sensors and instruments is typically viewed on one or a lot of SCADA host computers that square measure placed at the central location. Based on the knowledge received from the remote stations, machine-controlled or operator-driven higher-up commands is pushed to terminal management devices, that square measure typically observed as field devices.
This is a control system that uses computers, networked data communications and graphical user interfaces for process su-pervisory management, it also uses other peripheral devices like programmable logic controllers and discrete PID controllers to interface to the process plant or machinery.
The operator interface that enable monitoring and therefor the supply of process commands, like controller set-point changes, are handled through the SCADA system. However, the real-time control logic or controller calculations are performed by networked modules that are interface with the field sensors and actuators.
The SCADA idea was developed as a universal way of remote access to a range of local control modules that may be from completely different makers permitting access through normal automation protocols. In practice, large SCADA systems have grown to be-come very similar to distributed control systems in function, by using multiple means of interfacing with the plant. They can control large-scale processes that may embody multiple sites, and beat massive distances likewise as little distance.
For achieving the SCADA control for remote industrial process, a temperature logging system for a remote plant operation is taken. Here temperature sensors are duly interfaced to the PIC microcontroller. Data collected from the temperature sensors are perpec-tually sent to the microcontroller that is sucessively connected to a computer.
At the front end, software is loaded on the pc that takes these values and displays them on its front panel, and as well logs them in the database. One can set parameters like set point, low limit and high limit on the computer screen.
When the temperature of a sensor goes above or below set point the microcontroller sends a command to the corresponding relay. The heaters connected through relay contacts (corresponding to their sensors) are turned OFF/ON. High limit and low limit features are available for generating an AV alarm on the computer in the event of system failure.
Significance of Study
The project scopes covers:
1. Supervisory control and data acquisition system (SCADA).
2. Industrial plant and Process parameters such as temperature etc.
3. PC Based Application Software.
4. Embedded systems i.e. microcontrollers and communication interfaces.
The Objectives of the Study
The following are the specific objectives of the study:
1. To be able to determine the temperature of a process using temperature sensor.
2. To be able to develop a combination of hardware and software to monitor and control temperature and other processes in
industry.
Block Presentation of a SCADA Control for Remote Industrial Plant
TEMPERATURE
CONTROLLER POWER SUPPLY UNIT
FIELD
FCE CONTROL UNIT UNIT
FCE DISPLAY UNIT SENSOR UNIT
COMMUNICATION
INTERFACE UNIT
PC/ Supervisory Control Appl
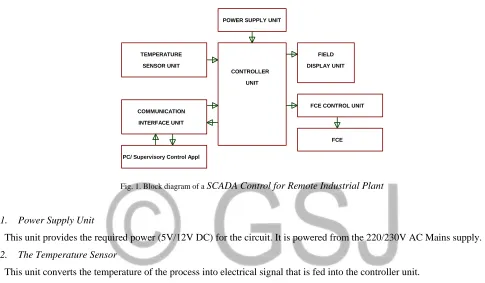
Fig. 1. Block diagram of a SCADA Control for Remote Industrial Plant
1. Power Supply Unit
This unit provides the required power (5V/12V DC) for the circuit. It is powered from the 220/230V AC Mains supply.
2. The Temperature Sensor
This unit converts the temperature of the process into electrical signal that is fed into the controller unit.
3. The Field Display Unit
This unit, installed with the process, gives a visual presentation of the process temperature. It enables field technicians to moni-tor the temperature of the process.
4. Final Control Element
The final control element (FCE) which serves as a heating element is used to increase the temperature of the process.
5. FCE Control Unit
This unit enables the controller unit to control (i.e. turn ON/OFF) the power of the FCE.
6. Communication Interface Unit
This unit enables the Controller to communicate with the computer/PC where the supervisory and control Application runs. The serial communication protocol was used to implement the interface. This unit was implemented with a TTL TO USE MODULE.
7. The Controller Unit
This unit performs the logic of the entire system. It reads the electrical signal from the temperature sensors, calibrate it, and sends it to the field display unit for field monitoring and also to the PC through the communication interface. The SET Points is set at the PC Level and saved in the internal EEPROM of the controller.
The PC runs the supervisory and control application. The application is in C# Programming language by Microsoft Corporation. The applications runs on windows 7, 8 and 10. The application presents a visual presentation of the entire process and also allows the operator to input set-points for the processes.
Design Methodology
Design Specification
This system has the following design specifications: Input voltage: 220/220VAC @ 50HZ
Number of Process: Three (3)
Process Type: Two is AIR; one is Water
Temperature Sensor type: Two LM35 (Air Processes) and 10K Thermistor Field Display: 16 x 4 liquid crystal display (LCD)
Communication Port: USB
1. The Temperature Sensor Unit
This unit converts the temperature of the process into electrical signal. Below are the Requirements for the selection of the Temperature Sensor
Reasonable Temperature Range
Easy to Mount an d Use
Easy to Bias
Availability and Cost Effective
The Temperature Sensor LM35 and 10K NTC Thermistor was selected, below are some of the Features of the 10K Thermistor:
Temperature Range: -80 to +150 degree Centigrade
It Readily Available and Cost Effective than the Thermocouples and Platinum RTD Sensor
It is easy to bias i.e. Using a Voltage divider resistor Network, its Resistance is inversely proportional to temperature Below are some Features of the LM35 sensor
Temperature Range: 0 to 120 degree Centigrade
Easy to bias: i.e. it outputs 10milli volts per 1 degree temperature rise. it is Readily Available and Cost effective
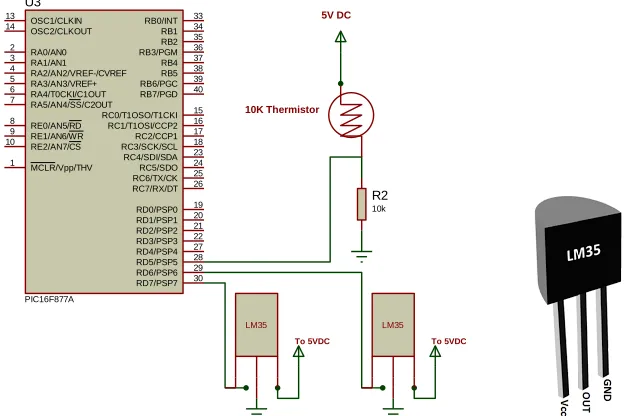
RA0/AN0 2 RA1/AN1 3 RA2/AN2/VREF-/CVREF 4 RA4/T0CKI/C1OUT 6 RA5/AN4/SS/C2OUT 7 RE0/AN5/RD 8 RE1/AN6/WR 9 RE2/AN7/CS 10 OSC1/CLKIN 13 OSC2/CLKOUT 14 RC1/T1OSI/CCP2 16 RC2/CCP1 17 RC3/SCK/SCL 18 RD0/PSP0 19 RD1/PSP1 20 RB7/PGD 40 RB6/PGC 39 RB5 38 RB4 37 RB3/PGM 36 RB2 35 RB1 34 RB0/INT 33 RD7/PSP7 30 RD6/PSP6 29 RD5/PSP5 28 RD4/PSP4 27 RD3/PSP3 22 RD2/PSP2 21 RC7/RX/DT 26 RC6/TX/CK 25 RC5/SDO 24 RC4/SDI/SDA 23 RA3/AN3/VREF+ 5 RC0/T1OSO/T1CKI 15 MCLR/Vpp/THV 1 U3 PIC16F877A LM35 To 5VDC LM35 To 5VDC R2 10k 5V DC 10K Thermistor
Fig. 2.0: Circuit Interface between the LM35 Temperature Sensor and the Microcontroller
2. The Field Display Unit
This unit, installed with the process, gives a visual presentation of the process temperature. It enables field technicians to moni-tor the temperature of the process.
Requirements of the Field Display unit:
Be Large Enough to represent the temperature values of the three (3) process.
Easy to interface, bias and use. Cost Effective and Available.
Selection of the Field Display Unit
The 16x4 LCD Standard Hitachi HD44780 was Used. Below are some of its features:
It has four (4) Rows and 16 Characters per Row, Enough to represent the process temperatures.
It is Cost Effective, available and Easy to Interface.
The 16x4 LCD connects directly to the microcontroller, below is the circuit interface of the 16x4 LCD and the microcontroller.
VI 1 VO 3 G N D 2 U2
7805 Voltage Regulator RA0/AN0 2 RA1/AN1 3 RA2/AN2/VREF-/CVREF 4 RA4/T0CKI/C1OUT 6 RA5/AN4/SS/C2OUT 7 RE0/AN5/RD 8 RE1/AN6/WR 9 RE2/AN7/CS 10 OSC1/CLKIN 13 OSC2/CLKOUT 14 RC1/T1OSI/CCP2 16 RC2/CCP1 17 RC3/SCK/SCL 18 RD0/PSP0 19 RD1/PSP1 20 RB7/PGD 40 RB6/PGC 39 RB5 38 RB4 37 RB3/PGM 36 RB2 35 RB1 34 RB0/INT 33 RD7/PSP7 30 RD6/PSP6 29 RD5/PSP5 28 RD4/PSP4 27 RD3/PSP3 22 RD2/PSP2 21 RC7/RX/DT 26 RC6/TX/CK 25 RC5/SDO 24 RC4/SDI/SDA 23 RA3/AN3/VREF+ 5 RC0/T1OSO/T1CKI 15 MCLR/Vpp/THV 1 U4 PIC16F877A D 7 1 4 D 6 1 3 D 5 1 2 D 4 1 1 D 3 1 0 D 2 9 D 1 8 D 0 7 E 6 R W 5 R S 4 V S S 1 V D D 2 V E E 3 16X4 LCD LM041L
To 5V vcc
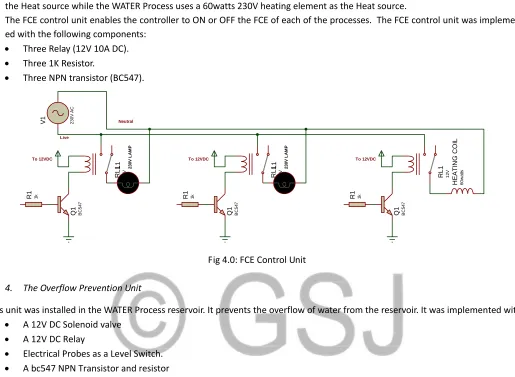
3. The Final Control Element and Control Unit
Heat sources was used as the Final control element (FCE) of the system. The two AIR Processes uses two 100watts 230V Bulbs as the Heat source while the WATER Process uses a 60watts 230V heating element as the Heat source.
The FCE control unit enables the controller to ON or OFF the FCE of each of the processes. The FCE control unit was implement-ed with the following components:
Three Relay (12V 10A DC).
Three 1K Resistor.
Three NPN transistor (BC547).
Fig 4.0: FCE Control Unit
4. The Overflow Prevention Unit
This unit was installed in the WATER Process reservoir. It prevents the overflow of water from the reservoir. It was implemented with:
A 12V DC Solenoid valve
A 12V DC Relay
Electrical Probes as a Level Switch.
A bc547 NPN Transistor and resistor
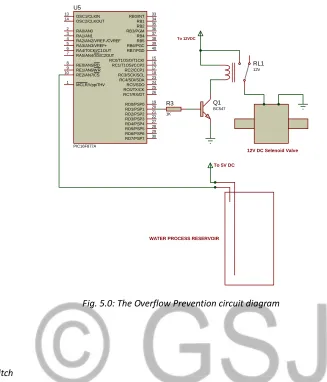
Below is the Circuit diagram of the Overflow prevention unit.
R
L
1
1
2
V
Q1 BC5
4
7
R1 1k
To 12VDC
R
L
1
1
2
V
Q1 BC5
4
7
R1 1k
To 12VDC
L1 23
0
V
L
A
M
P
R
L
1
1
2
V
Q1 BC5
4
7
R1 1k
To 12VDC
L1 23
0
V
L
A
M
P
V1 23
0
V
A
C
Neutral
Live
H
E
A
T
IN
G
C
O
IL
6
0
w
a
tt
RL1
12V
Q1
BC547
To 12VDC
RA0/AN0 2
RA1/AN1 3
RA2/AN2/VREF-/CVREF 4
RA4/T0CKI/C1OUT 6
RA5/AN4/SS/C2OUT 7
RE0/AN5/RD 8
RE1/AN6/WR 9
RE2/AN7/CS 10
OSC1/CLKIN 13
OSC2/CLKOUT 14
RC1/T1OSI/CCP2 16 RC2/CCP1 17 RC3/SCK/SCL 18
RD0/PSP0 19 RD1/PSP1 20 RB7/PGD 40 RB6/PGC 39 RB5 38 RB4 37 RB3/PGM 36 RB2 35 RB1 34 RB0/INT 33
RD7/PSP7 30 RD6/PSP6 29 RD5/PSP5 28 RD4/PSP4 27 RD3/PSP3 22 RD2/PSP2 21 RC7/RX/DT 26 RC6/TX/CK 25 RC5/SDO 24 RC4/SDI/SDA 23 RA3/AN3/VREF+
5
RC0/T1OSO/T1CKI 15
MCLR/Vpp/THV 1
U5
PIC16F877A
R3
1K
12V DC Selenoid Valve
To 5V DC
WATER PROCESS RESERVOIR
Fig. 5.0: The Overflow Prevention circuit diagram
5. The Level Switch
Two aluminum conductor was used to implement the level sensing probes. One was strategically fitted to the bottom of the res-ervoir is connected to 5V DC, while the other to the FULL level in the resres-ervoir was connected directly to the microcontroller. Recall that water is a conductor of electricity, when the water level in the reservoir reaches the top, it makes the two probes con-tacts, then allowing current to flow to the microcontroller, on the microcontroller receiving this signal activates the solenoid valve through the transistor and relay to open, so as to let water discharge from the reservoir.
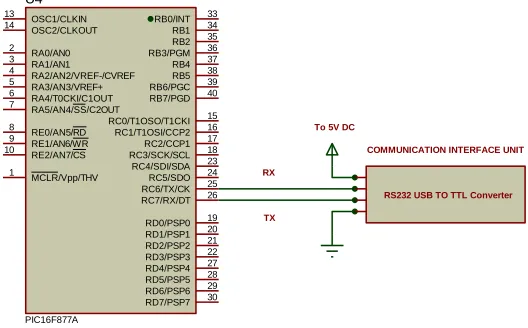
6. The Communication Interface Unit
This unit enables the controller to transmit the temperature values of the three processes to the SCADA Application in the PC.
Requirements of the communication Interface Unit
It should be able to transmit DATA within a reasonable range.
Easy principle of operation, easy to use and mount.
Easy to interface to a microcontroller
Easy to Bias i.e. it should involve less electronic components
Power requirements should be reasonable.
Selection of the communication interface Unit
After research, this unit was implemented with a USB TO TLL Serial Communication Module. It communicates with RS232 serial communication protocol using the TX, RX and Common terminal. Below is the circuit interface of the USB TO TTL Module with the microcontroller.
RA0/AN0 2
RA1/AN1 3
RA2/AN2/VREF-/CVREF 4
RA4/T0CKI/C1OUT 6
RA5/AN4/SS/C2OUT 7
RE0/AN5/RD 8
RE1/AN6/WR 9
RE2/AN7/CS 10
OSC1/CLKIN 13
OSC2/CLKOUT 14
RC1/T1OSI/CCP2 16
RC2/CCP1 17
RC3/SCK/SCL 18
RD0/PSP0 19
RD1/PSP1 20
RB7/PGD 40
RB6/PGC 39
RB5 38
RB4 37
RB3/PGM 36
RB2 35
RB1 34
RB0/INT 33
RD7/PSP7 30
RD6/PSP6 29
RD5/PSP5 28
RD4/PSP4 27
RD3/PSP3 22
RD2/PSP2 21
RC7/RX/DT 26
RC6/TX/CK 25
RC5/SDO 24
RC4/SDI/SDA 23 RA3/AN3/VREF+
5
RC0/T1OSO/T1CKI 15
MCLR/Vpp/THV 1
U4
PIC16F877A
TX RX
To 5V DC
RS232 USB TO TTL Converter COMMUNICATION INTERFACE UNIT
Fig. 6.0: Circuit Communication Interface unit
7. Communication Data format between the controller and the SCADA Application
The Controller transmit a 24bit (3 byte) DATA packet to the SCADA Application at every 1 seconds. Each byte in the packet repre-sent the temperature value of a process i.e. the first byte reprerepre-sent the temperature in degrees of the first process.
The SCADA Application receives the 3 byte packet data, parse it and displays it on the Process image in the Application.
The SCADA Application transmit a 3 byte CONTROL Packet to the microcontroller, where each byte represent the control state of the FCE Of the process. Each byte can either be 00H or FFH i.e. OFF FCE or ON FCE respectively.
The communication baud rate between the controller and the SCADA Application is 9600bps.
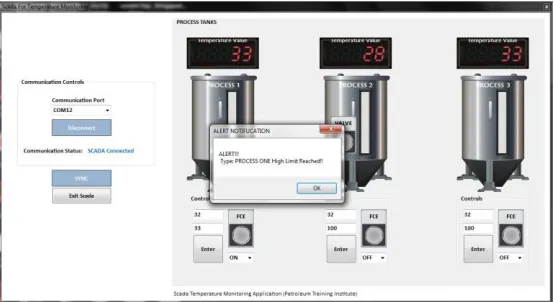
8. SCADA Application
This is a graphical user interface unit of the system. it was designed with Microsoft visual studio 10 using C# Programming lan-guage. The Design carries three reservoirs images, where each reservoir image represent a process. The temperature of the pro-cess, transmitted in by the microcontroller is display in on the Reservoir image of the SCADA Application.
The SCADA Application also has a TEXTBOX AND BUTTON under each reservoir image that is used to input the Temperature SET POINT of the Process. Below is the Pictorial View of the SCADA Application. See Fig 3.11 for SCADA Application interface.
9. Coding
Flow Chart
Fig. 3.9: flow chart
Testing and Result
The completed project as stated in the problem statement was tested to confirm if it could provide solution to the stated problems.
Power – up test
The unit was connected to the public power supply and switched on. Expected result: LCD display should come on.
Back lights should come on LCD.
Fig 4.3: Process Two Level Limit Alert
Conclusion
A successful attempt has been made to design and construct a SCADA based temperature monitoring system for three process using locally available material. The system is capable of enhancing remote monitoring and control over SCADA Applications. The complet-ed work had been testcomplet-ed and workcomplet-ed satisfactory.
A research approach was adopted in the implementation of this system, from whence a workable circuit was designed. The design was done using embedded system technology. This is to reduce component count, keep the system simple and cost effective.
Acknowledgment
This research work was supported by the staff and students of Electrical and Electronic Engineering Department, Petroleum Training
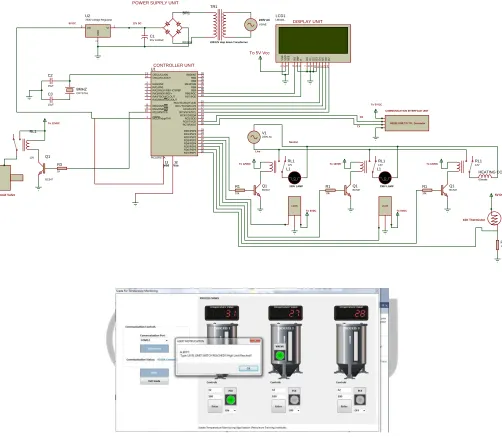
Institute, Effurun. VI 1 VO 3 G N D 2 U2
7805 Voltage Regulator
Vdd Vss 11 12 8MHZ CRYSTAL C2 15uF C3 15uF RA0/AN0 2 RA1/AN1 3 RA2/AN2/VREF-/CVREF 4 RA4/T0CKI/C1OUT 6 RA5/AN4/SS/C2OUT 7 RE0/AN5/RD 8 RE1/AN6/WR 9 RE2/AN7/CS 10 OSC1/CLKIN 13 OSC2/CLKOUT 14 RC1/T1OSI/CCP2 16 RC2/CCP1 17 RC3/SCK/SCL 18 RD0/PSP0 19 RD1/PSP1 20 RB7/PGD 40 RB6/PGCRB5 3938 RB4 37 RB3/PGMRB2 3635 RB1 34 RB0/INT 33 RD7/PSP7 30 RD6/PSP6 29 RD5/PSP5 28 RD4/PSP4 27 RD3/PSP3 22 RD2/PSP2 21 RC7/RX/DT 26 RC6/TX/CKRC5/SDO 2524 RC4/SDI/SDA 23 RA3/AN3/VREF+ 5 RC0/T1OSO/T1CKI 15 MCLR/Vpp/THV 1 U1 PIC16F877A BR1 BRIDGE C1 25V 1000uF TR1
220/12V step down Transformer
To 5V Vcc POWER SUPPLY UNIT
DISPLAY UNIT CONTROLLER UNIT D 7 1 4 D 6 1 3 D 5 1 2 D 4 1 1 D 3 1 0 D 2 9 D 1 8 D 0 7 E 6 R W 5 R S 4 V S S 1 V D D 2 V E E 3 LCD1 LM044L RL1 12V Q1 BC547 R1 10k To 12VDC RL1 12V Q1 BC547 R1 10k LM35 To 12VDC To 5VDC L1 230V LAMP RL1 12V Q1 BC547 R1 10k LM35 To 12VDC To 5VDC L1 230V LAMP 230V AC VSINE 12V DC 5V DC V1 230V AC Neutral Live TX RX
To 5V DC
RS232 USB TO TTL Converter COMMUNICATION INTERFACE UNIT
R2 10k 5V DC 10K Thermistor HEATING COIL 60watts RL1 12V Q1 BC547 To 12VDC R3 1K
References
[1] https://www.sciencedirect.com/topics/computer science/programmable-logic-controller [2] https://www.scribd.com/document/322114103/Programmable-Logic-Controller [3] https://www.youtube.com/watch?v=rh5DfK2JWmA
[4] Anyanwu, Cosmas & Constantine, Mbajiorgu & Anoliefo, Edward. (2012). Design and implementation of a water level controller. Nigerian Journal of Technology. 31. 89-92.
[5] Tharaja B. L, Tharaja A. K. (2001), A Text Book of Electrical Technology, S. Chand & Company Ltd. New Delhi INDIA 22nd Edition, P. 1730 – 1731
[6] Boylestad and Nashelsky (2007). “Electronics Device and Circuit Theory” (Ninth edition) [7] Bernard Grob “Electronics Circuits and Applications” First Edition 2006.
[8] 6. www.alldatasheets.com