Research Article
Determination of trace and heavy metals
in drinking water of Jhal Magsi district of
Balochistan, Pakistan
Safia Mustafa
1, Nizam Baloch
1, Shafi Muhammad
2*, Yasmeen Malik
3,
Tamoor Khan
4, Murad Bibi
5, Abdul Qadir
6, Ghulam Razaque
6and
Iftikhar Ahmed Baloch
71. Department of Chemistry, University of Balochistan, Quetta-Pakistan
2. Department of Pharmacognosy, Faculty of Pharmacy and Health Sciences, University of Balochistan, Quetta-Pakistan
3. Department of Zoology, University of Balochistan, Quetta-Pakistan
4. Faculty of Agriculture Lasbela University of Agriculture, Water and Marine Sciences, Lasbela-Pakistan
5. Department Pharmacology, Faculty of Pharmacy and Health Sciences, University of Balochistan, Quetta-Pakistan 6. Department of Pharmaceutics, Faculty of Pharmacy and Health Sciences, University of Balochistan, Quetta-Pakistan
7. Department of Botany, University of Balochistan, Quetta-Pakistan
*Corresponding author’s email: [email protected] Citation
Safia Mustafa, Nizam Baloch, Shafi Muhammad, Yasmeen Malik, Tamoor Khan, Murad Bibi, Abdul Qadir, Ghulam Razaque, Iftikhar Ahmed Baloch. Determination of trace and heavy metals in drinking water of Jhal Magsi
district of Balochistan, Pakistan. Pure and Applied Biology. Vol. 6, Issue 1, pp9-17.
http://dx.doi.org/10.19045/bspab.2016.50161
Received: 08/10/2016 Revised: 06/12/2016 Accepted: 12/12/2016 Online First: 19/12/2016
Abstract
Water is essential component of life. Pure drinking water is a necessity for humans. Balochistan is the largest province of Pakistan. In Balochistan river and well water is mainly used for drinking and agriculture purposes. Current study was carried out to determine the concentration of trace and heavy metals in river (surface) and well water of Jhal Magsi district of Balochistan. Ten (10) samples were collected from each, river (surface) and well water. Physicochemical parameters (PH, Electrical conductivity, Total dissolved solids, Dissolved Oxygen, Turbidity and Color) were determined. Determination of trace and heavy metals i.e. Zinc (Zn), Iron (Fe), Manganese (Mn), Copper (Cu), Cadmium (Cd), Lead (Pb), Chromium (Cr) and Nickel (Ni) were carried out using Atomic absorption Spectrophotometer. Except 3 samples (RW3, RW5 and WW6), the physicochemicalparameters were within the world health organization (WHO) and environmental protection agency Pakistan (EPA) limits. Concentration of Zn, Fe, Mn and Cu were below the WHO and EPA limits. Concentration of Pb and Cd were higher than the standards set by WHO and EPA. Cr and Ni were not detected in any samples. Current study is the first study carried out to determine the concentration of trace and heavy metals in drinking water of Jhal Magsi district of Balochistan.
Keywords: Heavy metals;Physiochemical parameters; Jhal Magsi; River water; Ground water
Introduction
Water is the most essential element for living organisms and it supports the life
area of study worldwide because of its direct implications on the aquatic life and the human beings [2]. The pollution of surface water by heavy metals is a serious environmental problem. They are non-degradable and can accumulate through food chain. Though some metals like Fe, Cu and Zn are essential micronutrients, they can be harmful to the physiology of the living organisms at higher concentrations [3-5]. Balochistan is the largest province of Pakistan [6] and around 54% area under is surface water irrigation and the remaining 46% is under groundwater irrigation [7]. People in Jhal Magsi district of Balochistan mostly rely on agriculture. Where the major sources of water are rivers, streams and tube wells. Therefore, people live mostly near the flowing rivers and streams to get water for their drinking and for irrigation of land. Some areas of the Jhal Magsi are also irrigated with flood water [8].
Rivers and streams are polluted due to the impurities coming mostly from industries and mixing up with sewerage discharge. These impurities may flow into the lakes or
water reservoirs which store water for
drinking [9]. Among the inorganic
contaminants of the river water, heavy metals are getting importance for their non-degradable nature and often accumulate through tropic level causing a deleterious biological effect [3]. In this regard current research work was carried out to determine concentration of different trace and heavy metals in water samples of Jhal Magsi district used by the people for drinking and agriculture purpose. Current study is first report on determination of trace and heavy metals in drinking and agriculture water of Jhal Magsi, Balochistan.
Material and methods Study area
The present study was undertaken in different areas of district Jhal Magsi. Water samples were collected from different areas of Jhal Magsi district (Table 1). To avoid possibility of contamination the polythene bottles (Jiangyin Huangma china) were used for the collection of water samples and were labeled accurately.
Table 1. Name of sampling area with their symbols
Symbols Area of surface water Symbols Area of well water
RW1 Pir Chattal WW1 Goth Mousa khal
RW2 Shoran WW2 Ghala lower region
RW3 Mula WW3 Patri
RW4 Gandawah WW4 Ghala upper region
RW5 Kahri WW5 Goth dandoo
RW6 Gajan WW6 Kotroh
RW7 Sukleji, WW7 Kohnara
RW8 Badrah WW8 kohri
RW9 Kotra Khari WW9 Jaht
RW10 Fatihpur WW10 Bazdana
Sampling
Samples of water were collected from different sampling Sites (Table 1) in bottles and transported to the Department of Chemistry, University of Balochistan.
Physiochemical parameters of water samples
Physiochemical parameters of water samples
were carried out by method described by Joshi et al. [10]. These parameters include:
PH
PH was detected by using PH meter (JANWAY 3305 UK).
Electrical conductivity (EC)
This test was done on TDS meter (HACH COISO USA).
Dissolved oxygen (DO)
DO2 meter (JANWAY 9500 UK) was used
for detection of dissolved oxygen.
Turbidity
Turbidity was detected by using laboratory turbidity meter (HACH 2100p USA).
Color
Color is a qualitative characteristic of waste water. Color was detected by using
laboratory turbidmeter (HACH 2100p
USA).
Sample preparation for heavy metal analysis
Sample preparation
Samples of water were brought in laboratory and the process of digestion was carried out. The digestion was performed by addition of ten (10) ml sample into the five (05) ml of concentrated HCl and five (05) ml of
concentrated HNO3. The solution was
twirled gradually, then covered with help of watch glass, allowed for 1 hour at room temperature. The solution was heated by the help of hot plate, fumes of yellow color were released and the samples were turn out to be clear. The acidic solution after cooling was filtered by filter paper (Millipore filter 0.4µ) and then deionized water was added to make the volume 100 ml [11].
Standard preparation
Different prepared standards (1000 ppm) of each metals (Fisher Chemicals, U.K.) were
diluted with deionized water. The
compounds used for analytical
determination were ultra-pure [12].
Analysis
Atomic Absorption Spectrometer (Perkin- Analyst 800 JAPAN) was used for analysis of Zinc (Zn), Iron (Fe), Manganese (Mn), Copper (Cu), Cadmium (Cd), Lead (Pb), Chromium (Cr) and Nickel (Ni) [13-15].
Results
Physiochemical parameters River (surface) water
In all samples the pH ranged from 7.31 to 7.81, TDS value ranged from 207 to 380 mg/L, Turbidity values ranged from 0.281 to 1.942 (NTU), Color values were in the range from 19.23 to 21.8 (TCU), EC values were in the range of 464 to 990 µS/cm, results were within the WHO and EPA standard limits. DO values were ranged from 2.8 to 4.4 mg/L. EC values of RW5 (1827 µS/cm) and DO values of RW3 (5.6 mg/L) and RW 5 (5.1 mg/L). The standard value of WHO for EC is 1000, DO value of Who and EPA is 5, so these values were above the WHO and EPA limits, the values of other physio-chemical parameters satisfied the WHO and EPA standard values (Table 2).
Table 2. Physico-chemical parameters river water (surface water)
S.no Samples PH EC µS/cm DO mg/l TDS mg/l Turbidity NTU Colour TCU
EPA 6.5-8.5 - 5 <1000 <5 5-50
WHO 6.5-8.5 1000 5 <1000 <5 5-25
1 RW1 7.31 634 3.6 290 1.338 20.77
2 RW2 7.36 579 4.4 254 1.659 21.02
3 RW3 7.65 801 5.6 368 1.449 19.67
4 RW4 7.64 464 2.9 207 1.942 44.23
5 RW5 7.80 1827 5.1 317 0.580 19.32
6 RW6 7.72 708 3.5 340 0.281 20.11
7 RW7 7.69 650 3.5 279 1.506 21.71
8 RW8 7.81 732 4.3 320 1.473 21.8
9 RW9 7.45 843 3.8 380 0.310 20.23
10 RW10 7.75 990 2.8 284 0.289 20.9
Well water
The pH values were ranged from 8.01 to 8.44 which were within the recommended limits of WHO, except WW1 (8.52), WW2 (8.61) and WW 3 (8.58) were greater than the standard limits of WHO and EPA. The EC values were in the range of 466 to 917 µS/cm. EC value of WW4 (1013) and WW6 (1774) were greater than the limits. DO
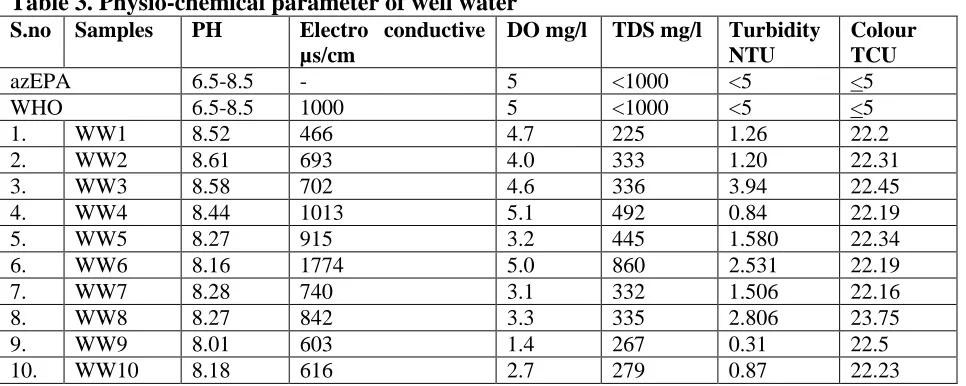
values were in the range of 1.4 mg/L to 5 mg/L and value of WW 4 (5.1 mg/L) were greater than the limits. TDS values were ranged from 225mg/L to 860 mg/L. Turbidity values were in the range from 0.31 to 2.806 NTU. Color values were in the range from 22.2 to 23.75 TCU, the values obtained were within the WHO and EPA standard limits (Table 3).
Table 3. Physio-chemical parameter of well water
S.no Samples PH Electro conductive
µs/cm
DO mg/l TDS mg/l Turbidity
NTU
Colour TCU
azEPA 6.5-8.5 - 5 <1000 <5 <5
WHO 6.5-8.5 1000 5 <1000 <5 <5
1. WW1 8.52 466 4.7 225 1.26 22.2
2. WW2 8.61 693 4.0 333 1.20 22.31
3. WW3 8.58 702 4.6 336 3.94 22.45
4. WW4 8.44 1013 5.1 492 0.84 22.19
5. WW5 8.27 915 3.2 445 1.580 22.34
6. WW6 8.16 1774 5.0 860 2.531 22.19
7. WW7 8.28 740 3.1 332 1.506 22.16
8. WW8 8.27 842 3.3 335 2.806 23.75
9. WW9 8.01 603 1.4 267 0.31 22.5
10. WW10 8.18 616 2.7 279 0.87 22.23
EC= Electro conductivity, DO Dissolved oxygen, TDS Total dissolved solids
Concentration of heavy and trace metals River water (surface)
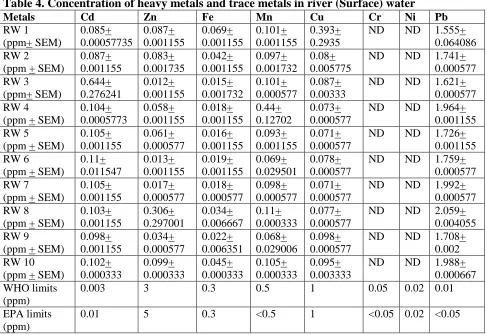
The concentrations of trace elements i.e. Zn was in range from 0.012 + 0.001155 to 0.099 + 0.000333 ppm. Fe concentration was in the range from 0.018 + 0.001155 to 0.069 + 0.001155 ppm. Mn concentration was in the range from 0.068 + 0.029006 to 0.44 + 0.12702 ppm. Cu concentration was in the range from 0.071 + 0.000577 to 0.393 + 0.2935 ppm. The result showed that all the
trace metals in river (surface) water were below permissible limits set by WHO [16]
Table 4. Concentration of heavy metals and trace metals in river (Surface) water
Metals Cd Zn Fe Mn Cu Cr Ni Pb
RW 1 (ppm+ SEM) 0.085+ 0.00057735 0.087+ 0.001155 0.069+ 0.001155 0.101+ 0.001155 0.393+ 0.2935
ND ND 1.555+
0.064086 RW 2
(ppm + SEM)
0.087+ 0.001155 0.083+ 0.001735 0.042+ 0.001155 0.097+ 0.001732 0.08+ 0.005775
ND ND 1.741+
0.000577 RW 3 (ppm+ SEM) 0.644+ 0.276241 0.012+ 0.001155 0.015+ 0.001732 0.101+ 0.000577 0.087+ 0.00333
ND ND 1.621+
0.000577 RW 4
(ppm + SEM)
0.104+ 0.0005773 0.058+ 0.001155 0.018+ 0.001155 0.44+ 0.12702 0.073+ 0.000577
ND ND 1.964+
0.001155 RW 5
(ppm + SEM)
0.105+ 0.001155 0.061+ 0.000577 0.016+ 0.001155 0.093+ 0.001155 0.071+ 0.000577
ND ND 1.726+
0.001155 RW 6
(ppm + SEM)
0.11+ 0.011547 0.013+ 0.001155 0.019+ 0.001155 0.069+ 0.029501 0.078+ 0.000577
ND ND 1.759+
0.000577 RW 7
(ppm + SEM)
0.105+ 0.001155 0.017+ 0.000577 0.018+ 0.000577 0.098+ 0.000577 0.071+ 0.000577
ND ND 1.992+
0.000577 RW 8
(ppm + SEM)
0.103+ 0.001155 0.306+ 0.297001 0.034+ 0.006667 0.11+ 0.000333 0.077+ 0.000577
ND ND 2.059+
0.004055 RW 9
(ppm + SEM)
0.098+ 0.001155 0.034+ 0.000577 0.022+ 0.006351 0.068+ 0.029006 0.098+ 0.000577
ND ND 1.708+
0.002 RW 10
(ppm + SEM)
0.102+ 0.000333 0.099+ 0.000333 0.045+ 0.000333 0.105+ 0.000333 0.095+ 0.003333
ND ND 1.988+
0.000667 WHO limits
(ppm)
0.003 3 0.3 0.5 1 0.05 0.02 0.01
EPA limits (ppm)
0.01 5 0.3 <0.5 1 <0.05 0.02 <0.05
Values are Mean + SEM of the concentration of heavy metals in river water
Well water
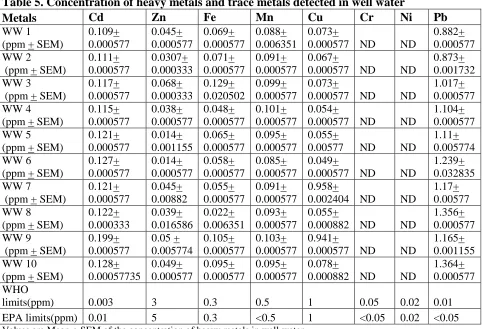
Concentration of trace elements i.e. Zn ranged from 0.014 + 0.001155 to 0.068 + 0.000333 ppm. Fe concentration was in the range from 0.022 + 0.006351 to 0.129 + 0.020502 ppm. Mn concentration was in the range from 0.085 + 0.000577 to 0.101 + 0.000577 ppm. Cu concentration was in the range from 0.049 + 0.000577 to 0.078 + 0.000882 ppm. The result showed that all these trace metals in well water were below the permissible limits set by WHO [16] and
EPA [17]. The concentration of Cu in WW7
Table 5. Concentration of heavy metals and trace metals detected in well water
Metals Cd Zn Fe Mn Cu Cr Ni Pb
WW 1 (ppm + SEM)
0.109+ 0.000577 0.045+ 0.000577 0.069+ 0.000577 0.088+ 0.006351 0.073+
0.000577 ND ND
0.882+ 0.000577 WW 2
(ppm + SEM)
0.111+ 0.000577 0.0307+ 0.000333 0.071+ 0.000577 0.091+ 0.000577 0.067+
0.000577 ND ND
0.873+ 0.001732 WW 3
(ppm + SEM)
0.117+ 0.000577 0.068+ 0.000333 0.129+ 0.020502 0.099+ 0.000577 0.073+
0.000577 ND ND
1.017+ 0.000577 WW 4
(ppm + SEM)
0.115+ 0.000577 0.038+ 0.000577 0.048+ 0.000577 0.101+ 0.000577 0.054+
0.000577 ND ND
1.104+ 0.000577 WW 5
(ppm + SEM)
0.121+ 0.000577 0.014+ 0.001155 0.065+ 0.000577 0.095+ 0.000577 0.055+
0.00577 ND ND
1.11+ 0.005774 WW 6
(ppm + SEM)
0.127+ 0.000577 0.014+ 0.000577 0.058+ 0.000577 0.085+ 0.000577 0.049+
0.000577 ND ND
1.239+ 0.032835 WW 7
(ppm + SEM)
0.121+ 0.000577 0.045+ 0.00882 0.055+ 0.000577 0.091+ 0.000577 0.958+
0.002404 ND ND
1.17+ 0.00577 WW 8
(ppm + SEM)
0.122+ 0.000333 0.039+ 0.016586 0.022+ 0.006351 0.093+ 0.000577 0.055+
0.000882 ND ND
1.356+ 0.000577 WW 9
(ppm + SEM)
0.199+ 0.000577 0.05 + 0.005774 0.105+ 0.000577 0.103+ 0.000577 0.941+
0.000577 ND ND
1.165+ 0.001155 WW 10
(ppm + SEM)
0.128+ 0.00057735 0.049+ 0.000577 0.095+ 0.000577 0.095+ 0.000577 0.078+
0.000882 ND ND
1.364+ 0.000577 WHO
limits(ppm) 0.003 3 0.3 0.5 1 0.05 0.02 0.01
EPA limits(ppm) 0.01 5 0.3 <0.5 1 <0.05 0.02 <0.05
Values are Mean + SEM of the concentration of heavy metals in well water
Disscusion
In current study the water samples were selected from district Jhal Magsi , Balochistan, as previously no data was available on the subject. People in this area only rely on River and Well water for drinking and agriculture purpose. Twenty (20) samples were collected (10 from river water and 10 from Well water) from different sites. Six metals (Zn, Fe, Mn, Cu, Cd and Pb) were found in all water samples analyzed. Ni and Cr were not detected in any samples. Mean concentrations of lead and cadmium in all the samples were significantly greater than Permissible limits of WHO and EPA.
Concentration of Zn was below the permissible limits of WHO and EPA. Zinc is an important trace metal found in living organisms. The significance of zinc for the
Zinc plays a significant role in the synthesis of protein. Low concentration of Zn may result in increased secretion, genetic
disorders, nutritional deficiency, and
reduced absorption [19]. Zn deficiency also causes diminishing of reproduction and growth [20].
Concentration of Fe was also below the permissible limits set by WHO and EPA. Fe is a vital element in human diet. Estimates of the minimum daily requirement for Fe depend on sex, physiological status, age, Fe bioavailability and it ranges from about 10 -
50 mg/day [21]. The continued consumption
of drinking water with great concentration of Fe may lead to a liver disease called haermosiderosis and the lack of Fe causes a disease called anemia [22].
growth inhibition, blood circulation
difficulties and anemia [23]. Cu is
important substance for human life, but prolonged exposure to pollutant drinking water with Cu can result in anemia, kidney and liver disease [24, 25].
Mn is also an important component of some enzymes that are required for the fat, protein and carbohydrate metabolism. For some animals, the lethal dosage is relatively low. Mn complexes can cause failure in development of animal fetuses, brain damage, vascular disturbances, declines in blood pressure, and liver and lung disease
[26]. Results of current study reveal that the trace elements in drinking (River and Well) water were below the permissible limits. Use of these waters may lead to disorders
due to deficiency of trace metals.
Government and other organizations are required to make measures and provide drinking water with sufficient amount of trace metals to prevent the diseases.
Lead and Cadmium concentration were above the permissible limits of WHO and EPA. Chronic contact to heavy metals such as Cd and Pb can result in lethal health hazards in human beings [27]. These heavy metals have very long biotic half-lives, which shows their ability to accumulate in
different organs of the body and
consequently results in irritating side effects
[28-30].
There are some other studies which link Pb exposures even at small quantity with an increase in blood pressure [31] as well as with reduction in the intelligence of children
[32] and with responsiveness disorders [33].
Cadmium and its complexes are
carcinogenic for human health and are classified as 1st group by International Agency for Research on Cancer, as their positive associations have been observed for cancers of the kidney and of the prostate and cause cancer of the lungs [34]. Cadmium intoxication can also play a central role for
pulmonary and kidney damages, and skeletal muscle damage [35, 36]. Cd is extremely toxic and responsible for numerous types of food toxicities. Lesser amount of cadmium can cause adverse changes in the blood vessels of human kidney. Cd have the ability to replace zinc biochemically and causes kidney damage and increase in the blood pressures [22].
Cadmium (Cd) is an element of great concern from the point of toxicity and its introduction can cause both acute and chronic health diseases in living creatures. Cadmium occurs naturally in ocean water and in the earth’s layer. Cd impedes with enzymes and causes a painful disease called Itai-itai [35]. In current study concentration of Pb and Cd were above the permissible limits, it may results in sever health problems. Therefore it is suggested that water should pretreated, and purification plants must be utilized to save the life of the people.
Conclusion
It is concluded that the trace metals were below the permissible limits, whereas heavy metals i.e. Pb and Cd were above the standard limits of WHO and EPA. Therefore, the use of polluted water with these metals may result in sever health problems.
Authors’ contributions
Conceived and designed the experiments: S Mustafa & N Baloch, Performed the experiments: S Mustafa & S Muhammad, Analyzed the data: Y Malik, T Khan & M
Bibi, Contributed reagents/ materials/
analysis tools: A Qadir & G Razaque, Wrote the paper: S Mustafa & I A Baloch.
References
2.Ezemonye LIN & Enuneku A (2005). Evaluationof acute toxicity of Cadmium and Lead to Amphibian Tadpole (Toad:
Bufomaculates and Frog:
Ptychadenabibroni). J Aqua Sci 20(1): 33 – 36
3.Kar D, Sur P, Mandal SK, Saha T & Kole RK (2008). Assessment of heavy metal pollution insurface water. Int J Environ Sci Tech 5(1):119-124.
4.Nair IV, Singh K, Arumugam M, Gangadhar K & Clarson D (2010). Trace metal quality of Meenachil River at Kottayam, Kerala (India) by principal component analysis. World Appl Sci J 9(10): 1100-1107.
5.Bilal S & Rahman S (2015).
Determination of Some Heavy Metals in Water Collected From River Chublat (Hassan Abdal) Pakistan. Int J Sci Res 4(2): 1894-1897.
6.Ahmad M, Muhammed S, Mehjabeen, Jahan N, Jan SU & Qureshi ZU (2014).
Anti-dermatitis, anxiolytic and
analgesic effects of Rhazya stricta from Balochistan. Pak J Pharm Sci 27(3): 481-486
7.Ahmad S (2007). Restructuring national agricultural research system (NARS)– the case of NARS Balochistan (NARS-B). Water for Balochistan: Policy Briefings 3(7).
8.UNICEF, District Development profile
(2011). Jhal Magsi Planning &
Development Department, Government of Balochistan in Collaboration with UNICEF page 1-25.
9.Musharafi SK, Mahmoud IY &
Al-Bahry SN (2014). Environmental
contamination by industrial effluents and sludge relative to heavy metals. J Geosci Environ Prot 2(02): 14.
10.Joshi DM, Kumar A & Agrawal N
(2009). Studies on physicochemical parameters to assess the water quality of river Ganga for drinking purpose in
Haridwar district. Ras J Chem 2: 195-203.
11.Fong SS, Kanakaraju D & Ling SC
(2006). Evaluation of the acid
digestion method with different
solvent combination for the
determination of Iron, Zinc and Lead in canned sardines. Malayan J Chem 8 (1): 10 – 15.
12.Adnan MM (2003). Determination of
Cadmium and Lead in different cigarette brands in Jordan. Environ Monit Assess 104: 163-170.
13.Alzrog AM, Mohamed AS, Zakaria RB
& Alias AK (2013). Effect of planting media (rice husk and coco peat) on the
uptake of cadmium and some
micronutrients in chilli (capsicum annum l.). Pure Appl Bio 2(3):76. 14.Khan MJ, Achakzai AK, Iqbal Y, Ullah
W, Khan N, Sharif M, Afzal M, Bazai ZA & Ullah F (2015). Heavy metals status of the urban and agricultural soils of Peshawar, Pakistan. Pure Appl Bio 4(3):418.
15.Sultana S, Sultana T & Jabeen F (2015) Accumulation of heavy metals (Cu, Zn, Ni, Cd, Co, Pb and Cr) in blood of
freshwater turtles from Balloki
headworks and Trimmu barrage,
Punjab, Pakistan. Pure Appl Bio 4(3): 280.
16.World Health Organization (WHO)
(2011). Guidelines for Drinking-Water
Quality, WHO Press, Geneva,
Switzerland, 4th edition.
17.Pak- EPA (2007) Ambient Air and
Water Quality Investigation in Quetta.
Available at.
http://www.environment.gov.pk
18.Khan TA (2011). Trace elements in the drinking water and their possible health effects in Aligarh City India. J Water Reso Prot 3(7): 522.
content of various herbal and fruit teas
produced and marketed in
Turkey. Trace Elements &
Electrolytes 22(3).
20.Rattan RK, Datta SP, Chhonkar PK,
Suribabu K & Singh AK (2005). Long-term impact of irrigation with sewage effluents on heavy metal content in soils, crops and groundwater—a case study. Agri Ecos Environ 109(3): 310-322.
21.World Health Organization. Guidelines
for drinking-water quality:
recommendations. Vol. 1. World Health Organization, 2004.
22.Rajappa B, Manjappa S & Puttaiah ET (2010). Monitoring of heavy metal
concentration in groundwater of
Hakinaka Taluk. India Cont Engn Sci 3(4): 183-190.
23.Jennings G D Sneed RE & Clair MB (1996). Metals in drinking water. Nor Carolina Coop Extens Ser AG-473-1. 24.Madsen H, Poulsen L & Grandjean P
(1990). Risk of high copper content in
drinking water. Ugeskrift for
laeger 152(25): 1806-1809.
25.Bent S & Böhm K (1995). Copper-induced liver cirrhosis in a 13-month
old boy. Gesundheitswesen
(Bundesverband der Arzte des
Offentlichen Gesundheitsdienstes
(Germany) 57(10): 667-669.
26.Stokinger HE (1981). The
metals. Patty's industrial hygie. Toxico 2: 1749-1769.
27.O'Reilly CA, Chatman J & Caldwell DF (1991). People and organizational
culture: A profile comparison
approach to assessing
person-organization fit. Aca Manag J 34(3): 487-516.
28.Järup L (2003). Hazards of heavy metal
contamination. Br Med Bull 68(1):
167-182.
29.Sathawara NG, Parikh DJ & Agarwal, YK (2004). Essential heavy metals in environmental samples from western
India. Bull Environ Contam
Toxicol 73(4): 756-761.
30.Yavuz B, Ertugrul DT, Cil H, Ata N, Akin KO, Yalcin AA & Tutal E
(2009). Increased levels of 25
hydroxyvitamin D and 1,
25-dihydroxyvitamin D after rosuvastatin treatment: a novel pleiotropic effect of
statins? Cardiovascular drugs and
therapy 23(4): 295-299.
31.Zietz BP, Lap J & Suchenwirth R (2007). Assessment and management of tap water Lead contamination in Lower Saxon, Germany. Int J Environ Health Res 17(6): 407-418.
32.Needleman HL (1992). The current
status of childhood low-level lead toxicity. Neurotoxicology 14(2-3): 161-166.
33.Yule W & Rutter M (1985). Effect of lead on children's behavior and
cognitive performance: a critical
review. Diet Environ lead human health effects 2.
34.Godt J, Scheidig F, Grosse-Siestrup C, Esche V, Brandenburg P, Reich A & Groneberg DA (2006). The toxicity of cadmium and resulting hazards for human health. J occupational med toxi 1(1): 1.
35.Waseem A, Arshad J, Iqbal F, Sajjad A,
Mehmood Z & Murtaza G (2014).
Pollution status of Pakistan: a
retrospective review on heavy metal contamination of water, soil, and vegetables. Bio Med res int 2014. 36.Nordberg G, Jin T, Bernard A, Fierens
S, Buchet JP, Ye T & Wang H (2002).
Low bone density and renal