© Global Society of Scientific Research and Researchers http://ijcjournal.org/
System Simulation of a Bayesian Network-Based
Performance Prediction Model for Data Communication
Networks
Akinyemi B.O
a*, Oyebade A I.
b, Amoo A.O
c, Oyegoke T.O.
d, Aladesanmi T.A
eAderounmu G. A.
fa,b,c,d,e,fDepartment of Computer Science, Obafemi Awolowo University, Ile-Ife, Osun State Nigeria
aEmail: [email protected]
bEmail: [email protected]
cEmail: [email protected]
dEmail: [email protected]
eEmail: [email protected],
f
Email: [email protected]
Abstract
In this paper, a paradigm of a Bayesian Network–based performance prediction model for computer networks
security risk management was emulated. Model simulation was carried out for the prediction model formulated.
Java programming language tools were used to simulate, validate and verify the model. The core of simulation
program was written in Java programming language. Some jar files were created in the code logic for all the
modules in the prediction model. MS-DOS or command prompt was used to compile and run java and jar files.
Batch scripts i.e. .bat files were written to compile the jar files. The output of the execution is shown using Java
API files. Simulation technology was used in this study to evaluate network performance since it is very costly
to deploy a complete test bed containing multiple networked computers, routers and data links to validate and
verify the prediction model. The resulting risk impact on network confidentiality, Integrity and availability
determine the criticality of the overall network performance which will aid in the effective application of
countermeasures to mitigate the effect of network security risks.
Keywords: Computer Networks; Risk Management; Bayesian Network.
---
1.Introduction
Generally, a large network cannot be put together and managed by human effort alone. The growing
complexities of computer networks require the use of effective network management techniques [1,2]. With the
explosion of the Internet and e-commerce, private computers, and computer networks, if not adequately secured,
are increasingly vulnerable to damaging attacks. Hackers, viruses, vindictive employees and even human error
all represent clear and present dangers to networks. Risk can be managed or reduced when managers are aware
of the full range of controls available and implement the most effective controls [3]. These controls include a
diverse set of products, services, processes, and policies ranging from complex mathematical encryption
algorithms to human resource management and federal legislation.
The existing security solutions are very complex and costly. What is rapidly needed is a flexible, adaptable and
affordable security solution that would provide greater autonomy. The management of security risk of a network
is, therefore, a necessity requirement for effective and efficient performances of the network. Hence, there is a
need for tools to enable early detection of network security risk problems which in turn should quickly alert the
network administrator of any problem area [4].
Managing security risk has become more about quantity than quality [5]. However, it is noted that there is a
need to ameliorate the state of the art of network security risk management, in order to ascertain good estimators
of network security risk and to minimize reliance on the human element in measurement and inherent
subjectivity. This will offer a more systematic and speedy means to obtain meaningful measurements and allow
for understanding and more insight into the composition of network security mechanisms
The motivation for this study is based on the reality that a computer network system environment must be
self-protected. It should provide the right information to the right users at the right time through actions that grant
access based on the user's role and predefined privileges. In lieu of this, Reference [4] proposed an adaptive
decision-support model for data communication network security risk management. The model aimed to
predetermine the effect of network security risk factors on network Confidentiality, Integrity, and Availability.
This will enable early detection of network security risk problems which in turn should quickly alert the network
administrator of any problem area in the network environment and make the effective decision for quality of
services.
In furtherance, Reference [6] established the model with a level of detail sufficient to enable realistic predictions
of operational network behavior and portray security measurements accurately. Meanwhile, there is a need to
study the behavior of the proposed prediction model. Implementing a real-life system can be very expensive
most times with regards to financial and human resources involved, and sometimes it may be very difficult to
achieve.
In this paper, an attempt was made to simulate the results of the proposed prediction model. Since, simulation
technology has been known to be a very powerful and versatile instrument for evaluating network performance,
links to validate and verify a certain network protocol or a specific network algorithm. In this study, simulation
involves the use of executable computer programs to demonstrate emergent system behavior of the proposed
prediction model.
2.Related Works
There has been quite a good amount of work towards dealing with network security threats and vulnerabilities
both qualitatively and quantitatively. The qualitative approach has been to explore network systems’ threats and
vulnerabilities by proposing a framework for security risk assessment [7,8,9,10,11]. The authors developed a
qualitative framework for security risk and vulnerabilities assessment by adding new components to the
processes of the existing framework. Several quantitative approaches had been explored ranging from the
ontology-based model [12], probabilistic and decision analytic approaches [13], attack graphs [14,15], game
theory [16,17] and several others quantitative approaches.
Moreover, the application of Artificial Intelligence (AI) tools to risk management have also been utilized by
some authors. Reference [18] presented a prediction model of network security situation based on Regression
Analysis. Linear regression was proposed as a method for network security situation evaluation. The study
shows that the Regression Analysis complexity rate is low and less time-consuming. The regression prediction
model reflects the physical network's security situation in a certain range of threshold value. The weakness of
this method is that it can only work on a small dataset and lack scalability.
Also, Reference [19] presented a study that deals with uncertainty in software project management. The authors
make use of a combination of Bayesian Network and knowledge engineering method of Artificial Intelligence to
analyze risk. The outcome of the study affirmed that one approach of risk assessment is the application of the
Bayesian framework.
Reference [20] applied a Bayesian Network approach to traffic flow forecasting, specifically in the management
of Urban Traffic Control Systems (UTCSs) and freeway systems. The authors presented a new approach based
on Bayesian networks to predict the traffic flow of the object link, even in the case of incomplete data. It was
shown that a Bayesian Network can be used to predict future events even where there is no historical data.
Reference [21] also applied Bayesian Network in managing ecological assets. The author worked on
parameterization and evaluation of a Bayesian Network for use in an ecological risk assessment. The work is
based on combining expert and data-based estimations. It was shown that the Bayesian Network can combine
both subjective and objective data. In cyber situation, Bayesian Networks has been used for cyber security
analysis in order to capture the uncertain aspects of cyber security [22,23]. The presented work shows that
Bayesian Network is a modeling approach that correctly captures uncertainties. There are different concepts of
the Bayesian network that has been employed to manage network security risk. Reference [24] presented a
causal assessment model based on Bayesian Belief Networks to analyze and quantify information security risks
caused by various threat sources. The result showed that Bayesian networks are a practical tool both for
graphically defining the relationships among a set of security variables and for determining the inference of
Reference [25] also addressed the problem of security risk assessment and mitigation by proposing a dynamic
security risk management using Bayesian Attack Graphs (BAG). The Bayesian Attack Graphs (BAGs) is used
to model vulnerability exploitations in a test network. It was shown that the attack graphs-based risk
management framework using Bayesian networks enables a system administrator to quantify the chances of
network compromise at various levels and also help in risk mitigation procedure by identifying the most critical
and probable attack path in the network. Conversely, the attack graphs can get complex as the network attacks
sequences increases i.e. lack of scalability. It is also a scenario-based approach.
Recently, Reference [4] discovered that the challenges for the network managers in providing information about
network security are formidable. It was noted that 100% network security risk-free guarantees are often
unattainable, so there is always an element of risk associated with network security. The dearth of formal
network security risk management models and other formalisms needed to improve the relevance of security
schemes to network systems have hindered advancement in the automation of security management. it was
discovered that there is a need to have a formal model that would depict security properties of the network
system and incorporate relevant objects of significance to the system security risk measurement would be a
useful contribution.
An attempt was made to develop a predictive performance model for managing security risks in a Data
Communication Network that will monitor and report the security status of a network [4,6]. The authors
presented the architecture, description and mathematical modeling of the proposed network performances
prediction model. The proposed model utilized the probability characteristics of Artificial Intelligence method
known as Bayesian Network to address the challenges being faced by network administrators in using objective
metrics to measure their network security and justify the performance of their network, rather than relying on
their instinct or experience. The BN prediction model was built using information obtained from experts'
knowledge elicitation. Bayesian probability updating ensures that the model is not static, but quickly adapts to
new input and incorporates it with prior expert opinion in a mathematically tractable manner. The BN model has
been shown to be easily adaptable to incorporate new input.
In this paper, a paradigm of the Bayesian Network–based performance prediction model for computer networks
security risk management based on [4,6] will be simulated using a selected network as a test bed to demonstrate
the behavior of the proposed model.
3.Simulation Process
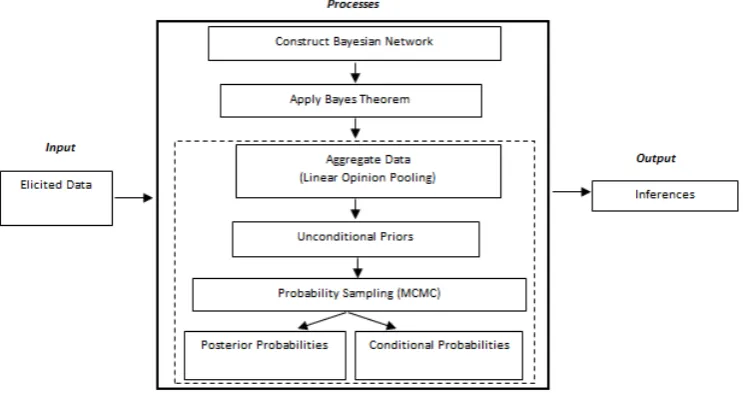
The simulation process is as shown in Figure 1. The simulation program accepts input, processes it and gives an
output. The inputs are the elicited data on the likelihood of occurrence of security risks from the storage engine.
These data are then processed based on the underlying computations and the results are presented in form of bar
charts indicating the inferences. In order to learn a Bayesian Network, there is a need to have an adequate
database to find the structure and the parameters. In this study, the relational database system employed as the
4.Bayesian Structure Constructions
During the simulation process, the building of the network structure is an iterative process with the following
requirements:
• The process started with a simple network, which was iterated by the addition and deletion of nodes
continuously until an acceptable network was obtained.
• The process was carried out with the network experts to ensure the network is kept as simple as possible.
A very detailed network will necessitate several probabilities for quantification and maintenance,
making it practically expensive.
• The number of probabilities increased exponentially with the number of parents. Parents were divorce
where necessary, to make subsequent elicitation of conditional probabilities less difficult.
Figure 1: Simulation process
The structure or topology of the network captured the relationships between variables by either:
• Qualitatively: choosing the variables of interest i.e. uncertain variables and latent variables. Uncertain
variables are the observable data while latent variables include any information that is unobservable but
is relevant to explain the observable data.
• Quantitatively: defining the structure of the model via causal dependencies
4.1.Setting up the qualitative part of the BN
was available. Therefore, explicit knowledge modelling is central to this study. The elicited domain knowledge
was represented in a cognitive structure, consisting of the relationships between network security risks, causes
(causal factors) and effects in [4]. Based on this conceptual model given, the qualitative part of the BN structure
was defined. During the simulation, the cause-effect model was transformed into a graphical structure for the
qualitative part of the Bayesian Network, by performing the following sequence of steps:
• The concepts were translated into mutually exclusive and collectively exhaustive variables or variable
types that have a finite set of discrete values.
• Being causal relations, the directed links arcs in the depiction that represent the various sources of
information was translated directly into arcs of the graphical structure in order to create a directed
graph.
• In the graphical model, certain local statistical dependencies between the random variables that
correspond to the latent variables and observed data were posited based on directional relationships.
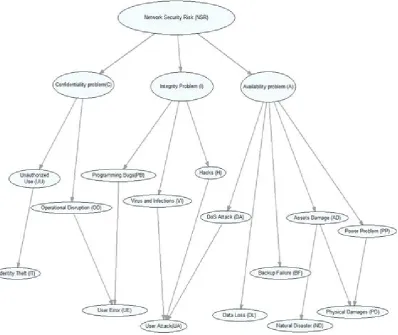
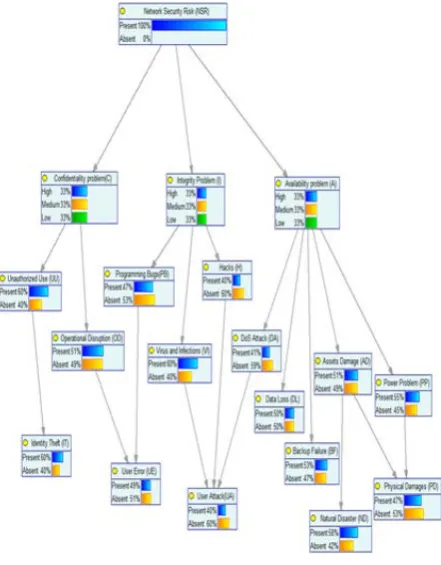
In the qualitative part of the BN shown in Figure 2, the nodes represent uncertain variables which correspond to
the domain variables while the arcs represent the existence of the causal or influential relationship between two
variables. It also reveals the underlying dependencies i.e. the hidden structure of the domain variables. The
existence of Network Security Risk (NSR) found in operation of network services is what is of interest to
predict. This factor is dependent on the three main latent variables used to define network security. They are
Confidentiality Problems (C), Integrity problems (I), and Availability Problems (A).
Confidentiality problems are caused by either Unauthorized Use or Operational Disruptions of the network
services. Unauthorized use is an intentional act of human elements. It is usually triggered by Identity Theft of
both external (users) and internal (staff) persons. Operational Disruptions of the network services is triggered by
Human Error emanating from users of the network services. Integrity problems are caused by Programming
Bugs triggered by Human Error emanating from external users. Also, it can be caused by Infections and Hacks
emanating from users of the network services.
Availability problems are caused by Data Loss and Backup Failure on the part of the administrators (staff). It
can also be caused by DoS Attack emanating from users of the network services. It is also triggered by Assets or
Equipment damages inflicted by natural disasters or physical theft caused by non-human elements. Power
Problem triggered by physical damages of non- human elements is also another cause of Availability problem.
4.2.Setting up the quantitative part of the BN
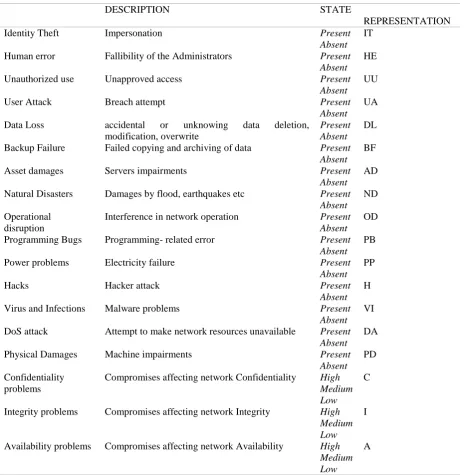
This involves quantification of the network i.e. assigning states and conditional probabilities for each variable
on the network. The list of the variables employed in this model, the set of values, the corresponding states and
the representation for each variable are as presented in Table 1.
This is to avoid any ambiguity in the meaning of the node and to prevent experts from assigning possibly
In this study, each node was treated as an input variable and takes discrete values. The values were both
mutually exclusive and exhaustive, which means that the variable take on exactly one of these values at a time.
Figure 2: Bayesian Network of Network Security Risk
4.2.1.Unconditional Priors specification
This involves populating the Bayesian Network structure in Figure 3 with the prior probabilities at each node.
This has to do with the unconditional prior distribution for nodes without parents and unconditional prior
distributions for child nodes. The prior probability of a risk is the known probability distribution over the states
of the risk and is considered a known relationship by previous experiences of the experts. The primary data for
the Bayesian Network knowledge structure information was collected by eliciting experts' opinion using a
knowledge gathering framework based on a self-completion questionnaire treated offline in this paper.
The questionnaire was validated by conducting a pilot test using Obafemi Awolowo University, Ile-Ife, Network
(OAUNET) team members, because of their substantial knowledge and expertise in the Data Communication
Network processes.
Thereafter, thirty (30) experts with extensive experience in the network management processes were contacted
to participate in the study. Educational Institutions networks, being a widely used network domain was chosen
magnitude of certain defined incidence within the causality network presented in [4]. Of the thirty (30) experts
contacted in educational institutions, all agreed to complete the survey; up to three reminders via e-mail and
phone were given to experts to complete and return the survey. However, only 26 experts returned the survey,
resulting in 86.67% response rate. The elicited data used for the simulation of this model is also treated offline
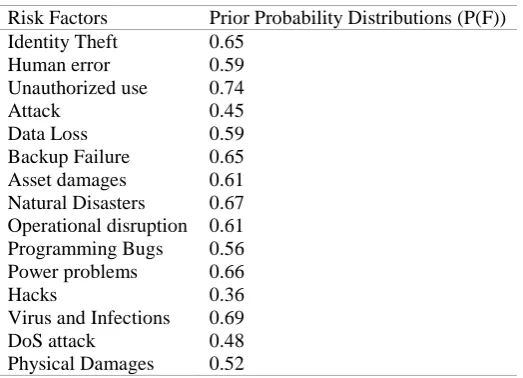
in this paper. Thus, the estimation of the prior probability distributions also known as the unconditional
probability distributions i.e. P(F) of each node associated with each state as determined by the experts and the
consensus of the experts is thus presented in Table 2. The unconditional probability distributions known as the
priors, elicited from the experts served as the input variables to the prediction model.
Table 1: Values and Representation of the Network Security Risks
DESCRIPTION STATE
REPRESENTATION
Identity Theft Impersonation Present
Absent IT
Human error Fallibility of the Administrators Present
Absent HE
Unauthorized use Unapproved access Present
Absent UU
User Attack Breach attempt Present
Absent UA
Data Loss accidental or unknowing data deletion,
modification, overwrite
Present Absent
DL
Backup Failure Failed copying and archiving of data Present
Absent BF
Asset damages Servers impairments Present
Absent AD
Natural Disasters Damages by flood, earthquakes etc Present
Absent ND
Operational disruption
Interference in network operation Present
Absent OD
Programming Bugs Programming- related error Present
Absent PB
Power problems Electricity failure Present
Absent PP
Hacks Hacker attack Present
Absent H
Virus and Infections Malware problems Present
Absent VI
DoS attack Attempt to make network resources unavailable Present
Absent DA
Physical Damages Machine impairments Present
Absent PD
Confidentiality problems
Compromises affecting network Confidentiality High Medium Low
C
Integrity problems Compromises affecting network Integrity High
Medium Low
I
Availability problems Compromises affecting network Availability High
Medium Low
A
were treated as input variables to reflect the actual state of the prediction model once evidence was entered.
According to the classical probability theory and axioms, there are assumptions that hold for the unconditional
priors of some of the input nodes. Thus, the unconditional prior probabilities of the network security risks and
the assumed prior probabilities for the risk impact on network security factors i.e. CIA was assigned to the
Bayesian structure in Figure 2. This is depicted in Figure 3 which shows the prior probabilities distributions in
percentage (%) for each node on the network using bar charts. The unconditional priors represent the
uncertainties about the parameter, F, for each node. The term "Present" represents the probability of likelihood
of occurrence of risk factors i.e. P(F) while the term "Absent" represents the probability of likelihood of
non-occurrence of risk factors i.e. 1-P(F).
Table 2: Unconditional Probability Distributions of the Network Security Risks
Risk Factors Prior Probability Distributions (P(F))
Identity Theft 0.65
Human error 0.59
Unauthorized use 0.74
Attack 0.45
Data Loss 0.59
Backup Failure 0.65
Asset damages 0.61
Natural Disasters 0.67
Operational disruption 0.61
Programming Bugs 0.56
Power problems 0.66
Hacks 0.36
Virus and Infections 0.69
DoS attack 0.48
Physical Damages 0.52
4.2.2.Probabilities Distributions Specification
In this study, a node in the BN only takes a discrete random variable with a finite number of states, thus, for the
quantitative part of the BN, there is, associated with each child node, a Conditional Probability Distribution
(CPD) over the states of the variable that it represents.
Since the set of possible values of a node and its parents are all discrete and finite then the CPD for the node is
simply a table that specifies the probability of each discrete state of the node given each combination of states of
its parents.
P(E|F) represents the conditional probability of Risk Effect (E) given the Risk Causal Factor (F), it is also
known as the observation model, because it relates Risk Causal Factor (F) to Risk Effect (E) of each of the
variables.
The observation model assumed that given the underlying Risk Causal Factor (F) and Risk Effect (E) are
independent.
Markov chain simulation i.e. Markov chain Monte Carlo (MCMC) simulation.
The discrete-event simulation was performed to determine the conditional probabilities. MCMC was used to
generate random samples of configurations for the various probability distributions in the BN. MCMC sampled
Figure 3: Unconditional priors
the probability distributions over the states of E given the states of F i.e. P(E|F) by defining reasonable ranges
for each of the hypotheses or the parameter value i.e. Risk Causal Factor (F), varying each parameter from its
lowest to highest reasonable value while holding the other variables, Risk Effect (E) fixed and examine the
resultant changes in the target value.
The BN was modeled by a list of variables X1, X2,...Xn. then the knowledge about the BN was represented by
combining the information of all aspects of relationships among the variables in a compact probability form i.e.
P(x1, x2,...in). This represents the Joint Probabilities Distributions (JPD) of the BN. Since MCMC only requires
an evaluation of JPD, this is then represented as a Markov chain. This Markov chain is thus simulated by
performing stochastic simulation taking steps using a random walk algorithm as presented in [6]. It is a
discrete-time random process, which converges the Markov chain after a certain number of steps to the desired
probability distribution. This process generated complete instantiations x1,...,xnof random variables X. These
generated variables are random because they can assume different states based on the new parameter.
Sampling-based sensitivity analysis was performed to sample directly from the BN itself. This is based on
probabilistic logic sampling to determine how sensitive these conditional probabilities are too small changes in
resulted in discrete time samples.
Samples were first taken from the unconditional nodes based on the prior probability distributions at these
nodes. Then, the child nodes of these nodes were sampled based on the conditional probability distributions at
these nodes conditional on the outcome of the sampled configuration of the respective parents. In the BN
presented in Figure 3, assuming risk factor A and risk factor B are first sampled from P(A) and P(B) respectively
and the outcome is Ayand Bn. Then, risk factor C was sampled from P(C| AyBn). This continued until all nodes
have been sampled. This was counted as one sample for the whole BN. This was carried out for as many
samples as required. The frequencies at each node were then used to express the sampled prior probabilities. As
parameters are entered, the sampling process is carried out following this method using the prior probabilities.
During the sampling process, some samples were rejected due to the fact that some parameter value is not
already incorporated into the BN. Samples that include values that are not equal to the parameter value entered
(at the specific nodes) were rejected. Thus, such sampling process resulted in samples with values that are at
odds with the parameter value. To avoid this situation, the assumption of the Markov property was employed
during the sampling process. The assumption holds that there are no direct dependencies in the system being
modeled which are not already explicitly shown via arcs.
4.2.3.Conditional probabilities distributions
MCMC estimated the likelihood of all P(E|F) combinations of every node in the BN depicted in Figure 3. This
is known as Conditional Probability. Every node Xi has a conditional probability distribution P(Xi | Parents(Xi))
that quantifies the effect of the parents on the node. The parameters are the probabilities stored in a CPT. Each
node in the network contains a CPT that determines the strength of the relationship. Each arc has a strength
associated with it that is also stored in the CPT attached to each node. CPT encodes the prior knowledge
between the child node and its parent node. Specifically, an element of the CPT at a child node is defined by:
CPTij = P(child_state = j| parent state = i) (1)
These probabilities were encoded during the quantification of the network. For each combination of variables,
the probabilities of these combinations need to sum to one (1).
4.2.4. Posterior distributions specifications
P(F|E) represents the Posterior probability of the Risk Effect (E) given the evidence of Risk Causal Factor (C).
Posterior distributions update the BN in the light of fresh data. New data from time to time might be useful in
updating the probabilities in the BN. prior probabilities derived can be updated in a Bayesian fashion as new
data arrives. While observing the value of some variable, there was a need to condition upon the new
information. This process of conditioning (also called probability propagation or inference or belief updating)
was performed via a “flow of information” through the network presented in Figure 3. In this model, this
becomes the task of computing the posterior probability distribution as presented in [4] for a set of query nodes,
4.2.5.Joint Probability Distribution (JPD) Specification
Before performing predictive reasoning in a Bayesian network, there is a need to first derive the joint probability
distribution between input and output. During the simulation, the directed relationships between random
variables in the graphical model were translated to a joint distribution over all random variables. Supposing the
Bayesian network has n random variables x1, x2. . . xn, modeling the Bayesian network requires the assumption
of the Markov property which states that there are no direct dependencies in the system being modeled which
are not already explicitly shown via arcs. Thus, computing the joint probabilities of the given random variables
requires the probabilities of every instantiation combination which is combinatorial explosive. The factored joint
distribution corresponding to the network of Figure 3 is given by:
𝑃𝑃(𝑁𝑁𝑁𝑁𝑁𝑁,𝐶𝐶,𝐼𝐼,𝐴𝐴,𝑈𝑈𝑈𝑈,𝑂𝑂𝑂𝑂,𝑃𝑃𝑃𝑃,𝑉𝑉𝐼𝐼,𝐻𝐻,𝑂𝑂𝐴𝐴,𝑃𝑃𝐵𝐵,𝐴𝐴𝑂𝑂,𝑃𝑃𝑃𝑃,𝑂𝑂𝐷𝐷,𝐼𝐼𝐼𝐼,𝑈𝑈𝑈𝑈,𝑈𝑈𝐴𝐴,𝑁𝑁𝑂𝑂,𝑃𝑃𝑂𝑂) =𝑃𝑃(𝑁𝑁𝑁𝑁𝑁𝑁)
𝑃𝑃(𝐶𝐶|𝑁𝑁𝑁𝑁𝑁𝑁)𝑃𝑃(𝐼𝐼|𝑁𝑁𝑁𝑁𝑁𝑁)𝑃𝑃(𝐴𝐴|𝑁𝑁𝑁𝑁𝑁𝑁)𝑃𝑃(𝑈𝑈𝑈𝑈|𝐶𝐶)𝑃𝑃(𝑂𝑂𝑂𝑂|𝐶𝐶)𝑃𝑃(𝑃𝑃𝑃𝑃|𝐼𝐼)𝑃𝑃(𝑉𝑉𝐼𝐼|𝐼𝐼)𝑃𝑃(𝐻𝐻|𝐼𝐼)𝑃𝑃(𝑂𝑂𝐴𝐴|𝐴𝐴)𝑃𝑃(𝑃𝑃𝐵𝐵|𝐴𝐴)𝑃𝑃(𝐴𝐴𝑂𝑂|𝐴𝐴)
𝑃𝑃(𝑃𝑃𝑃𝑃|𝐴𝐴)𝑃𝑃(𝑂𝑂𝐷𝐷|𝐴𝐴)𝑃𝑃(𝐼𝐼𝐼𝐼|𝑈𝑈𝑈𝑈,𝐶𝐶)𝑃𝑃(𝑈𝑈𝑈𝑈|𝑂𝑂𝑂𝑂,𝑃𝑃𝑃𝑃,𝐶𝐶,𝐼𝐼)𝑃𝑃(𝑈𝑈𝐴𝐴|𝑉𝑉𝐼𝐼,𝐻𝐻,𝑂𝑂𝐴𝐴,𝐼𝐼,𝐴𝐴)𝑃𝑃(𝑁𝑁𝑂𝑂|𝐴𝐴𝑂𝑂,𝐴𝐴)𝑃𝑃(𝑃𝑃𝑂𝑂|𝐴𝐴𝑂𝑂,𝑃𝑃𝑃𝑃,𝐴𝐴) (2)
This probability is not stored directly in the model and hence was computed. The probability of interest given a
model is known as probability inference. In this simulation, network performance prediction forecasting is
regarded as an inference problem in a Bayesian network. The main goal of inference in Bayesian networks is to
estimate the values of target nodes given the values of the observed nodes following the simulation algorithm in
Figure 4. The inferences were performed from parents to children, called prediction.
5.Simulation Result
Probabilistic inferences were applied to the Bayesian network to compute and evaluate the impact of network
security risk on its CIA based on the observed likelihood of occurrence of the security risk factors and predict
the potential network performance using the algorithm in Figure 4. The inference process of a Bayesian network
was conducted following the MCMC process. Specifically, each node X first receives a prior from experts'
knowledge and then compute the conditional probability distributions from each of its parent nodes U, denoted
P(u|x). In runtime, when a node X is activated, it first updates the belief Belief(x), i.e., the probability of X’s
states (P(X =x|evidence)), based on the evaluation values and the P(u|x) communicated with its parent. This is
known as belief updating which performs predictive reasoning, reasoning from new information about causes to
new beliefs about effects, following the directions of the network arcs. The computation result was used to
determine the impact or the consequences of a security risk based on the threshold as shown in Table 3 event
being exercised on the three (3) network security objectives:
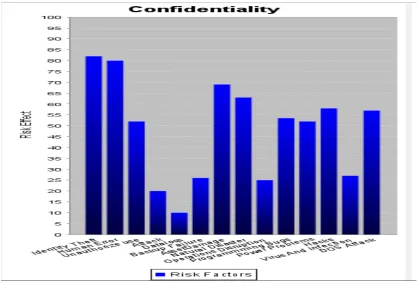
• Confidentiality: This gives assurance that information is not disclosed to unauthorized individuals,
processes, or devices. The criticality graph is as shown in Figure 5.
• Integrity: This ensures that information or software is complete, accurate, and authentic. The criticality
graph is as shown in Figure 6
The criticality graph is as shown in Figure 7.
Finally, the prediction of overall network performance was based on an addictive property of the three network
security objectives. The threshold that was set for the probabilities to determine the level of criticality of the
overall network performance is as shown in Table 4 and the criticality graph for the overall network
performance is shown in Figure 8. Let S be a Bayesian network and each node in the S has a logical state,
{Present, Absent}.
for all node Xi ∈ S that receives evidence ei do
Mark Xi as an observed node with a value of P(Present)
Let N be a collection node from Xi
for all node X ∈ N do
Receive P(x) from all X''s parent nodes, U.
Compute P(U|x) for all X's parent nodes, U.
end for
end for
for all non-leaf node C∈ S do
Compute P(C= 1|evidence) (i.e., the impact on Confidentiality)
end for
for all non-leaf node I∈ S do
Compute P(I= 1|evidence) (i.e., the impact on Integrity)
end for
for all non-leaf node A∈ S do
Compute P(A= 1|evidence) (i.e., the impact on Availability)
end for
If P(Zi = 1|evidence) = threshold then select Zi as potential network performance
end if
Table 4: Criticality Threshold for Overall Network
RISK FACTORS CRITICALITY NETWORK PERFORMANCES
Probabilities Threshold
Risk impact/ Severity
Security Strength
Effect on network
0.00-0.34 LOW HIGH Risk factors having a modest or insignificant impact on
the network performance; the network is capable of offering the efficient quality of services to users
0.35-0.69 MODERATE MODERATE Risk factors having a significant impact on the network
performance; the network may offer a reduced array of services to users.
0.70-1.00 HIGH LOW Risk factors having a catastrophic impact on the network
performance; the network is incapable of offering the efficient quality of services to users
Figure 5: Network integrity criticality
Figure 7: Overall network performances criticality
6.Summary and Conclusion
In summary, this research presented a prediction model based on Bayesian Network applied to predetermine the
effect of network security risk factors on the network confidentiality, integrity, and availability. The proposed
scheme measures the security risk quantitatively and predicts network performances using objectives metrics
and eventually improves the overall network performance efficiencies.
Model simulation was carried out for the prediction model formulated as Bayesian Network model. Java
programming language tools were used to simulate the model formulated. The core of simulation program was
written in Java programming language while Ms-DOS Operating System was used as an execution environment.
The simulation output of the risk impacts in percentages (%) was presented as bar charts. The resulting risk
impact on network confidentiality, Integrity and availability will now determine the criticality of the overall
network performance which will aid in the effective application of countermeasures to mitigate the effect of
network security risks.
7. Recommendation for Future Work
A number of open problems needed to be solved to allow the development of a truly general prediction system.
These problems suggest a variety of research directions that need to be pursued to make such a system feasible.
One such direction would be to investigate into allowing automatic learning of the structure of the probabilistic
model. The current framework requires that the model be specified explicitly. It would be interesting that this
initial model be suggested and a new framework is allowed to adapt or extend it so as to best fit the data. It
Finally, as future work, a simulator should be designed to assist in simulating and evaluating the performances
of the model. Either an excessively optimistic or pessimistic expectation of the quality of these prior beliefs will
distort the entire network and invalidate the results. This suggests that the performance of the Bayesian Network
models may vary depending on the characteristics of the dataset and/or depending on what simulator tools are
used.
Acknowledgments
This research was funded by the TETFund Research Fund and Africa Centre of Excellence OAK-Park, Obafemi
Awolowo University Ile-Ife, Nigeria.
References
[1] Lee, D., Netravali, A.N., Sabnani, K.K., Sugla, B. and John A. (1997). Passive Testing and
Applications to Network Management. Presented at the ICNP: IEEE International Conference on
Network Protocols, 113-122.
[2] Puliafito, and Tomarchio, O. (2000). Using Mobile Agents to Implement Flexible Network
Management Strategies. Computer Communication Journal, 23(8), 708-719.
[3] Straub, D.W. and Welke, R.J., (1998). Coping with Systems Risk: Security Planning Models for
Management Decision-Making. MIS Quarterly, 22(4), 441-469.
[4] Akinyemi, B.O., Amoo, A.O. and Olajubu, E.A. (2014). An Adaptive Decision-Support Model for
Data Communication Network Security Risk Management, International Journal of Computer
Applications, 106(8), 1-7.
[5] Kotulic, A.G. and Clark, J.G. (2004). Why There Aren't More Information Security Research Studies.
Information management, 41(5).
[6] Akinyemi, B.O., Amoo, A.O. and Aderounmu, G.A. (2015). Performance Prediction Model for
Network Security Risk Management. Communications on Applied Electronics, 2(8), 1-7.
[7] Schechter, S. E. (2005). Toward Econometric Models of the Security Risk from Remote Attacks, IEEE
Security and Privacy, 3(1), 40–44.
[8] Ahmed, M.S., Al-Shaer, E., L. and Khan. (2008). A Novel Quantitative Approach for Measuring
Network Security. Presented at the Proceedings of the 27th IEEE Conference on Computer
Communications, 1957-1965.
[9] Saad, W., Alpcan T., Başar T. and Hjørungnes, A. (2010). Coalitional Game Theory for Security
Risk Management.
[10] Saleh, Z. I., Refai H. and Mashhour, A. (2011). Proposed Framework for Security Risk Assessment.
Journal of Information Security, 2, 85-90.
[11] Stroie, E.R. and Rusu, A.C. (2011) Security Risk Management - Approaches and Methodology.
Informatica Economică, 15(1), 228-240.
[12] Liu, F. and Lee, W. (2010). Constructing Enterprise Information Network Security Risk Management
Mechanism by Ontology. Tamkang Journal of Science and Engineering. 13(1), 79-87.
Analysis and Terrorism Risk. Risk Analysis, 30(4), 575-589.
[14] Dantu, R., Kolan, P. and Cangussu J. (2009) Network Risk Management Using Attacker Profiling
Security and Communication Networks, 83–96.
[15] Bhattacharya S. and Ghosh, S.K. (2008) A Decision Model based Security Risk Management
Approach, Presented at the Proceedings of the International Multi-Conference of Engineers and
Computer Scientists, 2, 1194-1199.
[16] Lye, K-W. and Wing, J.M. (2005). Game Strategies in Network Security. International Journal of
Information Security 4:71–86.
[17] Maill´E P., Reichl, P. and Tuffin B. (2010) Of Threats and Costs: A Game-Theoretic Approach to
Security Risk Management.
[18] Wei-Wei, X. and Hai-Feng, W. (2010) Prediction Model of Network Security Situation Based on
Regression Analysis. Presented at the proceeding of the IEEE International Conference on Wireless
Communications, Networking and Information Security, 616-619.
[19] Paokanta, P., and Harnpornchai, N. Construction of Bayesian Networks for Risk Assessment of
Software Project by Knowledge Engineering. Presented at the 3rd International Conference on
Software, Knowledge, Information Management and Applications, 154-158.
[20] Sun, S., Zhang, C. and Yu, G. (2006) A Bayesian Network Approach to Traffic Flow Forecasting.
IEEE Transactions on Intelligent Transportation Systems, 7(1), 124-132.
[21] Pollino C.A, Woodberry O., Nicholson A., Korb K. Hart B.T. 2007. Parameterisation and evaluation
of a Bayesian network for use in an ecological risk assessment. Environmental Modelling & Software.
22(8): 1140–1152
[22] Xie, P., Li, J.H., Ou, X., Liu, P. and Levy, R. (2010). Using Bayesian Networks for Cyber Security
Analysis. Presented at the Proceedings of the 40th IEEE/IFIP International Conference on Dependable
Systems and Networks, 211-220.
[23] Bode, M.A., Alese, B.K., Thompson A.F. and Iyare, O. (2014) “A Bayesian Network Model for Risk
Management in Cyber Situation. Presented at the proceedings of the World Congress on Engineering
and Computer Science.
[24] Kondakci, S. (2010) Network Security Risk Assessment Using Bayesian Belief Networks. Presented at
the proceedings of the IEEE International Conference on Social Computing / IEEE International
Conference on Privacy, Security, Risk and Trust, 952-960.
[25] Poolsappasit, N., Dewri, R., Ray, I., (2012). Dynamic Security Risk Management Using Bayesian