Comprehensibility of UML B A Series of Controlled Experiments
7
0
0
Full text
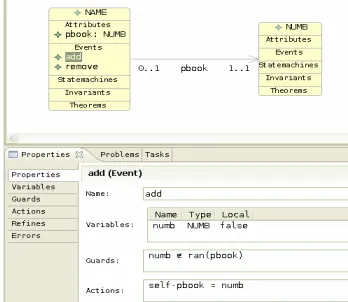
(2) components (corresponding to Event-B Machines and Contexts) in a project. Contexts are described in a Context diagram (similar to a class diagram but having only constant data and associated constraints) and Machines are specified in a Class diagram. Hierarchical Statemachines can be attached to classes to describe their behaviour. A notation, B (micro B) that borrows from the Event-B notation, is used for textual constraints and actions. B has an objectoriented style dot notation that is used to show ownership of entities (attributes, operations) by classes. Consider the specification of the telephone book in Figure 1. The classes, NAME and NUMB represent people and telephone numbers respectively. The association role, pbook, represents the link from each name to its corresponding telephone number. Multiplicities on this association ensure that each name has exactly one number and each number is associated with, at most, one name. The properties view shows B conditions and actions for the add event. The add event of class NAME adds a new name to the class. It non-deterministically selects a numb, which must be an instance of the class, NUMB, but not already used in a link of the association pbook (see B guard), and uses this as the link for the new instance (see B action). The remove event has no B action; its only action is the implicit removal of self from the class NAME. This specification is equivalent to the Event-B model shown in Figure 2, which is generated by U2B automatically.. variables were Score (accuracy) and Time taken to answer the questions. The Score and Time taken were used to determine the measure of efficiency; Rate of scoring (Score over Time taken). There were two types of comprehension measurement and analysis; Overall comprehension task and Comprehension for modification task. The results indicated with 95% confidence that a UML-B model could be up to 16% (Overall comprehension) and 50% (Comprehension for modification task) easier to understand than the corresponding B model.. Figure 1. UML-B specification of a phone book. 3. First Experiment The experiment aimed to evaluate the notation used (state variable) in UML-B to explore whether it could improve model comprehensibility. The evaluation was based on the comparison made between a UML-B model and an equivalent B model (purely developed from scratch). The measurement used in the evaluation focused on the efficiency in performing the comprehension task, that is, accuracy over time. The following paragraph briefly explains the experiment. The detailed elaboration can be found in [6]. The experiment was a cross-over trial [7] and a paper-based exercise. At one session, one group of subjects was assigned a task on the UML-B model while the other was assigned the same task on an equivalent B model. The reverse was then carried out in the subsequent session. The measured comprehension criteria include the interpretation of the symbols used, the tracing of input and output, the mapping between models and problem domains, and the modification task on the models. The response. Figure 2. Event-B specification of a phone book.
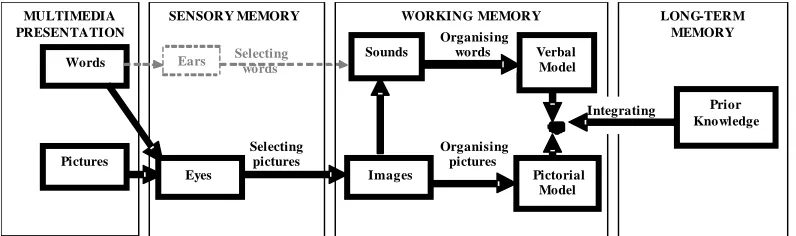
(3) it is presented in words and pictures than in words alone. The process of multimedia learning is viewed as building a coherent knowledge structure. The goal is to help people to understand and to be able to use what they learned. The ML integrates three other cognitive theories; Dual-coding Theory [9], Cognitive Load Theory [10] and Working Memory Model [11]. There are three primary assumptions. Firstly, words and pictures are processed through separate and distinct information processing channels. Secondly, each processing channel is limited in its ability to process information. Thirdly, processing information in channels is an active cognitive process designed to construct coherent mental representation [12,13]. The Figure 3 below illustrates this process.. 4. Follow-up Experiment (Replication) In the second experiment, a UML-B model was compared with an equivalent Event-B model (purely developed from scratch). The experiment aimed to explore the ability of the UML-B model to promote model viewers’ understanding of the presented problem domain rather than merely the information presented in the model. A UML-B model is comprehensible if it allows viewers to not only recognise the presented information but also to extend the understanding of the presented information in novel situations such as problem solving. The rationale of this investigation is twofold. First, stakeholders communicate and reason about a problem domain to improve their understanding of it. Without deep understanding of the problem domain, the proposed solutions may not meet the requirements. Second, stakeholders are skilled human beings who use complex cognitive processing when perceive and understand things. When interpreting a model, it is believed that they do not simply “vacuum” the presented information into their mind. Rather, they actively process the information by selecting only the relevant information, organise the selected information into meaningful mental representations and integrate them with other knowledge. Interpreting a model can thus be seen as knowledge construction where stakeholders actively make sense of a problem domain rather than passively receive the information.. 4.2. Research Question and Hypotheses The research question and hypotheses for the second experiment were: Does a UML-B model promote or foster better understanding of problem domain than an Event-B model? Null hypothesis: The UML-B model is no better than the Event-B model in fostering problem domain understanding. Alternative hypothesis: The UML-B model is better than the Event-B model in fostering problem domain understanding.. 4.1. Theoretical Background A one-sided alternative hypothesis was employed because UML-B can only be considered as worthwhile if its notation could overcome the barriers against formal notation such as used in Event-B. The ML enables a presumption that a UML-B model (words and pictures) should be more comprehensible than an Event-B model (words only). The basis for this is that a UML-B model guides its viewers to build verbal and pictorial mental models of. The second experiment was based on the Cognitive Theory of Multimedia Learning (ML) [8]. In many aspects, understanding a problem domain and the characteristics of the UML-B model itself coincide with the concepts demonstrated by the theory. Multimedia in the theory refers to the presentation of material using both words and pictures. The premise is that people can better understand an explanation when MULTIMEDIA PRESENTATION Words. SENSORY MEMORY Ears. Selecting words. WORKING MEMORY Sounds. Organising words. LONG-TERM MEMORY. Verbal Model. Integrating. Pictures. Eyes. Selecting pictures. Images. Organising pictures. Pictorial Model. Figure 3. The cognitive theory of multimedia learning [8]. Prior Knowledge.
(4) the presented information and connections between them, which is necessary for conceptual understanding. The Figure 4 provides an explanation for the presumption. It illustrates how the information presented by a UML-B model (words and pictures) flow into the eyes. The words and pictures then become images in the working memory. The images from pictures are organised into pictorial models, where the pictures change from the basis of images to the basis of meaning. Meanwhile, the images from the printed words are transformed as sounds in the working memory through phonological loop [11]. The idea of phonological loop is that the working memory processing for verbal information involves a “mind’s voice” and a “mind’s ear”. When visually presented verbal information such as printed word is encoded, the word is “voiced” into a sound-based or auditoryphonological code. The sounds are then organised into verbal models where the words change from the basis of sounds to the basis of meaning. The verbal and pictorial models are then integrated with prior knowledge to form a meaningful understanding. A similar process is assumed to happen in an Event-B model for the printed words. An Event-B model does not have pictures thus most of the images resulting from the eyes are transformed as sounds and later as verbal models in the working memory. Although there is possibility where some word images maybe transformed as pictorial models (e.g. a relation symbol between two sets is visualised mentally as a physical arrow between two bubbles containing elements), they are not as much as in the UML-B model. Therefore, the information presented in the Event-B model is heavily processed in one channel. This leads to qualitatively unbalanced processing between the two channels where one is overloaded and the other is underused. As a result, the mental models are not well developed in the working memory.. MULTIMEDIA PRESENTATION Words. SENSORY MEMORY Ears. Selecting words. 4.3. Method The second experiment was a replication of the first experiment. Thus, the nature of the notations (graphical and textual versus textual alone), the design of the experiment (cross-over trial) and the protocol used remained the same as in the first experiment. In fact, the same response variables were used; Score (accuracy) and Time taken. They were used to determine the measure of efficiency; Rate of scoring. These variables were expected to be influence by the state variable, that is, the notations used in the models. The questions on the models however were different from the first experiment. In particular, it focused on the construction of knowledge structures, which can be demonstrated by the ability of the subjects to explain cause-and-effect, compare and contrast two elements, describe main ideas and supporting details, list a set of items and analyse a domain into sets and subsets [14]. These criteria were used together with Bloom’s Taxonomy [15] as the measurement instrument in the second experiment. Similar to the first experiment, the experiment had two treatments (UML-B and Event-B) to be examined in two consecutive sessions. Therefore, four models that represented two separate case studies were developed. There were six questions in each model and the questions were similar for both UML-B and Event-B models. The six questions were divided into two main categories; three questions assessed the subjects’ ability to recognise the presented information and the rest assessed the subjects’ ability to extend the understanding in novel situations. These two categories acted as the basis for the analysis and hypotheses testing. Unlike the first experiment, the second experiment was an online exercise where the subjects viewed the given models on the computer screen. It was conducted in a two-hour slot. The slot was divided into two sessions with forty-five minutes each. There was a fifteen-minute break between the sessions. Subjects WORKING MEMORY. Sounds. Organising words. LONG-TERM MEMORY. Verbal Model Integrating. Selecting pictures. Pictures Eyes. Prior Knowledge. Organising pictures Images. Pictorial Model. Figure 4. The hypothesised cognitive processing of a UML-B model.
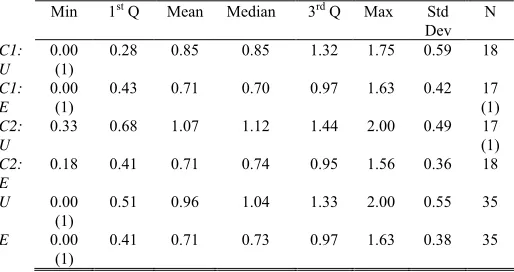
(5) were given a specific model and its questionnaire in each session. The instruction sheet was given at the beginning of the first session. The subjects were not allowed to talk to each other but were allowed to refer to notes. After the allocated time had passed, the questionnaire was collected whether or not the subjects had completed answering all the questions. Prior to the experiment execution, the protocol and the materials used in the experiment were reviewed and approved by the University’s Ethics committee. A pilot study that involved seven postgraduate students was also conducted. This was to ensure the accuracy of the materials and the feasibility of the tasks.. efficiency in extending the understanding in novel situations (Understanding task). The measures were obtained by calculating the total Score and Time taken for the three questions in each category. To allow the comparison of results between the two experiments, the efficiency for Overall comprehension task and Comprehension for modification task were also pursued. The measures for these tasks were obtained by calculating the total Score and Time taken for all six questions and for the question on model modification respectively. The Table 1 to 4 below illustrates the measures of center and spread for the Recognition task, Understanding task, Overall comprehension task and Comprehension for modification task respectively. Column Min shows the minimum values, column 1st Q shows the first quartile values, column Mean shows the average values, column Median shows the middle values, column 3rd Q shows the third quartile values, column Max shows the maximum values, column Std Dev shows the degree of variation, and column N gives the number of collected data. Rows C1:U and C1:E present the Rate of scoring of UML-B model and Event-B model respectively for the first case study. Rows C2:U and C2:E present the Rate of scoring of. 4.4. Subjects. There were thirty-six students that participated in the experiment; eighteen third-year Undergraduate students and eighteen Masters students of Computer Science and Software Engineering courses at the University of Southampton, United Kingdom. They were students from various continents including Europe and Asia. The international students, who came from outside the United Kingdom constituted half of the subjects and the proportion of women to men was 1:4. The subjects were taught formally on the Table 1. classical B for about eight hours, one hour on Rate of scoring distribution for Recognition task Event-B and one hour on UML-B. All subjects Min 1st Q Mean Median 3rd Q Max Std N had gone through courses on the object-oriented Dev C1: 0.30 0.45 0.65 0.63 0.76 1.27 0.26 18 technology and formal methods at some points of U their studies. The subjects were in the final C1: 0.27 0.38 0.57 0.53 0.73 0.93 0.22 17 semester of their respective courses and had E (1) reasonable amount of experience and knowledge C2: 0.58 0.82 1.14 1.11 1.32 1.81 0.40 17 U (1) of software development. Some of the Masters C2: 0.32 0.50 0.75 0.77 0.93 1.33 0.29 18 students had some work experience. They were E the next generation of professionals. Thus, they U 0.30 0.61 0.89 0.77 1.18 1.81 0.41 35 represented closely the population under study. E 0.27 0.42 0.66 0.68 0.84 1.33 0.27 35. 4.5. Results and Analysis The Rate of scoring was the measure of interest as it considered both accuracy and duration of comprehension, that is, efficiency. The scale used for the Rate of scoring was marks per minute (marks/min). This means a model with a higher Rate of scoring is better than otherwise since it indicates a higher accuracy with least time taken to understand the model. There were two types of analysis, which were based on the two categories of questions mentioned earlier. One was the efficiency in recognising the presented information (Recognition task) and the other was the. Table 2. Rate of scoring distribution for Understanding task C1: U C1: E C2: U C2: E U E. Min. 1st Q. Mean. Median. 3rd Q. Max. 0.00 (1) 0.00 (1) 0.33. 0.28. 0.85. 0.85. 1.32. 1.75. Std Dev 0.59. 0.43. 0.71. 0.70. 0.97. 1.63. 0.42. 0.68. 1.07. 1.12. 1.44. 2.00. 0.49. 0.18. 0.41. 0.71. 0.74. 0.95. 1.56. 0.36. 17 (1) 17 (1) 18. 0.00 (1) 0.00 (1). 0.51. 0.96. 1.04. 1.33. 2.00. 0.55. 35. 0.41. 0.71. 0.73. 0.97. 1.63. 0.38. 35. N 18.
(6) Table 3. Rate of scoring distribution for Overall comprehension task. Like the first experiment, this experiment employed a robust statistical method called Min 1 Q Mean Median 3 Q Max Std N bootstrap methods and permutation tests for the Dev C1: 0.28 0.49 0.72 0.67 0.98 1.42 0.33 18 statistical inference [16]. The bootstrap methods U were used to calculate the standard errors and C1: 0.26 0.39 0.59 0.54 0.78 1.08 0.24 18 the confidence intervals [17], whereas the E permutation tests were used to test the C2: 0.44 0.73 1.06 1.08 1.26 1.75 0.40 18 U significance level of the observed effects. The C2: 0.30 0.53 0.74 0.76 0.92 1.15 0.25 18 analysis was done using the S-PLUS® 7.0 for E Windows-Enterprise Developer [18] software. U 0.28 0.55 0.89 0.86 1.16 1.75 0.40 36 The experiment employed a cross-over E 0.26 0.43 0.66 0.70 0.84 1.15 0.25 36 design and thus had to consider the period effect [7]. Period effect concerns the chances of Table 4. detecting effects due to the session when the Rate of scoring distribution for Modification task treatment is applied rather than the treatment Min 1st Q Mean Median 3rd Q Max Std N Dev itself. The true treatment effect (t) that considers C1: 0.00 0.25 1.29 0.91 1.58 5.75 1.40 18 the period effect at 95% confidence interval for U (2) the respective comprehension tasks are shown in C1: 0.14 0.62 1.13 1.12 1.63 2.25 0.60 14 the Table 5 below. They are the estimated E (4) C2: 0.50 0.83 1.47 1.50 2.00 2.80 0.68 15 differences between the expected Rate of U (3) scoring under the UML-B model and that under C2: 0.17 0.72 0.88 0.88 1.13 1.57 0.40 16 the Event-B model at 95% confidence interval. E (2) To test the hypotheses, the statistical U 0.00 0.67 1.37 1.30 2.00 5.75 1.12 33 (2) significance testing was applied. This was E 0.14 0.68 0.99 0.93 1.36 2.25 0.51 30 achieved by assessing the p-values (P) against the significance criterion (α=0.05). As indicated in the Table 5 below, the p-values for all comprehension tasks are less than 0.05 in favour of the UML-B model. This means that the the respective models for the second case study. The difference in the treatment effect between the UML-B last two rows present the grouped Rate of scoring model and the Event-B model is statistically significant based on the models used, regardless of the case. (P<0.05). This suggests that the UML-B model is more The analysis excluded the subjects who did not comprehensible than the Event-B model in terms of the attempt the task, which numbers are stated in the efficiency in recognising the presented information and brackets under the N column. On the other hand, the extending the understanding in novel situations. In subjects who had attempted the task for some time but other words, the UML-B is better than the Event-B failed to get any score were included in the analysis, model in fostering problem domain understanding. If which numbers are stated in the brackets under the Min column. The implication of this data is that the subjects had struggled to understand the model or perhaps had Table 5 misunderstood the model. Either possibility indicates Confidence intervals and p-values of that there was a problem on the model comprehension tasks comprehensibility. This is the reason why they were Task 95% Confidence p-value included in the analysis Interval (alternative > null) From the descriptive statistics shown above, it can be seen that the Rate of scoring on the UML-B models Recognition 0.13 <= t <= 0.35 0.001 is higher than the Event-B models. These differences Understanding 0.11 <= t <= 0.39 0.003 may be a reflection of true differences in the population Overall 0.14 <= t <= 0.32 0.001 Modification 0.15 <= t <= 0.76 0.005 from which the samples were taken. On the other hand, it is possible that the differences may be due to sampling errors. In order to assume that the differences obtained from the samples to be true differences in the similar hypotheses used in the first experiment were population, the standard statistical inference needs to considered, the results also indicate that the UML-B be applied. model is more comprehensible than the Event-B model st. rd.
(7) for Overall comprehension task and Comprehension for modification task.. 5. Conclusions and Future Work This paper has presented two experimental comparison of the comprehensibility of a UML-based formal model (UML-B) versus a textual one (B and Event-B). The results of both experiments indicate that a model that integrates the use of semi-formal and formal notations such as UML-B is capable of expediting the subjects’ comprehension task with accuracy even with limited training. In particular, the model enables the subjects to not only efficiently recognise the presented information but also extend the understanding in novel situations. This finding is appealing as it suggests that introducing some graphical features of a semi-formal notation into a formal notation significantly improves the formal notation’s accessibility. There are several ways in which the experiments and findings could be improved. One possible way is through replication, where the comprehensibility of UML-B model could be assessed using other cognitive theories such as Cognitive Fit [19]. It would be interesting to investigate the nature of problem that could be effectively presented by such model and how the notation fits the required cognitive processes. This could improve the understanding of why such model is more useful for problem understanding than its counterparts. In addition, as the experiments were conducted using students and “toy problems”, the replication could also involve using more experienced subjects and large-scale problems. Such studies could be conducted as quasi-experiments in industrial settings.. References [1] Object Management Group, Introduction to OMG’s Unified Modeling Language (UML). [Online]. Available: http://www.omg.org/gettingstarted/what_is_uml.htm , 2006. [2] Abrial, J.R., The B-Method - Assigning Programs to Meanings, Cambridge University Press, 1996. [3] Mayer, R.E., Bove, W., Bryman, A., Mars, R. and Tapangco, L., “When Less is More: Meaningful Learning from Visual and Verbal Summaries of Science Textbook Lessons”. Journal of Educational Psychology, Vol. 88, 1996, pp. 64-73. [4] C. Snook and M. Butler, “UML-B: Formal Modelling and Design Aided by UML”, ACM Transactions on Software Engineering and Methodology, Vol.15, No.1, 2006, pp. 92122.. [5] J.R. Abrial, , M. Butler, S. Hallerstede, and L. Voisin, “An Open Extensible Tool Environment for Event-B”, ICFEM 2006, LNCS 4260. [6] R. Razali, C. F. Snook, M. R. Poppleton, P. W. Garratt and R. J. Walters, “Experimental Comparison of the Comprehensibility of a UML-based Formal Specification versus a Textual One”, Proceedings of 11th International Conference on Evaluation and Assessment in Software Engineering (EASE), 2007. [7] Senn, S., Cross-over Trials in Clinical Research (Statistics in Practice), John Wiley & Sons, 2002. [8] Mayer, R.E, Multimedia Learning, Cambridge University Press, 2001. [9] Paivio, A., Mental representation: A dual coding approach, Oxford University Press, 1986. [10] P. Chandler and J. Sweller, “Cognitive load theory and the format of instruction”, Cognition and Instruction, Vol. 8, 1991, pp. 293-332. [11] Baddeley, A.D, Working memory, Oxford University Press, 1986. [12] M.C. Wittrock, “Generative processes of comprehension”, Educational Psychologist, Vol.24, 1989, pp. 345-376. [13] Mayer, R.E, The promise of educational psychology, Upper Saddle River, Prentice Hall, 1999. [14] L.K. Cook and R.E. Mayer, “Teaching readers about the structure of scientific text”, Journal of Educational Psychology, Vol.80, 1988, pp. 448-456. [15] B. S. Bloom, and D. R. Krathwohl, “Taxonomy of Educational Objectives: The Classification of Educational Goals, by a Committee of College and University Examiners”, Handbook I: Cognitive Domain, Longmans, New York, 1956. [16] Efron, B. and Tibshirani, R., An Introduction to the Bootstrap, Chapman and Hall, New York, London, 1993. [17] B. Efron and R. Tibshirani, “The Bootstrap Method for Standard Errors, Confidence Intervals and other measures of statistical accuracy”, Statistical Science, Vol.1, 1986, pp. 135. [18] Insightful Corporation (2006) [Online]. Available: http://www.insightful.com/products/splus/default.asp [19] Vessey, I., “Cognitive Fit: A Theory-Based Analysis of the Graphs Versus Tables Literature”, Decision Sciences, Vol.22, No.2, 1991, pp. 219-240..
(8)
Figure
![Figure 3. The cognitive theory of multimedia learning [8]](https://thumb-us.123doks.com/thumbv2/123dok_us/8496259.346071/3.612.118.497.571.691/figure-cognitive-theory-multimedia-learning.webp)
+2

Related documents
Passed time until complete analysis result was obtained with regard to 4 separate isolation and identification methods which are discussed under this study is as
It is better for company to improve the job satisfaction and job performance activities because both of variables have significant influence on turnover
Should you need to write to a Finnish archive for information not available at the Family History Library or at a parish office, you may write in English or obtain the services of
Eight years (2001 – 2008) of data from crop field trials conducted by the Agricultural Research Service (USDA-ARS) near Brookings, SD is used to empirically analyze the performance
However, the amounts of image data pro- duced using modern systems biology are very vast for manual analysis; hence, the development of automated image analysis tools is essential1.
Elongation factor P (EF-P) is a highly conserved bacterial protein that interacts with the ribosome and stimulates peptide bond formation.. Lysine 34
http://www.apat.gov.it. WHO guidelines for indoor air quality: dampness and mould. The microbiological characterization of the bioaerosol and leachate from an urban solid
The RS-2 WF mode combines the advantages of the large spatial coverage of the Wide mode (150 x 150 km) and the high pixel resolution (9m) of the Fine mode and thus has a
