A Machine Vision Based Automatic Optical Inspection
System for Detecting Defects of Rubber Keypads of
Scanning Machine
Huan Ngoc Le
1,*, Ngoc Vuong Bao Tu
21Mechanical & Mechatronics Department, Eastern International University, Nam Ky Khoi Nghia Street, Hoa Phu Ward, New city, Binh Duong Province, Viet Nam
2Master’s student, International University, Linh Trung Ward, Thu Duc District, Ho Chi Minh City, Viet Nam
Abstract
In order to detect defective rubber keypads, factories have to devote massive manpower and financial resources. In this paper, a vision-based system for the detection of a number of rubber keypad defects is designed and developed. To improve the lens distortion rectification, a novel, easy calibration method using image local transformations defined by both sets of points that are detected in the distorted image and the undistorted ones without using any model for a wide-angle and low- cost lens camera was proposed. The system detects the defects of 14 different types of rubber keypads quickly (~within about 1.8 seconds) and accurately even with a normal laptop and a low-price webcam.
Keywords: Detect defects, Computer vision, 2D calibration, Rubber keypad, AOI. Received on 19 February 2019, accepted on 22 March 2019, published on 28 March 2019
Copyright © 2019Huan Ngoc Leet al., licensed to EAI. This is an open access article distributed under the terms of the Creative Commons Attribution licence (http://creativecommons.org/licenses/by/3.0/), which permits unlimited use, distribution and reproduction in any medium so long as the original work is properly cited.
doi: 10.4108/eai.28-3-2019.157121
*Corresponding author. Email: [email protected]
1. Introduction
In this paper, the authors designed a computer vision system to detect the defects of remote control keypad buttons. The defects in the buttons of keypads are categorized as wrong position, incorrect direction, color distorted, fonts errored, disappeared buttons, etc. as shown in Fig. 1. To ensure the quality of keypad button and improve the productivity, checking for defects in the keypad button is an important task in production.
Automated testing by computer vision technology can provide manufacturers with the opportunity to improve the quality and reduce the costs [1]. Reducing the defects at the component level also improves the quality of the final products. In some companies (Datalogic company in Saigon Hi-Tech Park Center, Ho Chi Minh City, Vietnam, for
example), a worker needs on average 30 seconds for inspecting a 52 button keypad and the accuracy is just about 90%.
From industrial site, the owner always needs systems as cheap and reliable as possible. So, computer vision system served in companies tends to use low-prize and wide-angle lens camera. Today, a wide-angle lens has become useful for many applications in photography and other industrial devices such as automatic optical inspection systems. In addition to lots of advantages, wide-angle images captured by a single camera always appear distortion in the peripheral area. Therefore, the image quality obtained is greatly reduced. To overcome this disadvantage, many lens distortion correction methods were introduced by using camera calibration schemes.
In 2004, a correction of camera lens distortion was introduced in a mobile robot tracking application [2]. Recently, the authors in [3] proposed a non-linear method for correcting the fish-eye lens distortion. And, the authors This paper has been submitted in part to INISCOM 2019 - 5th EAI
2
in [4] utilized the local self-similarity to correct and enhance a lens distortion. A new scheme without using any model was suggested for correcting non-linear lens distortion [5]. And, a new calibration method for omitting the non-linear lens distortion was presented [6]. These above methods deal with the non-uniform distortion that the conventional interpolation methods cannot completely solve.
In this paper, a new, fast distortion correction method that uses local transformations determined by both sets of points in the distorted and undistorted image were presented. Through studying the law of error distribution using checkerboard, an error compensation model using interpolation method was used.
To vision-based systems, searching for a fast, robust thresholding scheme has been a tough problem. Segmenting images automatically by entropy method is widely used. In [7] and [8], a new entropy method named Tsallis entropy was introduced and suggested to use for image segmentation. Several novel methods have been developed for adaptive image segmentation by utilized minimum cross entropy [9 - 11]. Maximum entropy can be combined with spatial information for an automatic segmentation [12]. Using fuzzy entropy into image segmentation applications has been studied and reported with quite reliable results [13 - 16]. Usually, there are two ways to use the entropy method for automatic image segmentation. They are global and local methods. However, for keypad applications, because of the large image size, the global approach is superior.
By comparing the performance of several automatic segmentation schemes, the methods of maximum entropy [12] and a well-known method developed by Otsu [17] were emerged as reliable schemes. So, they were deeply researched for use and comparison with our proposed scheme.
The main goal of this study is to develop algorithms to automatically detect keypad defects with a result similar to human classification experts. Especially, the consuming time is especially considered to upgrade the system to a real-time auto detection system. In addition, the authors have designed and built a mobile system that makes collecting and processing images at the factory easy. This system includes a camera connected to a laptop computer. The developed algorithms have been tested directly with actual keypad devices at the company.
Figure 1.Defects in keypad buttons.
2. Materials and Methods
2.1. Mobile Image Processing Unit
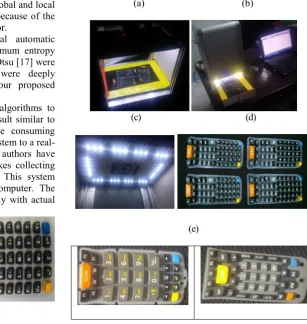
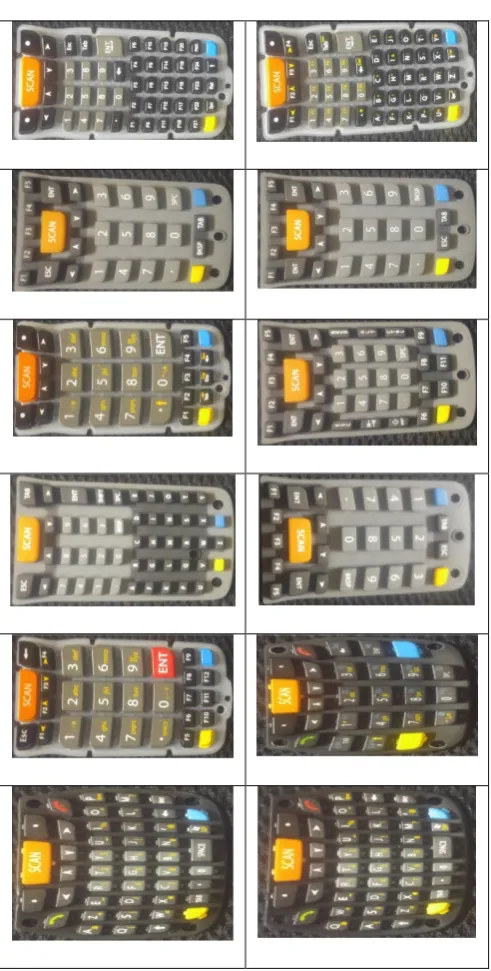
The developed mobile unit was composed of an image acquisition unit as in Fig. 2b and a mobile computing unit mounted on a 15" Notebook (Intel Core i7, 2.2GHz, RAM 8 Gb). An illumination system was composed of a circular white LED rectangular-type direct lighting device. A camera was placed at the center of the rectangular-type LED lighting at the top site of image acquisition unit as shown in Fig. 2(c). Figure 2(d) shows an image obtained using the image acquisition device. Keypads were supported by a big automation company which was making several types of keypads. The analysis software was made with C# and sample keypad images were taken directly from the keypad supplier, Fig. 2(a). As in Fig. 2(a), the red line was used to check the keypad supplier position. While operating the system, the camera captures the images continuously until the red line shown in default position in the image. Then the system will use this image for processing process. 14 types of keypads, as seen in Fig. 2(e) with the number of buttons varying from 29 to 52 used for detecting defects in this study.
(a) (b)
(c) (d)
(e)
Figure 2.(a) Keypad supplier; (b) Full system; (c) LED and camera; (d) Sample image captured by the system; (e) 14 types of keypad used in this work.
2.2. Image calibration
To use the matching method for comparing objects in a standard image and an input image, the size of an object must be the same even if it is placed in any position in the image. Therefore, in the paper, a new calibration method giving higher accuracy than the traditional method was proposed.
2.2.1. Plane calibration and error
After doing the traditional calibration, objects closer to the camera will be larger than objects that are far from the camera. Therefore, for applications that need the measure of
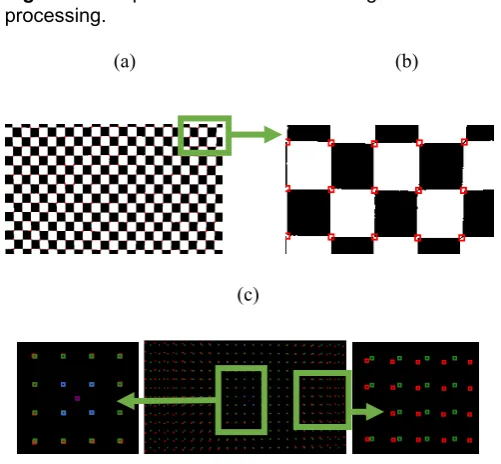
objects’ size at every location on the same plane that the camera is not normal to, a new calibration method is needed. So, we proposed a quick calibration method based on non-metric scheme. As in [18, 19], the nearer the area around image center is, the lower the radial distortion is. In this research, a checkerboard with its rectangular size of 10mm×10mm (56x56 pixels) was used to analyse the distribution law of the error. To use the suggested method, it is supposed that the horizontal edges of the rectangles in the checkerboard are parallel to the horizontal axis of image frame.
Calibration and error obtained process is shown below: 1) Get the calibration plate image;
2) Calculate the size of centroid rectangle;
3) Get the grid map based on the size of centroid rectangle and the position of image center;
4) Get the shrinkage coefficients of the intersection points versus corresponding undistorted points or grid vertices;
5) Recover the input image by combining with shrinkage coefficients and the grid vertices.
2.2.2. Image processing process for obtaining intersection positions
4
Figure 3. Simplified work flow of the image processing.
(a) (b)
(c)
Figure 4.(a) At each point, check area around it to find intersections; (b) The intersections are accurately marked red in the checkerboard image; (c) The image of the dot-centroid position and grid vertices added over the image of intersection points.
2.2.3. Distribution of shrinkage
The calibration error exists in the X and Y coordinates apparently, [20]. As shown in [18], [19] and [21], the calibration error at the center of image was almost zero. So, the size of centroid rectangle is utilized as an ideal cell of the grid. To form the grid, the centroid rectangle is detected and its size is measured firstly. Then, an ideal grid based on size of the centroid square and image center will be generated as in Fig. 5(c). The difference between intersection points in the input image and corresponding grid vertices will be used to analyse the shrinkage in X and Y coordinate.
2.2.4. The distribution law of shrinkage on X and Y axis
From the left edge to center of the image the shrinkage first becomes larger and then turns smaller, and from the center to the right edge of the image the error first gets smaller and then gets larger. In Figs. 5(a) and 5(b), the shrinkage (unit: pixels) is estimated by the difference between vertex of grid and corresponding intersection point. Fig. 5(c) and 5(d) show the image of the checkerboard before and after calibration respectively.
(a)
(b)
(c)
(d)
Figure 5. (a) Shrinkage distribution in X-axis; (b) Shrinkage distribution in Y-axis; (c) The image of the checkerboard before calibration; (d) The image of the checkerboard after calibration.
(a) (b)
(c)
(d)
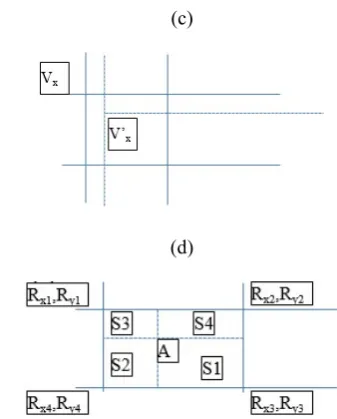
Figure 6.(a) Vertex-deviation in input image; (b) Grid cell; (c) Vertex of grid cell and intersection point; (d) Vertex of grid cell and a point inside grid cell.
2.2.5. Theory and method of generating the grid
In the 23*13 grid of Fig. 5(c), X coordinate values of four vertices of each grid cell change into abscissa as in Fig. 6(a). Firstly, center of image can be found. From this, four intersection points around the center are estimated.
The value of center point in X and Y direction should be calculated as in equations 1 and 2.
Cx(i,j) = (Px(i, j)+ Px(i, j+1)+ Px(i+1, j+1)+ Px(i+1, j))/4 (1) Cy(i,j) = (Py(i, j)+ Py(i, j+1)+ Py(i+1, j+1)+ Py(i+1, j))/4 (2)
Recalculate the size of rectangle as in Fig. 6(b) by using equations 3 and 4.
Ex = (Px(i, j+1) + Px(i+1, j+1) - Px(i+1, j) - Px(i, j))/2 (3) Ey = (Py(i+1, j) + Py(i+1, j+1) - Py(i, j+1) - Py(i, j))/2 (4)
From the center’ rectangle, the grid of rectangles having the same size with center’ rectangle is generated. At each cell of the grid, the shrinkage coefficients in X and Y direction Rx and Ry can be achieved as in equations 5 and 6.
Rx = Vx / V’x (5)
Ry = Vy / V’y (6)
Where V is the distance of the vertices (distorted and undistorted vertices) to the image center, Fig. 6(c). From now on, each grid vertex contains two shrinkage coefficients in X and Y direction.
2.2.6. Construction of the error compensation model
To recover the input image, a zero calibration image is created firstly. Then, at each pixel belongs to a grid cell as in Fig. 6(d), the formula below is used for estimating shrinkage coefficients RxA and RyA at point A.
RxA = (S1/S)*Rx1+(S2/S)*Rx2+(S3/S)*Rx3+(S4/S)*Rx4 (7) RyA = (S1/S)*Ry1+(S2/S)*Ry2+(S3/S)*Ry3+(S4/S)*Ry4 (8)
Where, S = S1 + S2 + S3 + S4
Then, corresponding position (AP) in input image can be calculated as below equations.
XAP = XA / RxA (9)
YAP = YA / RyA (10)
Where, XAP and YAP are X, Y coordination of AP point. And, AP is corresponding position of A in input image. However, the XAP and YAP are not integer values. So, to get the exact color value at AP point, we need to do interpolation one more time as in below equation.
CA = CAP = (S1)*C1+(S2)*C2+(S3)*C3+(S4)*C4 (11) Where S1, S2, S3, S4 calculated as in Fig. 6(d) are the area of corresponding rectangles. And, C1, C2, C3, C4 are grayscale values (0-255) of four pixel surrounding AP point.
2.2.7. Verification of the compensation model
The experiment uses standard circle samples to verify the accuracy of the arc compensation. In this experiment, a standard circular sample with diameter of 60mm is placed at 5 different locations in the calibration plate, as seen in Fig. 7(a). After doing calibration using proposed method, the width and length before and after compensation are calculated, respectively. The result is listed in tables 1 and 2.
(a)
(b)
(c)
4
0Figure 7. (a) Standard circle samples; (b) Standard rectangular samples; (c) Camera inclines to the base line with an angle of 4 degrees.
1 2
3
6
Table 1.The circle specification before calibration.
Ex. Nu. Size (Pix.) Y-Size (Pix.) X-Size (Pix.) Real Size (cm) Pix./cm (Y-Axis) Pix./cm (X-Axis) % Error Y % Error X
1 20731 163 160 3 54.33 53.33 2.98 4.76
2 20496 162 159 3 54.00 53.00 3.57 5.36
3 21329 163 165 3 54.33 55.00 2.98 1.79
4 20066 159 159 3 53.00 53.00 5.36 5.36
5 20328 160 159 3 53.33 53.00 4.76 5.36
Table 2.The calibration result of circles.
Ex. Nu. Size (Pixel) Y-Size (Pix.) X-Size (Pix.) Real Size (cm) Pix./cm (Y-Axis) Pix./cm (X-Axis) % Error Y % Error X
1 22415 168 167 3 56.00 55.67 0.00 0.60
2 22130 167 167 3 55.67 55.67 0.60 0.60
3 22424 168 168 3 56.00 56.00 0.00 0.00
4 22304 168 168 3 56.00 56.00 0.00 0.00
5 22407 169 167 3 56.33 55.67 0.60 0.60
Table 3.The calibration result of rectangles.
Real size Measurement
before calib. Error before calib. Measurement after calib. Error after calib. Area (cm2) Edge Length (cm) Area (Pixel) Area (cm) Area (%) Area (Pixel) Area (cm) Area (%)
Ob1 16 4 84225 15.38 3.87 87187 15.92 0.49
Ob2 16 4 83437 15.24 4.77 86591 15.81 1.17
Ob3 16 4 86757 15.84 0.98 88063 16.08 0.51
Ob4 16 4 83218 15.20 5.02 86468 15.79 1.31
Ob5 16 4 85066 15.53 2.91 87432 15.96 0.21
(a)
120
120
122 111
110
110
(b)
116 115
116
113
114
114
(c)
116 112 104
(d)
111 112 111
(e)
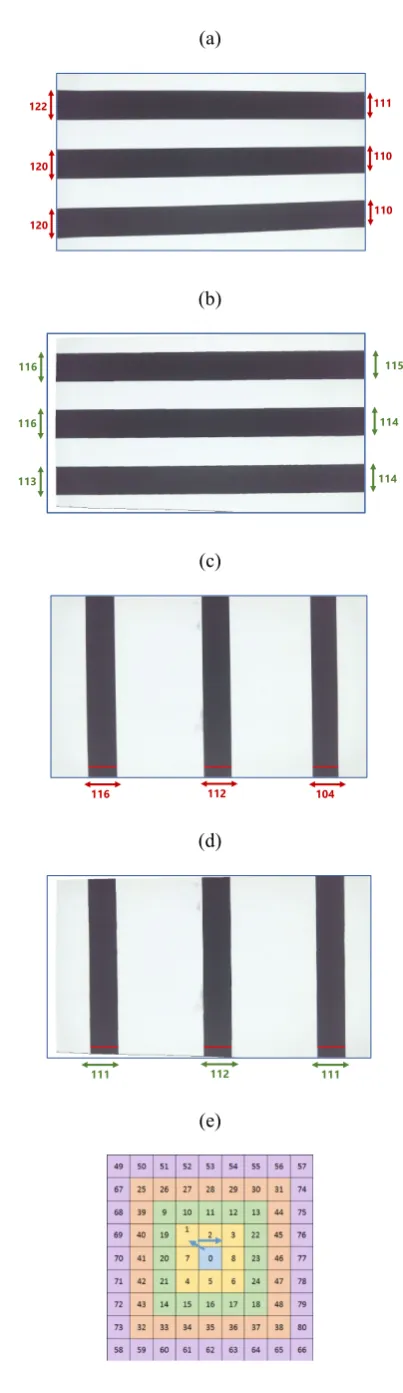
Figure 8. (a) Horizontal stripes before calibration; (b) Horizontal stripes after calibration; (c) Vertical stripes before calibration; (d) Vertical stripes after calibration; (e) Scanning scheme.
After calibration, the sizes of circles are the same at any position. The experiment result shows that the relative errors after compensation decreased sharply. Another experience with five rectangles having the same size and putting in random places in camera view as shown in Fig. 7(b). In Table 3, the shrinkage of picture is improved significantly.
In practice, it is hard and takes time to make the camera pointing vertically to the surface of object. So, to confirm the robustness of the proposed method, the camera is set up incline to the horizontal axis of object surface up to 4 degrees as in Fig. 7(c).
As seen in Fig. 8(a), in the input image, the left side of the horizontal stripes is bigger than the right one. After applying the proposed method for calibration, the result is shown in Fig. 8(b). It is clear that the algorithm still works well while the experimental sample set up with vertical stripes as seen in Figs. 8(c) and 8(d).
2.3. Image segmentation
The main process contains two times of segmentation. The first one is to separate the keypads out of the supplier. An adaptive segmentation using Otsu scheme [17] is utilized for both reference and input image. The second one is to take the white characters out of the buttons. As seen in Fig. 1, the background colors of buttons are not the same. So, after locating rectangle holding position of buttons in reference image, the local segmentation is carried out for each button. In this research, entropy segmentation methods [7 - 17] and a proposed method as in the below formula were compared to find out the best proper scheme.
(12)
Where maxG and minG are maximum and minimum, respectively, of gray value in local area. Finally, after analysing the stability and accuracy of the results, the proposed method was chosen for thresholding at each button in the reference image.
In the input image, to check whether the button is matching with the correct one in reference image, a correlation method was used. To take out the white characters, an adaptive segmentation method is carried out for each button as shown below.
Step 1: Estimate total number of bright pixels in rectangle holding reference button (Tpixel).
Step 2: In rectangle holding detected button, do thresholding with the threshold value of Thres_value = 255 - 1.
Step 3: Check whether number of bright pixels is equal or greater than Tpixel.
8
2.4. Automatic defect detection algorithm
To check for defects automatically, we tried to develop an algorithm that give the results as most accurate as possible.2.4.1. Defect detection method
We use an image of no-error keypad as a reference image. After that, we search for the positions of rectangle that is containing each single button in the keypad reference image. A file containing positions information will be stored for future use. After capturing an image, at each button, the matching method is used to check the matching of buttons in input image and reference image.
2.4.2. Correcting error generated by unequal height of buttons
As seen in Fig. 1, the size and height of buttons are unequal. So, depending on the position of keypad in keypad supplier, the distances from buttons to buttons are changeable. Thus, applying the positional relations of keypad buttons obtained from reference image to input image will lead to unexpected button positions. The reference image is captured while putting keypad in the center of keypad supplier. From practice, when putting keypad far away the center, the distance between buttons increases gradually from near buttons to far buttons. We proposed a method used to overcome this issue as shown as below.
2.4.3. Definitions
(x, y): position of rectangle holding a button in reference image.
(xe, ye): accumulated error in X and Y direction. Initialize: xe = 0, ye = 0.
(xr, yr): define new position of rectangle in detected image around position of rectangle in reference image. (xr, yr) are estimated based on the rule shown in Fig. 8(e). Initialize: xr = 0, yr = 0.
(x+xr+xe, y+yr+ye): position of rectangle in detected image.
2.4.4. Scanning Process
Step 1: go to the first rectangular position in reference image.
Step 2: do thresholding and check correlation inside two rectangles with size of (w, h) at (x, y) position in reference image and (x+xr+xe, y+yr+ye) position in detected image. The graylevel in each couple of corresponding pixels in both windows will be compared. If the number of matchings in both black and white is greater then correlation coefficient that can be changed by the users, a good button is found. And, the correlation coefficient used was 92%.
Step 3:
• If xr = 4 and yr = 4 and no matching was found, a defect is detected. Go to step 2 with next rectangular position.
• Else, matching is found. xe = xe + xr/2 and ye = ye + yr/2, go to step 2 with next rectangular position.
2.4.5. Detecting defects in mode 1: a keypad put in a quadrant
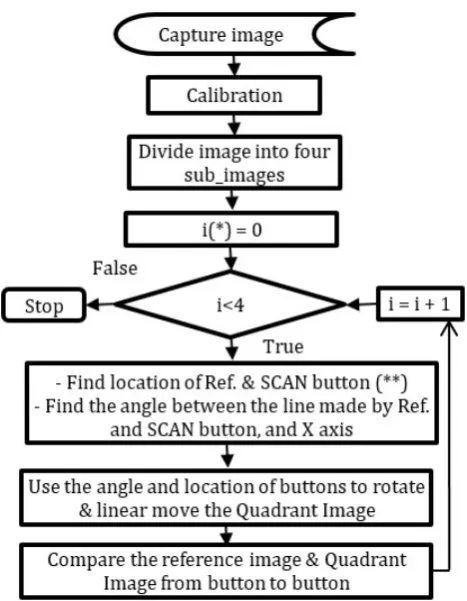
In our work, we decided to create two modes of operation. In mode 1, we divide the keypad supplier into quadrants. Detected keypads are put in quadrants of keypad supplier. Figure 9 shows the flowchart of the sequence used to determine the defect through the proposed method. In this mode, users spend more time to put the keypads into the quadrants.
As in the flowchart, firstly we capture the image. Then, we calibrate the input image by using the method proposed above. In each quadrant of the image, we search for the position of reference (Ref) and SCAN buttons. If both buttons are not found (non-existent keypad), we moved on to the next quadrant. If one of the two buttons is not found, we suppose an error existing in this keypad and move on to the next quadrant. In the quadrant with existing keypad, we determine the location of Ref & SCAN buttons. Then, using the relationship between Ref & SCAN buttons and the X-axis, we move and rotate the keypad so that keypad is placed horizontally. Finally, we conduct checking defection by comparing each single pixel in the buttons in both input image and reference image one by one.
Figure 9. Flowchart of the automatic defect detection in mode 1. (*): i count order of image. (**): in this project, Ref. and SCAN buttons were defined as two fixed reference buttons defined by user.
Figure 10.Flowchart of the automatic defect detection. (*): i counts order of image.
(a) (b)
(c) (d)
(e) (f)
(g) (h)
(i)
Figure 11. (a) Input image; (b) Resulting image after calibration; (c) Binary image & detecting the big blobs; (d)&(e)&(f) Resulting image after detecting type of keypads; (g)&(h)&(i) Resulting image after moving and rotating the keypads horizontally.
2.4.6. Detecting defects in mode 2: up to four keypads can be put anywhere in the keypad supplier
To reduce manipulation time, we recommend the second mode. In this mode, keypads are put anywhere in keypad supplier. Figure 10 shows the flowchart of the sequence used to determine the defect through the proposed method. Keypad supplier can contain up to 4 keypads, Fig. 11(a). First, after capturing the image, the calibration is carried out, Fig. 11(b). Then, thresholding is done using Otsu [17] method for extracting the keypads out of the background, Fig. 11(c). Closing morphology is then performed once with 5 x 5 rectangular mask. After that, to count the big blobs, labelling algorithm is performed. From big blobs, we separate one big blob into one separated image.
In each separated image, we fill small black blobs inside the big blob and replace pixel values of white blob by pixel values in input image as in Figs. 11(d), 11(e) and 11(f). And, we move the keypads into the center of image. Then, we search “SCAN” button inside the keypad. If no “SCAN” button existed, we move to the next separated image. Else, we calculate Pre_Angle angle between “SCAN” button and center of image. Then, we use Pre_Angle to rotate the keypad so that keypad is placed horizontally, Figs. 11(g), 11(h) and 11(i). After that, all buttons are checked defection by comparing the buttons one by one in both input image and reference image.
3. RESULTS AND DISCUSSION
10
keypad types to the program database by editing and saving the necessary characteristics.
3.1. Mode 1
In Fig. 12(a), four keypads are put in the keypad supplier. Three of them have defects that were highlighted by red rectangle superimposed over the buttons as shown in Fig. 12(b). Similarly, Figure 12(d) shows the results after checking defect in Fig. 12(c). The algorithm still works well even if there was no keypad in the quadrant or keypads are put in opposite directions.
3.2. Mode 2
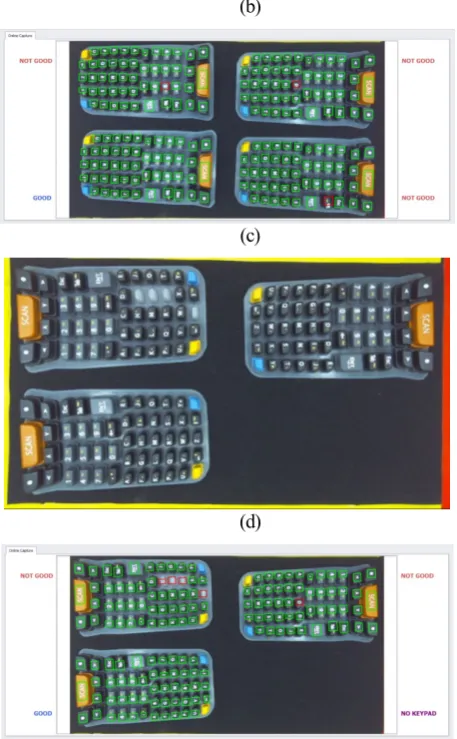
This mode is as an upgrade of mode 1. The technicians need less setting time than as in mode 1. So, the software needs to do more operations and also takes more time than previous mode. However, from practice, the time consumed for both modes is only slightly different. As in previous case, the proposed algorithm still works well when keypads are put at any position with any direction. Figs. 13(b) and 13(d) are the results of input images as in Figs. 13(a) and 13(c), respectively.
3.3. Economic efficiency of applying the
research in manufacturing
At companies surveyed, the workers had responsibility to check defection of rubber keypads by eyes. As statistic, for 52 button keypad, a worker needs about 30 seconds for detecting one keypad. However, there were still errors at about 10% over all. The final version of this research showed that it took only about 1.8 seconds to detect a patch of 4 keypads at the same time. The experiment was carried out hundreds of times and no error was found. This system will be applied for industrial companies in Saigon Hi-Tech Park Center, Ho Chi Minh City, Vietnam.
(a)
(b)
(c)
(d)
Figure 12. (a) Four input keypads; (b) Three input keypads; (c) Resulting image of (a) after applying mode 1 algorithm; (d) Resulting image of (c) after applying mode 1 algorithm.
(a)
(b)
(c)
(d)
Figure 13. (a) Two input keypads; (b) Resulting image of (a) after applying mode 2 algorithm; (c) Three input keypads; (d) Resulting image of (c) after applying mode 2 algorithm.
4. CONCLUSIONS
Using computer vision systems to assist in detecting defect of industrial products is used widely in the world. In this paper, a research was fully carried out to solve all issues related to defects of rubber keypad before manufacturing with the less time consumed. Besides, the authors proposed a quick calibration method without using a model for a wide-angle and low-cost lens camera. In this, the object’s surface will be bended to coincide with reference plane used in calibration process. So, the size of all same objects at any position in the image will be the same even if they are not put in the same plane. This method showed a significant
result and gave the chance for speeding up the whole process to real-time processing. A mobile computer-based system with two operation modes was developed and it showed significant results with 14 different types of keypads. The program also permits the users to easily add new types of keypads to the program database. The computing time for processing a patch of four keypads was around 1.8 and 2.3 seconds for mode 1 and mode 2, respectively as seen in table 4. Although the proposed algorithms worked successfully, further improvement in speeding up the whole process was carried out continuously.
Table 4.The time consuming in two modes.
Sample Time (ms)
Mode 1
Time (ms) Mode 2
1 1798 2280
2 1880 2410
3 1801 2365
4 1666 2131
5 1902 2479
6 1934 2472
7 1877 2301
8 1788 2258
9 1803 2210
10 1872 2410
Average 1832 2332
Acknowledgements.
We thank the Datalogic VietNam company in Ho Chi Minh City, Viet Nam for the use of their equipment.
REFERENCES
[1] Gang, C. D., Han, I. S., Lee, G. B., Lee, J. J., (2007) Keypad Inspection System of Cellular Phone, In Proceedings ofCGIV, 93-96.
[2] Klančar, G., Kristan, M., Karba, R. (2004) Wide-angle camera
distortions and non-uniform illumination in mobile robot tracking,
Robotics and Autonomous Systems,volume (46): 125-133. [3] Tiwari, U., Mani, U., Paul, S. (2015) Non-Linear Method Used For Distortion Correction Of Fish-eye Lens: Comparative Analysis Of Different Mapping Functions, In Proceedings of International Conference on Man and Machine Interfacing (MAMI).
12 [5] Ricolfe-Viala, C., José, A., Salmerón, S., (2010) Correcting non-linear lens distortion in cameras without using a model, Optics & Laser Technology, Volume(42): 628-639.
[6] Aritan, S., (2010) Efficiency of non-linear lens distortion models in biomechanical analysis of human movement,
MeasurementVolume (43): 739-746.
[7] Portes de Albuquerquea, M., Esquef, I. A., Gesualdi Mello, A. R., (2004) Image thresholding using Tsallis entropy, Pattern Recognition LettersVolume (25): 1059-1065.
[8] Lin, Q., Ou, C., (2012) Tsallis entropy and the long-range correlation in image thresholding, Signal ProcessingVolume (92): 2931-2939.
[9] Nie, F., Gao, C., Guo, Y., Gan, M., (2011) Two-dimensional minimum local cross-entropy thresholding based on co-occurrence matrix, Computers and Electrical EngineeringVolume (37): 757-767.
[10] Tang, K., Yuan, X., Sun, T., Yang, J., Gao, S., (2011) An improved scheme for minimum cross entropy threshold selection based on genetic algorithm, Knowledge-Based Systems Volume
(24): 1131-1138.
[11] Yin, P. Y., (2007) Multilevel minimum cross entropy threshold selection based on particle swarm optimization, Applied Mathematics and ComputationVolume (184): 503-513.
[12] Brink, A. D., (1996) Using spatial information as an aid to maximum entropy image threshold selection, Pattern Recognition LettersVolume (17): 29-36.
[13] Lan, J., Zeng, Y., (2013) Multi-threshold image segmentation using maximum fuzzy entropy based on a new 2D histogram, Optik Volume (124): 3756-3760.
[14] Tang, Y., Mu, W., Zhang, Y., Zhang, X., (2011) A fast recursive algorithm based on fuzzy 2-partition entropy approach for threshold selection, Neurocomputingvolume (74): 3072-3078. [15] Yu, H. Y., Zhi, X. B., Fan, J. L., (2015) Image segmentation based on weak fuzzy partition entropy, Neurocomputingvolume
(168): 994-1010.
[16] Zhou, J., Chen, L., Chen, C. L. P., Zhang, Y., Li, H. X., (2016) Fuzzy clustering with the entropy of attribute weights,
Neurocomputingvolume (198): 125-134.
[17] Otsu, N., (1979) A threshold selection method from grey level histogram, IEEE Transactions on Systems, Man, and Cybernetics Volume (9): 62-66.
[18] Ricolfe-Viala, C., Sanchez-Salmeron, A.J., (2011) Using the camera pin-hole model restrictions to calibrate the lens distortion model, Optics & Laser TechnologyVolume (43): 996-1005. [19] Sun, Q., Hou, Y., Chen, J., (2015) Lens distortion correction for improving measurement accuracy of digital image correlation,
OptikVolume (126): 3153-3157.
[20] Malis, E., Chaumette, F., Boudet, S., (1998) 2D 1/2 visual servoing stability analysis with respect to camera calibration errors,
IEEE/RSJVolume (2): 691-697.
[21] Gao, D. K., Wang, Y. Q., Zhou, C. L., Xu, Z. P., (2012) The 2D calibration error analysis and compensation in the visual measurement, In Proceedings of4th International Conference on Intelligent Human-Machine Systems and Cybernetics (IHMSC): 238-241.