J. Sens. Sens. Syst., 2, 19–26, 2013 www.j-sens-sens-syst.net/2/19/2013/ doi:10.5194/jsss-2-19-2013
©Author(s) 2013. CC Attribution 3.0 License.
Geoscientific Instrumentation Methods and Data Systems
Discussions
Geoscientific Instrumentation Methods and Data Systems
Open Access
Web Ecology
Open Access
Open
Access
JSSS
Journal of Sensors and Sensor Systems
Driving modes and material stability of a double
membrane rheometer and density sensor
B. Weiss, M. Heinisch, E. K. Reichel, and B. Jakoby
Institute of Microelectronics and Microsensors, Johannes-Kepler University, Linz, Austria
Correspondence to: B. Weiss (weiss [email protected])
Received: 13 December 2012 – Revised: 18 March 2013 – Accepted: 23 March 2013 – Published: 22 April 2013
Abstract. This contribution presents the analysis of an earlier proposed double membrane sensor for mea-suring mass density and rheological properties of liquids with respect to different driving modes. Concerning practical implementation the sensor mounting and the stability of the polyethylene foil, currently used as mem-brane material, are investigated. The sensor is based on two opposed memmem-branes vibrating in parallel where a sample liquid is enclosed between the membranes. The excitation and read-out mechanisms of the mem-brane vibration are based on Lorentz forces induced in a static magnetic field. Each memmem-brane carries three conductive paths for excitation, which can be separately connected to the excitation currents. This allows the excitation of the first and second modes of vibration and enables prestressing the second mode of oscillation. Analyzing the material-stability of the used polyethylene foil shows a strong long-term drift of the modulus of elasticity and an increase of internal damping with increasing temperature. Comparing the resonance frequency of the fundamental mode with earlier measurements achieved with the second mode of resonance indicates an increased sensitivity to density featuring a reasonably sustained quality factor for high viscosities. Thereby, the sensitivity can be adjusted by varying the distance between the membranes.
1 Introduction
In recent years an increasing need for in-line sensing of fluid parameters like mass density and viscosity in indus-trial and biomedical fields can be observed (Jakoby et al., 2009). Whereas conventional rheometers offer good mea-surement results and applicability in the laboratory environ-ment, miniaturized sensors are needed for the in-line fluid parameter monitoring. Among those, the vibrational behav-ior of e.g., tuning forks shows a high dependence on fluid properties with high coupling and cross-sensitivities among mass density and viscosity (Blaauweegers et al., 2007). On the other hand, capillary tube on-chip viscometers have been found to be an effective means for determining the shear viscosity of highly viscous liquids by means of evaluating the pressure drop necessary for inducing a laminar chan-nel flow (Lin et al., 2007; Chevalier and Ayela, 2008; Wang et al., 2010). Furthermore, viscosity variations may be de-termined by evaluating the propagation of acoustic waves through a microchannel filled with the test liquid (Choi et
(1/1) (2/1)
anti-sym.
sym.
Figure 1.The symmetrical and antisymmetrical vibration or the two opposed membranes in the fundamental (1/1) mode and in the second (2/1) mode.
473
Figure 1. The symmetrical and antisymmetrical vibration of the two opposed membranes in the fundamental (1/1) mode and in the second (2/1) mode.
and dynamic viscosityµ. The second mode of vibration, see Fig. 1, was analyzed in Heinisch et al. (2011) where diff er-ent sensitivities on density and viscosity for symmetric and antisymmetric excitation have been observed.
In the case of the symmetric mode of excitation, the induc-tion of shear waves in the sample liquid couples the fluid vis-cosity to the change of the membrane vibration characteris-tics. An analytical study of shear waves shows that the damp-ing force on the membrane depends on the square root of the dynamic viscosity times mass density √ρfµ(Kanazawa,
1997). Consequently, in order to determine the dynamic vis-cosity, the mass density needs to be obtained from a diff er-ent measuremer-ent. This poses the question if there are driv-ing modes of the double membrane configuration that are not characterized by this strong density–viscosity coupling.
In this contribution the previous membrane design is ex-tended by a third centered conductive excitation path. This offers, first, the excitation of the first mode of resonance. It will be shown that this mode is characterized by a high sensi-tivity to density at low viscous damping, where the sensisensi-tivity on viscosity depends on the sensor geometry and driving fre-quency. Second, a constant current through the center driving conductive path can be used to deflect and prestress the mem-brane, which changes the frequency of the second mode.
Miniaturizing viscosity and density sensors aims at the large-scale production and the application in industrial en-vironments. Therefore, also the topics of material stability, temperature dependency and long-term drift of the used ma-terial are addressed.
In Sect. 2 the sensor principle and the test arrangement are shown, the vibrational behavior is discussed in Sect. 3 and modeled in Sect. 4, the stability of the used PE foil is dis-cussed in Sect. 5, measurements of different driving modes are shown in Sect. 6, and Sect. 7 finally concludes the work.
Figure 2.In (a), the design of the PE membrane and the arrangement of the excitation and read-out paths are shown. (b) shows the assembly of the double membrane sensor and (c) depicts the measurement set–up.
474
Figure 2.In (a), the design of the PE membrane and the arrange-ment of the excitation and read-out paths are shown. (b) shows the assembly of the double membrane sensor and (c) depicts the mea-surement setup.
2 Sensor principle and fabrication
2.1 Composition and fabrication
20kHz 0
deflection
centered excitation
(1/3) (1/1)
(2/1) (2/3)
anti-symmetric excitation
f
B B
B
B
I
I
I
I
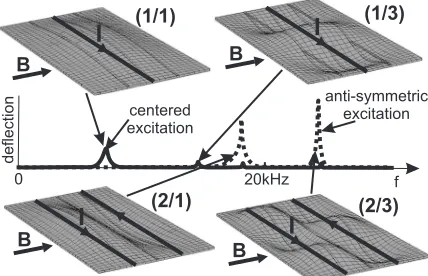
Figure 3.Shows modes of a single clamped membrane vibrating in vacuum - the numeric simulation is done with Comsol 4.1. The dashed line describes the response of the membrane to the excitation by the two excentric paths, where the (2/1) and the (2/3) modes are driven. Applying a harmonic current to the center–path excites the (1/1) and the (1/3) modes.
475
Figure 3.Shows modes of a single clamped membrane vibrating in vacuum – the numeric simulation is done with Comsol 4.1. The dashed line describes the response of the membrane to the excitation by the two excentric paths, where the (2/1) and the (2/3) modes are driven. Applying a harmonic current to the center-path excites the (1/1) and the (1/3) modes.
may be individually joined by external connection wires, see Fig. 2c.
2.2 Principle
In the presence of an external static magnetic field perpen-dicular to the electric paths, currents through the excitation path result in Lorentz forces that deflect the membrane. By means of harmonic currents through the paths, a vibration of the membrane is excited. The read-out mechanism is based on the measurement of voltage uindthat is induced in the
thin-ner read-out paths:
uind= Z
l
v×B·ds, (1)
where l, v and B are the total length of the read-out paths, the velocity vector of the vibrating electric path and the magnetic flux density, respectively.
2.3 Sensor arrangement and measurement setup The sensor is placed in a basin containing the test liquid be-tween two permanent magnets, which provide field strengths of up to 0.2 T, see Fig. 2c. Liquid laterally enters the gap between both membranes. The connection of the excitation paths, which determines the excited vibration mode, is figured by the connection wires. The excitation paths are con-nected to a function generator, where GPIB (General Purpose Interface Bus) controlled frequency sweeps with an ampli-tude of approximately 0.5 V are used to evaluate the fre-quency response of the membrane vibration. The induced read-out voltage is measured with a Stanford Research lock-in amplifier SR 830.
sample liquid
sample liquid
membrane deflection
a/2
d (a) 1 modest
(b) 2 modend
vertical motion
lateral motion
FC
emax
sam ple
liquid
simplified actual
x
u(x)
Figure 4.Qualitative two–dimensional flow between the two membranes, when vibrating antisymmetrically in the first (a) and in the second mode of vibration, (b).
476
Figure 4.Qualitative two-dimensional flow between the two mem-branes, when vibrating antisymmetrically in the first (a) and in the second mode of vibration (b).
3 Vibrational behavior
The vibration of the double membrane configuration can be regarded as the vibration of two single membranes that are coupled by external loads depending on the properties and the resulting flow of the adjacent liquid. The load consists of an added mass, which corresponds to the fluid mass that is periodically accelerated by the membrane vibration. The vis-cous loss caused by the periodic shear deformation of liquid layers adjacent to the membrane surface effects a damping of the membrane motion.
3.1 Vibration modes
By applying a time-harmonic electric current to the centered path, the longitudinal (1/1) and (1/3) modes are excited, see Fig. 3. The (n/m) mode therein describes the membrane vi-bration with the n-th mode in lateral and the m-th mode in longitudinal direction. The lateral (2/1) and (2/3) high fre-quency modes are excited by using the excentric paths. In practice, a slight asymmetry of the membrane shape or the driving currents causes that all modes may occur in spite of a selective excitation.
While the applicability of the higher order (2/1) vibration mode for the coupled viscosity–density sensing has already been proven (Heinisch et al., 2011), this paper proposes the use of the first (1/1) vibration mode for efficient mass-density sensing.
3.2 Liquid loading
see Fig. 4b, the flow is characterized by the superposition of the vertical motion and the lateral shear motion in the area between the two peaks. The lateral flow components trans-port liquid from the crest to the valley of the deflection. The amount of lateral shear components increases with the dis-tance between the two membranes.
The vertical fluid motion in the case of the fundamental mode vibration exerts two effects on the membrane. First, the fluid layer that is periodically moved between the two membranes acts as added mass that in addition to the mass of the membrane needs to be periodically accelerated by the driving force. Second, there is a shear force between adjacent vertical fluid layers. This force scales with the fluid viscosity and dampens the membrane vibration.
The comparision of the energies associated with the iner-tial and the viscous motion of the liquid is given in terms of the quality factor Qf, which describes the damping of the
resonant vibration due to the viscous liquid:
Qf=
ωWˆ0
kin
P0D
. (2)
Therein,ωis the angular velocity of the vibration, ˆW0
kin
de-scribes the peak kinetic energy of the liquid layer and P0D denotes the average power related to the dissipative vis-cous flow components over one period of oscillation, i.e., the power required to drive the two Couette flows, see Fig. 4a. The two components may easily be evaluated, if the de-flection shape of the membrane is approximated by a linear shape as shown in Fig. 4a. The primes (0) indicate that these quantities are given per unit length in z-direction in our 2-D model. In this case the vertical shear motion of neighboring fluid slices is described by a simple harmonic Couette flow. Therein,
Fc0(t)=dµ2
aωemaxsin(ωt) (3)
is the force per unit length needed to induce the Couette flow of one, e.g., the left half of the liquid layer featuring a width a/2, where emax, d and a are the maximum membrane
deflec-tion, the gap width between the membranes and the width of the membrane, respectively. The associated velocity in the membrane center is given by ωemaxsin(ωt), which, at
reso-nance, is in phase with the driving force. The corresponding dissipative power per unit length yields
PD=2 ω 2π
2π ω
Z
0
F0c(t)ωemaxsin(ωt) dt=2µ
d aω
2e2
max. (4)
Furthermore, we note that the peak velocity (at zero crossing) at position x is given by v(x)=emaxωax/2. Then, under the
same assumption of a simplified deflection shape, the kinetic energy per unit length that is associated with the inertial flow
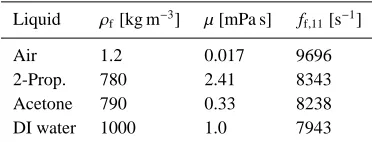
Table 1.Parameters of test fluids.
Liquid ρf[kg m−3] µ[mPa s] ff,11[s−1]
Air 1.2 0.017 9696
2-Prop. 780 2.41 8343
Acetone 790 0.33 8238
DI water 1000 1.0 7943
components is obtained as
ˆ Wkin0 =2
a 2 Z
0
1 2ρfd v(x)
2dx=a
6dρe
2 maxω
2. (5)
Evaluating the quality factor from Eq. (2) gives
Qf=
ωWˆ0
kin
PD =1
2 ρf
µωa2. (6)
Consequently, the Qf-factor decreases with the kinematic
viscosityµ/ρf, increases with the driving frequency and
in-creases quadratically with the width a of the membrane. As the fundamental mode of vibration has the greatest lateral ex-tension a this mode offers the highest Qf, i.e., high sensitivity
to mass density at low viscous damping.
In addition to the damping of the vibration due to the vis-cous liquid, the membrane is subjected to intrinsic damping in the used PE-membrane and damping due the glued mount-ing of the membrane on the conductor board. The mechan-ical damping Qmechis added to the fluid damping Qf in the
following way:
1 Qtot =
1 Qf +
1 Qmech
, (7)
yielding Qtot, which quantifies the total damping of the
brane vibration due to mechanical dissipation in the mem-brane and due to the liquid loading. Evaluating Qf for the
used test liquids given in Table 1 shows that Qf lies in the
order of 104–105. As the quality factor of the membrane
vi-bration is in the range of 101, see the measurements
repre-sented in Fig. 8 below, the damping of the membrane vibra-tion due to the fluid’s viscosity may be neglected in the case of a perfectly parallel first mode (1/1) vibration of the two membranes.
4 Modeling
4.1 Membrane vibration
for the resonance frequency of a thin membrane freely vi-brating at the n-th transversal mode and the m-th longitudinal mode, fixed at the four bordersω0,nm(Reddy, 2007):
ω0,nm = s
Dπ4
2ρmh
n
a+ m b
2
with (8)
D = EH
3
12(1−ν2). (9)
This interrelation predicts that the resonance frequency of the double membrane configuration decreases with increas-ing fluid density and gap width.
Here,ρm, E,νand b are the density of the membrane foil, Young’s modulus, Poisson’s ratio and the length of the mem-brane, respectively.
4.2 Liquid loading
Considering that the quality-factor due to the liquid loading Qfis in order of 104for the liquids to be measured, the effect
of the viscous damping on the resonance frequency can be neglected. The added mass of moved fluid layer can simply be regarded as an increased foil mass density, thereby each membrane has to carry half of the liquid mass:
ωf,nm=ω0,nm "
1+d 2h
ρf
ρm
#−12
=
s
Dπ4
2(ρmh+ρfd/2)
n
a+ m
b
2
. (10)
5 Material stability
The proposed sensor concept in principle can be imple-mented using different materials for the membrane. PE foils feature several advantages. First, due to their elasticity, the required driving current can be reduced. Second, they can be processed in a simple manner and would yield low cost in production. At the same time, polymer materials show ad-verse properties in terms of aging or mechanical stability in general compared to standard micromachining materials. In this section we report on corresponding investigations that have to be included when the feasibility of this technology is evaluated for a particular application.
To investigate the properties of the material as a mechan-ically vibrating component in a device, we decided to use a simpler vibrating structure in order to eliminate additional issues that are associated with the clamping of the mem-brane boundary and thus obtain a better insight on the ma-terial properties themselves. Thus, we studied the mechan-ical stability of the used polymer material by investigating the resonance properties of a simple cantilever operating in the fundamental mode of vibration. It is made of the same PE material and has similar geometrical dimensions as the mem-brane. Using a cantilever rather than a membrane reduces the influences associated with the clamping, which are expected to be another significant factor in case of a membrane.
220 240 260 280 300 320 340
0 0.2 0.4 0.6 0.8 1 1.2x 10
-5
250 260 270 280 290
0 0.2 0.4 0.6 0.8 1
1.2x 10
-5
f / s-1
u
/V
ind
(b) (a)
29.2°C
40.2°C increasing T
seven days aging
f / s-1
u
/V
ind
Figure 5.Analysis of the first vibration mode of a 12x4 mm PE cantilever. (a) shows the decrease of resonance frequency and quality factor due with membrane heating. In (b), the increase of the resonance frequency due to membrane aging is demonstrated.
477
Figure 5.Analysis of the first vibration mode of a 12×4 mm2PE cantilever. (a) shows the decrease of resonance frequency and qual-ity factor due to membrane heating. In (b), the increase of the reso-nance frequency due to membrane aging is demonstrated.
The used PE foil is subject to various effects that influence the material parameters and consequently the vibration be-havior of the sensor. Figure 5a shows that heating the mem-brane essentially lowers the resonance frequency. There may be various effects causing this decrease: (i), there is a heat induced decrease of the Young modulus of elasticity, and (ii) heating leads to a volumetric expansion of the cantilever, which also lowers the resonance frequency. When cooling down the device, these effects again decrease but there per-sists a small change of the resonance behavior indicating a persistent change of the polymer structure.
Figure 5b shows that aging has a substantial effect on the membrane vibration characteristics. Within one week of ag-ing in ambient conditions the resonance frequency increases by 4 %. It is supposed that aging caused a volatilization of the softening agents present in the foil. This may influence the resonance frequency in two ways. First, this diffusion de-creases the area density of the foil. Second, the absence of the softeners leads to an increased modulus of elasticity.
Considering the heating of the membrane, Joule heating may be of great relevance. Typical parameters of a path re-sistance of R=5Ω and a driving voltage of V=0.5 V rms results in a heating power of PH=V2/R=0.05 W. If we
Figure 6. Normalized induced voltage over the excitation frequency, comparing the vibration in air and in DI water, see (a). In (b), the frequency response for the vibration in air is analyzed for the case that a pre-stress is applied to the foil by means of a bias current on the centered electrode path.
478
Figure 6. Normalized induced voltage over the excitation fre-quency, comparing the vibration in air and in DI water, see (a). In (b), the frequency response for the vibration in air is analyzed for the case that a prestress is applied to the foil by means of a bias current on the centered electrode path.
0.7 K, if water with a heat capacity of cp=4.19 kJ kg−1K is taken as test liquid.
This is only a very crude estimate of course. On the one hand, the liquid is not thermally insulated from the environ-ment (as implicitly assumed here), on the other hand, there will be temperature differences between the membrane and the bulk of the liquid. So if larger measurement times are required, the local heating of the fluid enclosed by the mem-branes needs to be considered, i.e., the temperature of the actually measured fluid sample can be significantly different from the ambient temperature. In those cases pumping of the liquid can reduce the effects of local heating without aff ect-ing the sensect-ing process.
6 Measurements
6.1 Second mode of vibration with constant prestress First, the standard vibration of the (2/1) mode is analyzed. In order to eliminate the influence of mutual influences be-tween two membranes, which due to fabrication tolerances are not completely equal, this measurement has been carried out in a single membrane configuration (Weiss et al., 2011) in ambient air. Figure 6a shows the resulting vibration charac-teristics. Concerning the applicability of this vibration mode for fluid sensing it has to be regarded that upon immersion in water the membrane features lower resonance frequencies, a lower resonance peak and a lower quality factor compared to
7500 8000 8500 9000 9500 10000
8 8.5 9 9.5 10 10.5
air 2-Prop. Acetone DI water
f / Hz
|u
|/µV
ind
(b)
(a)
arg(u
)
ind
7500 8000 8500 9000 9500 10000
-2.2 -2.1 -2 -1.9 -1.8 -1.7
air 2-Prop. Acetone DI water
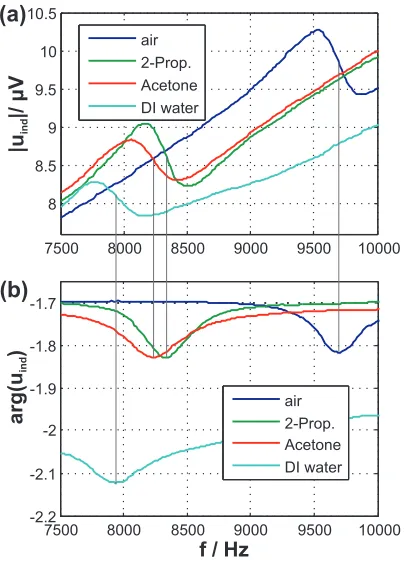
Figure 7.Amplitude (a) and phase (b) of the frequency response of the double-membrane sensor for various test liquids.
479
Figure 7.Amplitude (a) and phase (b) of the frequency response of the double-membrane sensor for various test liquids.
the vibration in air. A detailed analysis of the respective in-teraction between test liquid and membrane has been carried out (Reichel et al., 2009).
When applying a constant current to the centered path in addition to the harmonic current through the excentric paths, the membrane is prestressed while vibrating in the second mode. Measurements show two effects for this driving mode, see Fig. 6b. Firstly, with increasing bias current the amplitude of the (2/1) mode decreases whereas the peak of the (1/3) mode increases. Secondly, prestressing the membrane shifts the (2/1) mode to slightly higher frequencies.
It is shown that prestressing influences the vibration char-acteristics but the desired frequency shift is too small to use this effect for sensor calibration or to change the sensitivity.
6.2 First mode of vibration
0 200 400 600 800 1000 7500
8000 8500 9000 9500 10000
f
/H
z
res
density / kg m-3
air measurements
Acetone 2-Prop.
DI wat.
analytic evaluation
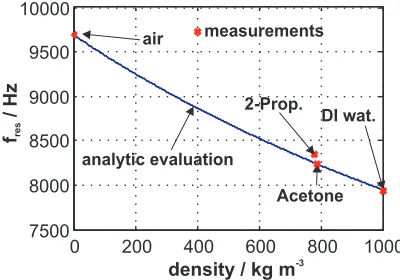
Figure 8.Measured resonance frequencies of different fluids and the respective predictions using Eqn. 10, where the Young modulus of the membrane has been fitted to meet the resonance frequency in air.
480
Figure 8.Measured resonance frequencies of different fluids and the respective predictions using Eq. (10), where the Young modulus of the membrane has been fitted to meet the resonance frequency in air.
the fundamental mode instead of the second mode yields a higher sensitivity to mass density and a recognizable res-onance peak – also for liquids like 2-propanol featuring a somewhat higher viscosity of 2.41 mPa s. The height of the resonance peak scarcely depends on the fluid’s viscosity.
Figure 8 shows how the above measurements agree with the estimation made in Eq. (10). We can see that the val-ues for the vibration in acetone and DI (deionized) water are well reproduced by the prediction, which only accounts for the fluid density. The measured resonance frequency for 2-propanol, the fluid with the highest viscosity, is higher than the predicted value. Due to the filling procedure of the test cell and the good wetting properties of the used test liquids, the formation of air bubbles, which would have decreased the added mass, can be excluded. It is thus assumed that the res-onance frequency is increased by the component of viscous shear motion of vertical fluid layers, see Fig. 4.
In accordance with the discussion in Sect. 5, other influ-ences like the membrane heating and aging have been ob-served to essentially influence the vibration behavior. First, an increase of the resonance frequency has been observed in agreement with the measurements carried out with the can-tilever. Second, it has been observed that heating essentially decreases the magnitude of vibration. Supposedly, the heat-ing led to a volumetric expansion of the foil, the resultheat-ing buckling probably inhibited the free membrane vibration.
6.3 Varying the sensitivity range
When operating in air, the membranes vibrate almost uncou-pled, thus, the distance between them virtually does not in-fluence the vibrational behavior. Immersed in a liquid, the vibration of the two membranes is coupled and the gap width determines the amount of liquid load that is moved. Conse-quently, the resonance frequency essentially depends on the gap width between the membranes, see Eq. (10). In Fig. 9 the influence of the gap width on the frequency shift in
compar-0 100 200 300
7000 8000 9000 10000
Acetone
DI water
d/µm
f
/s
f,
1
1
-1
air x...measurement
o...estimation
Figure 9.Shows the resonance frequency of the (1/1) mode versus the gap–width d between the membranes for the vibration in air, Acetone and water. Measurements are indicated with an (x) and estimations using Eqn. 10 are marked by the lines and the (o).
481
Figure 9.Shows the resonance frequency of the (1/1) mode ver-sus the gap-width d between the membranes for the vibration in air, acetone and water. Measurements are indicated with an (x) and estimations using Eq. (10) are marked by the lines and the (o).
ison to the uncoupled vibration in air is given for DI water, and acetone. The three gap widths have been slightly adapted to fit the measurements. As a result, the measured frequency shift between acetone and DI water is properly reproduced by the above estimation for both fluids, see Fig. 9. An increas-ing gap width increases the frequency shift. Consequently, by varying this distance, the sensitivity of the sensor on density variations of the test liquids, i.e.,∆fr/∆ρf, can be adjusted.
7 Conclusions
The double membrane sensors presented earlier (Reichel et al., 2007) were investigated with respect to additional driv-ing modes. Furthermore, the material stability of the used PE foil was studied. It turned out that aging of the foil essen-tially increases the modulus of elasticity resulting in higher resonance frequencies. In contrast, heating of the membrane increases the internal friction and results in a volumetric ex-pansion of the foil yielding lower resonance frequencies and reduced quality factors. It can be concluded that other mate-rials like glass or new silver membranes need to be used in order to achieve a long-term stable application in large-scale use.
by the small influence of the fluid viscosity, the frequency of the first vibrational mode decreases with [1+ρfd/ρm2h]−1/2. This relation and respective measurements reveal that the sensitivity to fluid density∆ff,11/∆ρf can be adapted by
ad-justing the gap width.
Hence, by using the fundamental mode of vibration, the double membrane sensor is capable of density sensing featur-ing an adjustable sensitivity. The next aim is a decoupled de-termination of fluid density and viscosity by means of evalu-ating the fundamental driving mode and a higher order mode, which is characterized by a higher sensitivity on viscosity.
Acknowledgements. The authors would like to thank Bernhard Mayrhofer for the membrane fabrication and Johann Katzenmayer for manufacturing mechanical components of the setup. This work was supported by the Austrian Center of Competence in Mechatronics (ACCM).
Edited by: M. J. da Silva
Reviewed by: two anonymous referees
References
Blaauwgeers, R., Blazkova, M., Clovecko, M., Eltsov, V. B., de Graaf, R., Hosio, J., Krusius, M., Schmoranzer, D., Schoepe, W., Skrbek, L., Skyba, P., Solntsev, R. E., and Zmeev, D. E.: Quartz tuning fork: thermometer, pressure- and viscometer for helium liquids, J. Low Temp. Phys., 146, 537–562, 2007.
Chevalier, J. and Ayela, F.: Microfluidic on chip viscometers, Rev. Sci. Instr., 79, 076102, doi:10.1063/1.2940219, 2008.
Choi, S., Moon, W., and Lim, G.: A micro-machined viscosity-variation monitoring device using propagation of acoustic waves in microchannels, J. Micromech. Microeng., 20, 085034, doi:10.1088/0960-1317/20/8/085034, 2010.
Heinisch, M., Reichel, E. K., Dufour, I., and Jakoby, B.: A resonat-ing rheometer usresonat-ing two polymer membranes for measurresonat-ing liq-uid viscosity and mass density, Sens. Act. A: Phys., 172, 82–87, 2011.
Jakoby, B., Beigelbeck, R., Keplinger, F., Lucklum, F., Nie-dermayer, A., Reichel, E. K., Riesch, Ch., Voglhuber-Brunnmaier, T., and Weiss, B.: Miniaturized sensors for the vis-cosity and density of liquids – performance and issues, IEEE Trans. on Ultrason., Ferroelec., and Freq. Contr., 57, 111–120, 2010.
Kanazawa, K. K.: Mechanical behaviour of films on the quartz mi-crobalance, Faraday Discuss., 107, 77–90, 1997.
Kanazawa, K. K. and Gordon, J. G.: Frequency of a quartz mi-crobalance in contact with liquid, Analyt. Chem., 57, 1770–1771, 1985.
Lin, Y. Y., Lin, C. W., Yang, L. J., and Wang, A. B.: Micro-viscometer based on electrowetting on dielectric, Electrochim. Acta, 52, 2876–2883, 2007.
Reddy, J. N.: Theory and analysis of elastic plates and shells, CRC Press, Taylor and Francis, 2nd Edn., 2006.
Reichel, E. K., Riesch, Ch., and Jakoby, B.: A novel combined rheometer and density meter suitable for integration in microflu-idic systems, Proc. IEEE Sensors, 908–911, ISBN: 1-4244-1262-5, 2007.
Reichel, E. K., Riesch, Ch., Keplinger, F., and Jakoby, B.: Modeling of the fluid–structure interaction in a fluidic sensor cell, Sens. Act. A: Phys., 156, 222–228, 2009.
Voglhuber-Brunnmaier, T., Reichel, E. K., and Jakoby, B.: Char-acterization of a novel membrane-rheometer utilizing a semi-numerical modelling approach in the spectral domain, Sens. Act. A: Phys., 162, 310–315, 2010.
Wang, J. N. and Tang, J. L.: An optical fiber viscometer based on long-period fiber grating technology and capillary tube mecha-nism, Sensors, 10, 11174–11188, 2010.