University of New Hampshire
University of New Hampshire Scholars' Repository
Affiliate Scholarship
Center for Coastal and Ocean Mapping
1991
GRAPE Density Records and Density Cyclicity
Eystein Jansen
University of Bergen
Larry A. Mayer
University of New Hampshire
, [email protected]
Shipboard Scientific Party
Follow this and additional works at:
https://scholars.unh.edu/ccom_affil
Part of the
Oceanography and Atmospheric Sciences and Meteorology Commons
, and the
Sedimentology Commons
This Conference Proceeding is brought to you for free and open access by the Center for Coastal and Ocean Mapping at University of New Hampshire Scholars' Repository. It has been accepted for inclusion in Affiliate Scholarship by an authorized administrator of University of New Hampshire Scholars' Repository. For more information, please [email protected].
Recommended Citation
13. GRAPE DENSITY RECORDS AND DENSITY CYCLICITY
1E. Jansen,
2L. Mayer,
3and Shipboard Scientific Party
4The gamma-ray attenuation porosity evaluator (GRAPE) component of the multisensor track (MST) unit on board the
JOIDES Resolution measures the saturated bulk density of sedi-ments by relating the attenuation of gamma rays in a core sam-ple to that of a standard with known density (aluminum). After reaching thermal equilibrium, unsplit core sections are routinely run through the MST system. The sampling density chosen for the MST during Ocean Drilling Program (ODP) Leg 130 (about 2-3 cm) provides a near-continuous measurement of sediment density by means of the GRAPE equal to a resolution of 0.5-3 k.y, depending on the sedimentation rate.
Comparisons of GRAPE density values with discrete labora-tory density measurements and downhole density logs show that absolute GRAPE density estimates are higher than both labora-tory and logging density measurements; however, the downhole trends in the density data are very coherent. The constant offset between the GRAPE data and density measurements made by other means indicates that the offset is a function of the calibra-tion of the GRAPE system. The extremely high sample resolu-tion of the GRAPE makes it possible to use these data for a number of purposes:
1. To perform hole-to-hole correlations at a specific site, eval-uating the continuity of the recovered section over core breaks. This provides a rapid method for splicing sections from one hole into missing sections in another hole or, alternatively, to evaluate possible double coring of a particular interval. GRAPE correlations can be made to depths as great as 300 m below sea-floor (mbsf)> well beyond the depth of useful magnetic suscepti-bility measurements.
2. To perform fine-scale, site-to-site correlations, especially in intervals with high signal-to-noise ratios or identifiable vari-ability patterns.
3. To provide high-resolution records of environmental vari-ations. Density variations in pelagic sediments are driven by changes in dissolution, winnowing, and dilution of carbonate by terrestrial material and opal; they therefore reflect pale-oceanographic and paleoclimatic conditions.
The raw GRAPE data for Sites 803-807 were checked for quality, using the GRAPEFIX routine on the shipboard VAX computer system. Because of the slow passage of the section through the MST system required by magnetic susceptibility mea-surements, a number of GRAPE density measurements were of-ten performed at a particular level. Multiple measurements were
The raw GRAPE data commonly display very low densities in the upper portions of a core. In most cases, these low-density intervals correspond to intervals that contain disturbed and soupy sediments or flow-in.
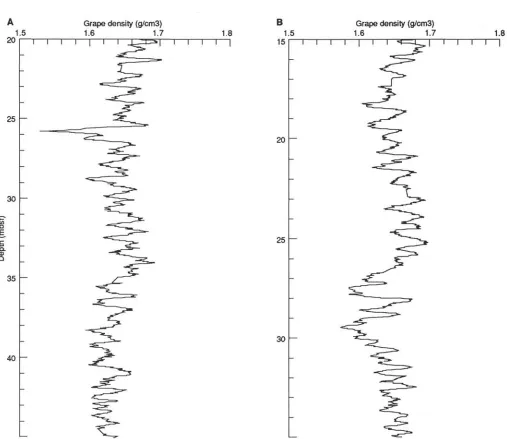
As a first pass, an additional set of GRAPE data files were produced in which data points that came from intervals de-scribed as disturbed by the visual core description were elimi-nated. This was done for the section cored with the advanced hydraulic piston corer (APC) of at least one hole at each site, and it effectively eliminates most of the apparent variance re-lated to coring disturbance. To increase the signal-to-noise ratio further, these data were smoothed by a 10-point Gaussian filter; the smoothed data sets are displayed in Figures 1 and 2. As is seen in Figure 1, there is no clear evidence of cyclicity at the core length interval (9.5 m), indicating that most of the distur-bance signal that results from core breaks has been removed. In some cases, however, the upper parts of some cores still retain anomalously low densities, probably a result of subtle coring disturbances that are not obvious to visual examination.
Despite clear hole-to-hole and site-to-site differences in the GRAPE records, the high-frequency variations in the GRAPE records indicate that there is strong potential for detailed hole-to-hole as well as site-to-site correlations. Preliminary shipboard studies based on the visual correlation of GRAPE records indi-cate that, in particular, the upper ~ 100 m of the section are the most promising for correlation as they display the highest am-plitudes and have intervals with distinct variability patterns. In Figure 2, we have plotted records from Holes 806B and 807A, which roughly cover the interval from 1 to 2 Ma, based on ship-board biostratigraphy. It is evident from this example that the density variations at the two sites show essentially the same pat-tern over this interval, with a very regular cyclic appearance.
E. JANSEN, L. A. MAYER, SHIPBOARD SCIENTIFIC PARTY
1.5 Grape density (g/cm
3)
1.6 1.7 1.8 B Grape density (g/cm
3)
1.6 1.7 1.8
1
300 —
350 1— 601
Figure 1. GRAPE density data from Hole 806B plotted vs. sub-bottom depth. A. The upper 350 mbsf. B. Blown-up section with detail of the interval from 30 to 60 mbsf. The data are smoothed by a 10-pt Gaussian filter.
men ted. Shipboard work, however, has already established the large potential for extremely high-resolution records of environ-mental change that can be extracted from the GRAPE.
REFERENCES
Imbrie, J., Hays, J. D., Martinson, D. G., Mclntyre, A., and Mix, A. C , 1984. The orbital theory of Pleistocene climate: support from a revised chronology of the marine δ1 8θ record. In Berger, A.,
Im-brie, J., Hays, J., Kukla, G., and Salzman, B. (Eds.), Milankovitch and Climate: Understanding the Response to Astronomical Forcing
(Vol. 1): Dordrecht-Boston-Lancaster (D. Reidel Publ. Co.), 269-305. Ruddiman, W. R., Raymo, M., and Mclntyre, A., 1986. Matuyama 41,000-year cycles: North Atlantic Ocean and Northern Hemisphere ice sheets. Earth. Planet. Sci. Lett., 80:117-129.
201.5
Grape density (g/cm3)
1.6 1.7 1.8
25
30
35
40
i l l i l l I I I
B Grape density (g/cm3) 15 16 1.7 151 i i i i i i r
1.8
20
25
30
l I I I
E. JANSEN, L. A. MAYER, SHIPBOARD SCIENTIFIC PARTY
100.00
10.00
1.00
0.10
0.01
wSj?ECMAP Stack IΘ 806B GRAPE
Coherency
100K50K 25K 16.6K 12.5K
0.1
0.01
0.001
10"4
0.04 0.08 0.12 0.16 Frequency (cycles/sample interval)
0.21 05
Figure 3. Example of a cross-spectral analysis of the smoothed GRAPE record from the upper 25 mbsf in Hole 806B vs. the global stack of trop-ical planktonic δ1 8θ (SPECMAP stack; Imbrie et al., 1984). The