Immunization Coverage Levels Among 19- to 35-Month-Old Children in 4
Diverse, Medically Underserved Areas of the United States
Jorge Rosenthal, PhD, MC*; Lance Rodewald, MD*; Mary McCauley, MTSC*; Stephen Berman, MD‡; Matilde Irigoyen, MD§; Mark Sawyer, PhD储; Hussein Yusuf, MBBS*; Ronald Davis, PhD¶; and
Graham Kalton, PhD#
ABSTRACT. Background. The National
Immuniza-tion Survey demonstrates that naImmuniza-tional immunizaImmuniza-tion coverage in 2002 remained near the all-time highs achieved in 2000. However, that survey cannot detect whether coverage is uniformly high within relatively small areas or populations. The measles resurgence in the early 1990s revealed that coverage was low in some areas, particularly among inner-city children from racial and ethnic minority groups. Today, identifying areas with low childhood-vaccination coverage remains important, particularly if these areas are at risk for the introduction of disease. In 1995, the Centers for Disease Control and Prevention launched a congressionally mandated dem-onstrated project now called the Childhood Immuniza-tion DemonstraImmuniza-tion project of Community Health Net-works. This mandate specified an assessment to determine whether a network of primary care providers affiliated with university teaching hospitals could as-sume a public health responsibility for raising immuni-zation levels among preschoolers in medically under-served communities. Communities with federally designated health professional shortage areas were in-vited to submit proposals, and 4 were selected: Detroit, MI, New York, NY, San Diego, CA, and rural Colorado.
Objectives. To measure immunization coverage among preschool children in the 4 selected medically underserved areas and determine predictors of coverage levels.
Design and Setting. Surveys in the 4 areas were based on stratified cluster probability sample designs in which clusters of dwelling units were selected and all house-holds in selected clusters were screened for the presence of children aged 12 to 35 months. Immunization histories were obtained from parents and providers for these chil-dren. For each age-eligible child, the information col-lected on utilization of immunization health services in-cluded a listing of all clinics or offices ever used for the child’s well-child care and/or for obtaining immuniza-tions. Information was also collected on whether the child currently had health insurance (public and/or pri-vate) and whether the child had a medical home. A child
was classified as having a medical home if the survey respondent reported a source of well care that was the same as the source of sick care and that this place was not an emergency department.
Participants. Children 12 to 35 months of age in De-troit, New York, San Diego, and rural Colorado.
Outcome Measure. Community-wide up-to-date (UTD) immunization coverage levels at 19 to 35 months of age, defined as receipt of 4 doses of diphtheria and tetanus toxoids and pertussis vaccine, 3 doses of poliovi-rus vaccine, 1 dose of measles, mumps, and rubella vac-cine, 3 doses ofHaemophilus influenzaetype B vaccine, and 3 doses of hepatitis B vaccine (the 4:3:1:3:3 series).
Analysis. We examined the association between cov-erage level and independent variables and performed2
and t tests to determine whether differences observed within and between groups and sites were significant.
Results. The overall response rate for eligible chil-dren ranged from 79.4% to 88.1%. Coverage levels for most individual vaccines were>90% in all sites except Detroit. Coverage for the 4:3:1:3:3 series was significantly higher for children in New York (84%) and San Diego (86%) than for children in Detroit (66%) and rural Colo-rado (75%). Demographic risk factors related to UTD immunization status varied by site. Although differences in coverage levels by ethnicity varied by site, differences were not significant. In Colorado and New York, cover-age was slightly lower among Hispanic than white chil-dren (71% vs 76% and 83% vs 91%, respectively). In San Diego, coverage was lower among whites, compared with Hispanics (76% vs 85%). Coverage was also lower for African American than white children only in New York (75% vs 91%). However, in San Diego and Colorado, children receiving their vaccinations from private pro-viders had lower coverage levels than children receiving their vaccinations from other providers (78% vs 91% and 71% vs 57%, respectively). In all 4 sites, children for whom respondents reported having an immunization card at the time of the interview were more likely to have higher series coverage levels than children for whom a parent-held card was not available. Also, children who were UTD at 3 months of age had significantly higher vaccination-series coverage levels than children who were not UTD at 3 months of age. In addition, the vac-cination coverage was lower for children in Detroit whose parents reported problems accessing the health care system because lack of transportation (46%), com-pared with those who did not report such problems (65%); however, this difference did not reach significance (2ⴝ6.0). In Colorado, the small proportion of children
in families without a phone had a lower vaccination coverage level (58%) than those in households with a phone (75%) (2 ⴝ6.3). In all sites, children who were
UTD at 3 months of age and had a parent-held
vaccina-From the *National Immunization Program, Centers for Disease Control and Prevention, Atlanta, Georgia; ‡Department of Pediatrics, University of Colorado and Children’s Hospital, Denver, Colorado; §Division of Pediat-rics, Columbia University, New York, New York;储Department of Pediatrics, University of California, San Diego, California; ¶Center for Health Promo-tion and Disease PrevenPromo-tion, Henry Ford Hospital, Detroit, Michigan; and #Division of Research, Westat, Rockville, Maryland.
Received for publication Jun 6, 2003; accepted Nov 12, 2003.
Address correspondence to Jorge Rosenthal, PhD, MC, National Immuni-zation Program, Centers for Disease Control and Prevention, MS-E86, 1600 Clifton Rd, Atlanta, GA 30333. E-mail: [email protected]
tion card were more likely to be UTD at 19 to 35 months of age.
Conclusions. Preschoolers in these medically under-served areas were not at uniform risk for underimmuni-zation. Because they were designated as health profes-sional shortage areas, the 4 sites in this study were expected to have low immunization-coverage rates. How-ever, this was not the case. In fact, coverage in 3 of the 4 areas was quite high compared with US national figures (73%); only Detroit had a much lower UTD rate (66%). Efforts are needed to improve methods to identify areas with low immunization coverage so that resources can be directed to places where interventions are needed. Our results reveal that an area’s need for childhood immunization interventions is not well predicted by a low number of providers per capita. Other criteria must be developed to predict areas or populations with low immunization coverage. Understanding more about the characteristics of children/provider pairs for children who are UTD at 3 months and more about the role of parental hand-held cards, along with finding strategies to improve immunization delivery by providers in Vac-cines for Children Program facilities, suggest potentially productive avenues for increasing and sustaining high coverage levels.Pediatrics2004;113:e296 –e302. URL: http: //www.pediatrics.org/cgi/content/full/113/4/e296; immu-nization coverage levels, medically underserved areas, pre-school children.
ABBREVIATIONS. CDC, Centers for Disease Control and Preven-tion; CHN, Community Health Networks; HPSA, health profes-sional shortage areas; UTD, up to date; WIC, US Department of Agriculture Special Supplemental Nutrition Program for Women, Infants, and Children; VFC, Vaccines for Children Program; DTP, diphtheria and tetanus toxoids and pertussis vaccine; MMR, mea-sles/mumps/rubella vaccine; Hib,Haemophilus influenzaetype B vaccine; HepB, hepatitis B vaccine; 4:3:1:3:3 series, 4 doses of DTP, 3 doses of poliovirus vaccine, 1 dose of MMR, 3 doses of Hib, and 3 doses of HepB.
T
he National Immunization Surveydemon-strates that vaccination of US preschoolers in 2001 remained near the all-time highs achieved in 2000. However, the results do not imply that cov-erage is uniformly high in all areas.1–3 Although
incidence of vaccine-preventable diseases is low, identifying any areas with low childhood-vaccina-tion coverage (commonly referred to as “pockets of need”) remains important. This is particularly true of urban areas, because such areas have the highest risk of transmission if disease is introduced.4 The
result of low coverage among inner-city children was illustrated by the measles resurgence in the early 1990s.5,6 Of course, identifying pockets of need is a
prerequisite for implementing any program de-signed to raise immunization coverage to assure that such a disease resurgence does not recur.
In 1995, the Centers for Disease Control and Pre-vention (CDC) launched a congressionally mandated demonstration project now called the Childhood Im-munization Demonstration project of Community Health Networks (CHN). This mandate specified an assessment to determine whether a network of pri-mary care providers affiliated with university teach-ing hospitals could assume a public health responsi-bility for raising immunization levels among preschoolers in medically underserved communities.
Communities with federally designated health pro-fessional shortage areas (HPSAs) were invited to submit proposals, and 4 were selected: Detroit, Mich-igan; New York, New York; San Diego, California; and rural Colorado.
We report the results of 4 independent population-based surveys conducted by the CDC in 1997–1999 to assess baseline immunization coverage among pre-school children in these 4 medically underserved areas. This is the first study to produce comparable immunization coverage estimates for several under-served communities. We also present predictors of immunization coverage levels and discuss implica-tions for identifying pockets of need and implement-ing programs to raise coverage.
METHODS Target Population
The 4 participating sites in the CHN project were designated as HPSAs5 because each area had a critical shortage of primary health care providers. HPSAs are defined as areas with a popula-tion-to-provider ratio ofⱖ3500 to 1, areas adjoining these under-served areas, or areas in which residents must travel⬎30 minutes to the nearest provider.7,8Urban areas eligible to be considered in this project were census tracts with a population of at least 100 000 that included a designated HPSA and any contiguous census tracts in which a majority of residing children⬍2 years old were eligible for Medicaid. Eligible rural areas were defined as nonmet-ropolitan or rural areas that were beyond a metnonmet-ropolitan statistical area6and in which most residents were members of traditionally underserved minority populations: African Americans, Alaska Natives, American Indians, Asian Americans, Latinos/Hispanics, and Pacific Islanders.
Household Surveys
Surveys in the 4 areas were based on stratified cluster proba-bility sample designs in which clusters of dwelling units were selected and all households in selected clusters were screened for the presence of children 12 through 35 months old.9,10The surveys were approved by the Institutional Review Board of the CDC in Atlanta, Georgia.
Household Interviews
Standardized interviews were conducted with primary caretak-ers of the age-eligible children in the sample households to obtain information on sociodemographic characteristics, utilization of immunization health services, utilization of federal programs, pa-rental knowledge and beliefs about vaccination, and perceived barriers to accessing the immunization health care system.11–13
For each age-eligible child, the information collected on utili-zation of immuniutili-zation health services included a listing of all clinics or offices ever used for the child’s well-child care and/or for obtaining immunizations. Information was also collected as to whether the child currently had health insurance (public and/or private) and whether the child had a medical home. A child was classified as having a medical home if the survey respondent reported a source of well care that was the same as the source of sick care and that this place was not an emergency department.
The information collected about the utilization of federal pro-grams encompassed aid received from the US Department of Agriculture Special Supplemental Nutrition Program for Women, Infants, and Children.
The questions asked about barriers to care included availability of transportation and vaccine costs incurred by parents. Because studies of access to immunization health services have shown that up-to-date (UTD) immunization status at 3 months is a good indicator of early access to the health care system, we also con-structed this indicator for use as potential predictor variable.3,5
Immunization Record
recording form. If an immunization record was not available, the interviewer completed the immunization section of the question-naire based on the respondent’s recall. In such cases, respondents did not report specific dates for the immunizations and often responded “all shots,” or they reported that they did not know the child’s immunization history. All respondents were asked for permission to contact the child’s immunization providers. If this permission was granted, providers were sent a request for the child’s immunization record and information about the practice (including whether the facility was a Vaccines for Children Pro-gram [VFC] facility). All providers were surveyed. When 1 of a child’s providers supplied a complete record from birth, follow-up to collect data from other providers was discontinued.
Vaccination History
If a child’s parent-held records and provider records did not agree, we credited each child with all shots listed in either record. If no provider or parent-held record was available, the child’s vaccination status was classified as unknown; a report from recall was not accepted without confirmation from a provider.
Analytical and Statistical Methods
Community-wide immunization coverage levels were esti-mated for each area and measured as UTD for immunization at 19 to 35 months of age for comparability with the National Immuni-zation Survey. UTD at 19 to 35 months of age was defined as receipt of 4 doses of diphtheria and tetanus toxoids and pertussis vaccine (DTP), 3 doses of poliovirus vaccine, 1 dose of measles/ mumps/rubella vaccine (MMR), 3 doses ofHaemophilus influenzae
type b vaccine (Hib), and 3 doses of hepatitis B vaccine (HepB); these doses constitute the 4:3:1:3:3 series. We also measured UTD status for each antigen, ie, 4 doses of DTP; 3 of poliovirus vaccine, Hib, and HepB; and 1 of MMR. UTD at 3 months was defined as the receipt of 1 dose each of DTP, poliovirus vaccine, Hib, and HepB.
All estimates were weighted to represent the target populations in each of the selected sites. The weights account for unequal selection probabilities that occurred in the fieldwork in a few cases and also compensate for nonresponse by households and provid-ers.
We assessed the UTD coverage level of children at each site separately. We examined the association between UTD coverage level and each factor and performed2andttests to determine whether differences observed within and between sites were sig-nificant. The statistical analyses accounted for the clustered sam-ple designs. To minimize the probability of a type I error, onlyP
values of⬍.01 were considered significant. Analyses were con-ducted by using SUDAAN, a family of statistical procedures for analysis of data from complex sample surveys.14
RESULTS Response Rates
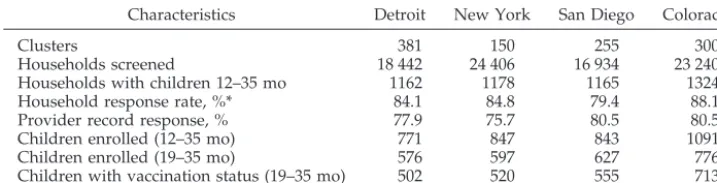
As shown in Table 1, 150 to 381 clusters were selected randomly in the 4 study sites, a total of 16 304 to 23 706 household units were screened in the sampled clusters in each area, and responding households yielded data for 771 to 1091 children 12 to 35 months of age. The overall enrollment response rate for eligible children ranged from 79.4% to 88.1%. Across all 4 sites, 7% of children enrolled had no
provider to contact for immunization information. The remaining children had an average of 2 provid-ers. In total, 4905 provider questionnaires were fielded, of which 78.2% were returned. Provider re-ports were obtained for 88.2% of children for whom a provider was contacted.
As a result of missing hand-held records and miss-ing provider information, immunization status was classified as unknown for some enrolled children. Table 1 shows that the overall response rate for vac-cination status ranged from 70.5% to 81.5% across the 4 sites.
Population characteristics that might predispose children to have low immunization coverage varied from site to site (Table 2). Most study children in Detroit were African American, and most in New York, San Diego, and rural Colorado were Hispanic. Teen motherhood was lowest in Detroit. Maternal education was notably lower in San Diego. Most study families lived in poverty, with the exception or rural Colorado. In all sites, approximately three quarters of the families with an age-eligible child had
ⱖ2 children.
Population characteristics that enable access to health care also varied. Income was highest in Col-orado. Overall, most children were insured. In De-troit, New York, and San Diego, 48% to 64% of children were privately insured, whereas in Colo-rado, 52% of children were insured by Medicaid or Civilian Health and Medical Program of the Uni-formed Services. All study sites had an appreciable proportion of children with no insurance (7%–22%). Most of the children had been or were enrolled at the time in WIC and did not have out-of-pocket expenses for vaccinations. The vast majority of children had a medical home, and children in these communities had received immunizations from private, public, and other providers (hospital outpatient clinics and a mix of private and public providers). A majority of children in Detroit and New York had only 1 immu-nization provider, whereas the majority of children in Colorado and San Diego had at least 2. Overall, a large proportion of children (80%– 88%) received their immunization services from providers in VFC facilities. However, 11.6% and 9.6% of children in Detroit and San Diego reported problems accessing the health care system because of transportation problems. Out-of-pocket expenses were paid for im-munization services for nearly 47% of children in Colorado.
TABLE 1. Survey Participation in the Community Health Network Study by Site
Characteristics Detroit New York San Diego Colorado
Clusters 381 150 255 300
Households screened 18 442 24 406 16 934 23 240
Households with children 12–35 mo 1162 1178 1165 1324
Household response rate, %* 84.1 84.8 79.4 88.1
Provider record response, % 77.9 75.7 80.5 80.5
Children enrolled (12–35 mo) 771 847 843 1091
Children enrolled (19–35 mo) 576 597 627 776
Children with vaccination status (19–35 mo) 502 520 555 713
Vaccination Coverage Rates in the Study Sites
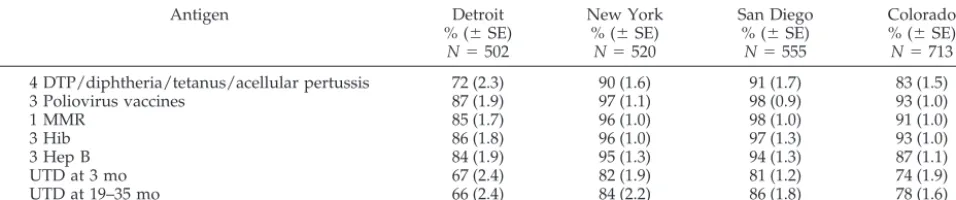
In New York and San Diego, all estimates of im-munization coverage for DTP, poliovirus vaccine,
Hib, and MMR among preschoolers were at least 90% (Table 3). For single antigens, coverage for 4 doses of DTP in Colorado fell below 90%. In Detroit, TABLE 2. Distribution of Population by Sociodemographic and Health Care Utilization Characteristics and Standard Errors (⫾SE) Among Children 12 to 35 Months Old by Site: CHN 2001
Detroit % (⫾SE)
N⫽771
New York % (⫾SE)
N⫽847
San Diego % (⫾SE)
N⫽843
Rural Colorado % (⫾SE)
N⫽1091 Predisponing factors
Ethnicity
White 8.9 (1.6) 10.2 (1.8) 21.1 (2.3) 50.8 (2.1)
African American 78.2 (2.5) 20.3 (2.9) 6.5 (1.1) 0.3 (0.2)
Hispanic 10.8 (2.2) 67.2 (3.2) 66.6 (3.2) 47.9 (2.2)
Other 2.1 (0.6) 2.3 (0.6) 5.7 (1.2) 0.9 (0.3)
Mother’s age
⬍20 y 28.1 (1.9) 47.5 (2.1) 40.2 (2.1) 39.9 (1.4)
20–29 y 13.7 (1.7) 8.7 (1.0) 10.0 (1.2) 6.6 (0.7)
ⱖ30 y 58.2 (2.1) 43.7 (1.9) 49.8 (2.3) 53.5 (1.7)
Mother’s education
⬍High school 28.8 (2.0) 32.9 (1.9) 44.0 (3.1) 24.1 (2.0)
High school 40.0 (2.0) 28.1 (2.0) 23.4 (2.0) 28.1 (1.3)
⬎High school 31.2 (1.8) 39.1 (2.3) 32.5 (2.7) 47.8 (1.9)
Poverty level
Above 40.6 (2.3) 38.2 (3.3) 46.6 (3.2) 63.6 (1.8)
Below 59.4 (2.3) 61.8 (3.3) 53.4 (3.2) 36.4 (1.8)
No. of children⬍18 y
1 20.9 (1.8) 25.2 (2.0) 22.5 (1.9) 24.2 (1.4)
2 27.2 (1.7) 35.6 (2.5) 30.9 (1.7) 37.3 (1.5)
ⱖ3 51.9 (2.1) 39.0 (2.9) 46.6 (2.4) 38.5 (1.7)
Enabling factors Income
⬍$15,000 60.2 (2.2) 64.7 (2.7) 55.9 (2.9) 36.3 (1.7)
$15,000–$29,999 25.1 (1.9) 18.1 (1.9) 25.5 (1.7) 36.0 (1.7)
ⱖ$30,000 14.7 (1.7) 17.2 (2.4) 18.5 (2.6) 27.7 (1.6)
Insurance
Private 64.3 (2.2) 61.1 (2.5) 47.9 (2.0) 30.1 (1.8)
Public 28.2 (1.9) 25.7 (2.5) 29.8 (2.8) 52.4 (1.8)
None 7.5 (1.1) 13.2 (1.2) 22.3 (2.0) 17.5 (1.2)
Medical home
Yes 93.9 (1.1) 95.0 (0.7) 92.9 (1.0) 85.4 (1.2)
No 6.1 (1.1) 4.9 (0.7) 7.1 (1.0) 14.6 (1.2)
Facility type
Private 23.4 (1.7) 36.9 (2.7) 27.6 (2.5) 30.0 (1.6)
Public 25.8 (1.9) 18.1 (2.3) 27.9 (3.0) 35.3 (1.7)
Other 13.9 (1.4) 7.4 (1.3) 24.6 (1.9) 26.4 (1.4)
Mixed 36.9 (2.1) 37.6 (1.3) 19.8 (2.1) 8.3 (1.0)
No. of providers
1 66.6 (2.1) 76.5 (1.9) 47.8 (2.7) 43.8 (1.9)
ⱖ2 33.4 (2.1) 23.5 (1.9) 52.1 (2.7) 56.2 (1.9)
VFC facility
Yes 84.1 (1.6) 87.6 (1.7) 80.2 (2.4) 80.9 (1.8)
No 11.6 (1.4) 11.7 (1.7) 12.3 (1.9) 8.9 (1.1)
Mixed 4.3 (0.9) 0.7 (0.6) 7.6 (1.9) 10.2 (1.3)
WIC
Yes 78.7 (1.8) 80.5 (2.4) 75.7 (2.5) 29.5 (1.6)
No 21.3 (0.8) 19.5 (2.4) 24.3 (2.5) 70.5 (1.6)
Residential moves
0 48.9 (1.9) 64.3 (3.2) 39.6 (2.4) 47.7 (1.7)
1 24.9 (2.0) 21.7 (1.7) 28.4 (2.2) 28.5 (1.4)
ⱖ2 26.2 (1.9) 13.9 (2.5) 32.0 (2.1) 23.8 (1.4)
Phone at home
Yes 86.4 (1.6) 90.8 (2.2) 90.4 (1.3) 90.8 (1.2)
No 13.6 (1.6) 9.2 (2.2) 9.5 (1.3) 9.2 (1.2)
Hand-held card
Yes 64.9 (2.6) 90.3 (1.6) 84.1 (1.9) 72.2 (1.4)
No 35.1 (2.6) 9.7 (1.6) 15.9 (1.9) 27.8 (1.4)
Transportation problems
No 88.4 (1.2) 97.9 (0.5) 90.4 (1.4) 94.9 (0.7)
Yes 11.6 (1.2) 2.1 (0.5) 9.6 (1.4) 5.1 (0.7)
Cost of last immunization
None 87.7 (1.3) 86.3 (1.8) 86.0 (1.8) 53.0 (1.9)
$1–$500 9.3 (1.1) 9.4 (1.2) 12.2 (1.6) 30.2 (1.6)
coverage for these antigens lagged, with coverage as low as 72% for 4 doses of DTP. Of note, the lowest coverage for HepB was 84% for Detroit, well above the goal of 70% established for the year 2000.
Coverage for the 4:3:1:3:3 vaccine series (UTD at 19 –35 months) was lower and varied significantly across sites (2⫽44.51; degrees of freedom⫽3;P⬍
.0001), with coverage in Detroit (66%) being lower than in San Diego (86%), New York (84%), and Col-orado (75%).
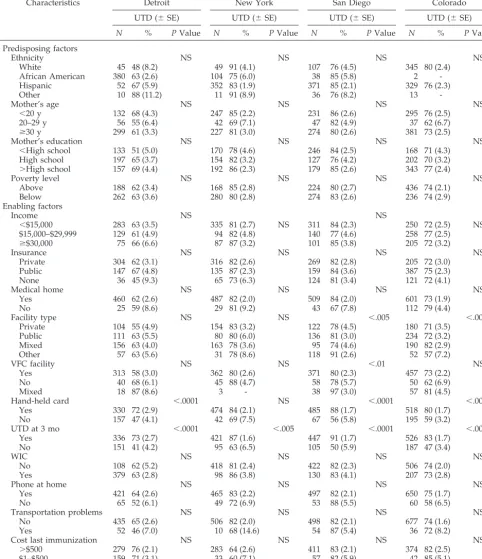
Table 4 displays the percentage of children UTD at 19 to 35 months by selected factors. Although differ-ences in coverage levels by ethnicity varied by site, differences were not significant. In Colorado and New York, coverage was slightly lower among His-panic than white children (71% vs 76% and 83% vs 91%, respectively). In San Diego, coverage was lower among whites, compared with Hispanics (76% vs 85%). Coverage was also lower for African American than white children only in New York (75% vs 91%). In San Diego and Colorado, vaccination coverage levels varied significantly by type of health facility. In fact, children in San Diego who received all vac-cinations from a private provider had lower vaccina-tion coverage levels than children receiving their vaccinations from the “other” category of providers (78% vs 91%; t ⫽ ⫺3.25; P ⬍ .005); in Colorado, coverage was lower among children receiving vac-cines from private providers than among children receiving vaccines from the “mixed” category of pro-viders (71% vs 82%;t⫽ ⫺3.04;P⬍ .005).
In all 4 sites, children for whom respondents re-ported having an immunization card at the time of the interview were more likely to have higher series coverage levels than children for whom a parent-held card was not available. Also, children who were UTD at 3 months of age had significantly higher vaccination-series coverage levels than children who were not UTD at 3 months of age. In addition, the vaccination coverage was lower for children in De-troit, whose parents reported problems accessing the health care system because lack of transportation (46%), compared with those who did not report such problems (65%); however, this difference did not reach significance (2⫽ 6.0;P ⫽ not significant). In
Colorado, the small proportion of children in fami-lies without a phone had a lower vaccination cover-age level (58%) than those in households with a phone (75%) (2⫽ 6.3;P⫽ not significant).
DISCUSSION
Because they were designated as HPSAs, the 4 sites in this study were expected to have low immu-nization coverage rates. However, this was not the case. In fact, coverage in 3 of the 4 areas was quite high when compared with US national figures (73%)3; only Detroit had a much lower UTD rate at
66%. Efforts are needed to improve methods to iden-tify areas with low immunization coverage so that resources can be directed to places at which inter-ventions are needed.
Our results reveal that an area’s need for child-hood immunization interventions is not well pre-dicted by a low number of providers per capita. HPSA status may predict areas in which acute care, prenatal care, or elder care is suboptimal, but, as others have noted, HPSA criteria cannot be assumed to predict problems of access to the health care sys-tem that translate into low immunization cover-age.15,16
Our findings are positive with regard to the estab-lishment of the concept and practice of a medical home for childhood health care. In our study,⬎95% of children had a usual source of care, and⬎80% of providers participated in VFC. Moreover, being in poverty was not associated with low immunization coverage, attesting to the success of renewed empha-sis on immunization (particularly infrastructure is-sues) that began with the Childhood Immunization Initiative.17
UTD status at 3 months and parent-held cards were shown to be strong predictors for being UTD at 19 to 35 months of age. These factors, in combination with the variation in coverage by race/ethnicity and by VFC providers practiced in VFC facilities, suggest potentially productive avenues for research. Addi-tional studies should identify parental and provider attitudes and practices that influence immunization. Among the questions that require additional under-standing are: What are the parental characteristics and behaviors that support early and sustainable linkage with the health care system? What are the provider characteristics and behaviors that motivate parents to make early and sustainable linkages with the health care system? More needs to be learned about the transactions between patient and provider as well as the environmental factors that influence quality of care that leads to early and sustainable parent-clinician relationships.
The area-sample method with household screen-TABLE 3. Up-to-Date Single Antigen and Combination Series 4:3:1:3:3 Coverage and Standard Error (⫾SE) Among Children 19 to 35 Months Old by Site: CHN 2001
Antigen Detroit
% (⫾SE)
N⫽502
New York % (⫾SE)
N⫽520
San Diego % (⫾SE)
N⫽555
Colorado % (⫾SE)
N⫽713 4 DTP/diphtheria/tetanus/acellular pertussis 72 (2.3) 90 (1.6) 91 (1.7) 83 (1.5)
3 Poliovirus vaccines 87 (1.9) 97 (1.1) 98 (0.9) 93 (1.0)
1 MMR 85 (1.7) 96 (1.0) 98 (1.0) 91 (1.0)
3 Hib 86 (1.8) 96 (1.0) 97 (1.3) 93 (1.0)
3 Hep B 84 (1.9) 95 (1.3) 94 (1.3) 87 (1.1)
UTD at 3 mo 67 (2.4) 82 (1.9) 81 (1.2) 74 (1.9)
ing used here is feasible and necessary to conclu-sively identify pockets of underimmunization. How-ever, better methods are needed for determining where this intensive research method may be ap-plied most productively. We recommend that local health officials be relied on to direct research to areas that they suspect are at risk for low coverage. If local health authorities suspect low coverage in a specific population, in-depth evaluation and continued
mon-itoring of vaccination coverage in the community can avert deterioration of coverage and accumulation of susceptible children.
A more-systematic and relatively inexpensive method to preliminarily identify pockets of need is to review immunization histories in school records. These immunization records are an indication of the children’s vaccination status at 19 to 35 months of age. If these reviews show a pattern of delayed im-TABLE 4. UTD Coverage Levels for the Combination Series 4:3:1:3:3 and Standard Errors (SE) by Population and Health Services Characteristics Among Children 19 to 35 Months Old by Site: CHN 2001
Characteristics Detroit New York San Diego Colorado
UTD (⫾SE) UTD (⫾SE) UTD (⫾SE) UTD (⫾SE)
N % PValue N % PValue N % PValue N % PValue
Predisposing factors
Ethnicity NS NS NS NS
White 45 48 (8.2) 49 91 (4.1) 107 76 (4.5) 345 80 (2.4)
African American 380 63 (2.6) 104 75 (6.0) 38 85 (5.8) 2
-Hispanic 52 67 (5.9) 352 83 (1.9) 371 85 (2.1) 329 76 (2.3)
Other 10 88 (11.2) 11 91 (8.9) 36 76 (8.2) 13
-Mother’s age NS NS NS NS
⬍20 y 132 68 (4.3) 247 85 (2.2) 231 86 (2.6) 295 76 (2.5)
20–29 y 56 55 (6.4) 42 69 (7.1) 47 82 (4.9) 37 62 (6.7)
ⱖ30 y 299 61 (3.3) 227 81 (3.0) 274 80 (2.6) 381 73 (2.5)
Mother’s education NS NS NS NS
⬍High school 133 51 (5.0) 170 78 (4.6) 246 84 (2.5) 168 71 (4.3)
High school 197 65 (3.7) 154 82 (3.2) 127 76 (4.2) 202 70 (3.2)
⬎High school 157 69 (4.4) 192 86 (2.3) 179 85 (2.6) 343 77 (2.4)
Poverty level NS NS NS NS
Above 188 62 (3.4) 168 85 (2.8) 224 80 (2.7) 436 74 (2.1)
Below 262 63 (3.6) 280 80 (2.8) 274 83 (2.6) 236 74 (2.9)
Enabling factors
Income NS NS
⬍$15,000 283 63 (3.5) 335 81 (2.7) NS 311 84 (2.3) 250 72 (2.5) NS
$15,000–$29,999 129 61 (4.9) 94 82 (4.8) 140 77 (4.6) 258 77 (2.5)
ⱖ$30,000 75 66 (6.6) 87 87 (3.2) 101 85 (3.8) 205 72 (3.2)
Insurance NS NS NS NS
Private 304 62 (3.1) 316 82 (2.6) 269 82 (2.8) 205 72 (3.0)
Public 147 67 (4.8) 135 87 (2.3) 159 84 (3.6) 387 75 (2.3)
None 36 45 (9.3) 65 73 (6.3) 124 81 (3.4) 121 72 (4.1)
Medical home NS NS NS NS
Yes 460 62 (2.6) 487 82 (2.0) 509 84 (2.0) 601 73 (1.9)
No 25 59 (8.6) 29 81 (9.2) 43 67 (7.8) 112 79 (4.4)
Facility type NS NS ⬍.005 ⬍.005
Private 104 55 (4.9) 154 83 (3.2) 122 78 (4.5) 180 71 (3.5)
Public 111 63 (5.5) 80 80 (6.0) 136 81 (3.0) 234 72 (3.2)
Mixed 156 63 (4.0) 163 78 (3.6) 95 74 (4.6) 190 82 (2.9)
Other 57 63 (5.6) 31 78 (8.6) 118 91 (2.6) 52 57 (7.2)
VFC facility NS NS ⬍.01 NS
Yes 313 58 (3.0) 362 80 (2.6) 371 80 (2.3) 457 73 (2.2)
No 40 68 (6.1) 45 88 (4.7) 58 78 (5.7) 50 62 (6.9)
Mixed 18 87 (8.6) 3 - 38 97 (3.0) 57 81 (4.5)
Hand-held card ⬍.0001 NS ⬍.0001 ⬍.0001
Yes 330 72 (2.9) 474 84 (2.1) 485 88 (1.7) 518 80 (1.7)
No 157 47 (4.1) 42 69 (7.5) 67 56 (5.8) 195 59 (3.2)
UTD at 3 mo ⬍.0001 ⬍.005 ⬍.0001 ⬍.0001
Yes 336 73 (2.7) 421 87 (1.6) 447 91 (1.7) 526 83 (1.7)
No 151 41 (4.2) 95 63 (6.5) 105 50 (5.9) 187 47 (3.4)
WIC NS NS NS NS
No 108 62 (5.2) 418 81 (2.4) 422 82 (2.3) 506 74 (2.0)
Yes 379 63 (2.8) 98 86 (3.8) 130 83 (4.1) 207 73 (2.8)
Phone at home NS NS NS NS
Yes 421 64 (2.6) 465 83 (2.2) 497 82 (2.1) 650 75 (1.7)
No 65 52 (6.1) 49 72 (6.9) 53 88 (5.5) 60 58 (6.5)
Transportation problems NS NS NS NS
No 435 65 (2.6) 506 82 (2.0) 498 82 (2.1) 677 74 (1.6)
Yes 52 46 (7.0) 10 68 (14.6) 54 87 (5.4) 36 72 (8.2)
Cost last immunization NS NS NS NS
⬎$500 279 76 (2.1) 283 64 (2.6) 411 83 (2.1) 374 82 (2.5)
$1–$500 159 71 (3.1) 33 60 (7.1) 57 82 (5.9) 42 85 (5.1)
None 94 78 (3.9) 4 - 6 - 15 73 (11.3)
munization among preschoolers, additional re-sources can be directed to verify and correct a prob-lem in coverage among young children.18,19Another
method to identify immunization pockets of need is immunization registries. Registries, when complete and functional, are tools that can be used for map-ping coverage levels in communities on a real-time basis.
Unlike some vaccination coverage assessments that use only data verified by providers, our method of determining coverage for each child combined vaccination history from all available sources. Al-though most providers responded, some of them did not have any information on vaccination coverage for children without parent-held cards. We cannot exclude the possibility that inadequacies in the clin-ical records for the populations we studied may have biased our results among sites with the lowest pro-vider response rates (Detroit and New York).
Although the nation as a whole attains immuniza-tion coverage levels sufficient to block disease trans-mission, pockets of susceptibility may act as poten-tial reservoirs of infection.20 –22 Polio and measles
no longer circulate in the United States, but disease may be imported from abroad. Transmission of im-ported disease in undervaccinated populations may threaten the success of disease-elimination efforts. Thus, studies such as this one are important to es-tablish whether undervaccination is a problem in specific communities.11,23,24
CONCLUSIONS
Although the vaccination coverage was high for HPSA children in Colorado, New York, and San Diego, it was low in Detroit. A priority is to identify other underserved areas such as Detroit that are lagging in vaccination coverage and ensure that high coverage is attained and maintained.25 Household
surveys are too expensive and labor intensive for routine use. Therefore, proven methodologies must be reintroduced to monitor vaccination coverage among population subgroups or small geographic areas. Several methodologies are available for the review of immunization histories such as school records or the use of population-based registries for which functional registries exist. These methodolo-gies may be a more-practical approach unless train-ing local interviewers can be demonstrated as a fea-sible alternative.
ACKNOWLEDGMENTS
We gratefully acknowledge Dr Susan Chu for careful review of this article and suggestions that helped refine our conclusions.
REFERENCES
1. McCauley MM, Luman ET, Barker LE, Rodewald LE, Simpson DM, Szilagi PG. The National Immunization Survey. Information for action.
Am J Prev Med. 2001;20(4 suppl):1–2
2. Simpson DM, Ezzati-Rice TM, Zell ER. Forty years and four surveys: how does our measuring measure up?Am J Prev Med. 2001;20(4 suppl): 6 –14
3. Centers for Disease Control and Prevention. National, State, and urban area vaccination coverage levels among children aged 19 –35 months–United States, 2001.MMWR Morb Mortal Wkly Rep. 2002;51: 664 – 666
4. Santoli JM, Setia S, Rodewald LE, O’Mara D, Gallo B, Brink E. Immu-nization pockets of need: science and practice.Am J Prev Med. 2000;19(3 suppl):89 –98
5. Bobo JK, Gale JL, Thapa PB, Wassilak SGF. Risk factors for delayed immunization in a random sample of 1163 children from Oregon and Washington.Pediatrics. 1993;91:308 –314
6. Guyer B, Hughart N, Holt E, et al. Immunization coverage and its relationship to preventive health care visits among inner-city children in Baltimore.Pediatrics. 1994;94:53–58
7. Division of Shortage Designation, Bureau of Primary Health Care. Selected Statistics on Health Professions Shortage Areas. Washington DC: Health Resources Service Administration; 1997
8. Division of Shortage Designation, Bureau of Primary Health Care. Health Professional Shortage Areas. Washington, DC: Health Services Resource Agency; 1994
9. Kish L.Survey Sampling. New York, NY: Wiley; 1960:230 –260 10. Morrow AL, Rosenthal J, Lakkis DH, et al. A population-based study of
access to immunization among urban Virginia children served by pub-lic, private, and military health care systems. Pediatrics. 1998;101(2). Available at: www.pediatrics.org/cgi/content/full/101/2/e5 11. Rosenthal J, Raymond D, Morita J, et al. African-American children are
at risk of a measles outbreak in an inner-city community of Chicago, 2000.Am J Prev Med. 2002;23:195–199
12. Rosenthal J, Morrow AL, Butterfoss FD, Stallings V. Design and baseline results of an immunization community intervention trial in Norfolk, Virginia.Pediatr Ann. 1998;27:418 – 423
13. Aday LA, Andersen RM. A framework for the study of access to medical care.Health Serv Res. 1974;9:208 –220
14. Shah BV, Barnwell BG, Bieler GS. Statistical methods and mathematical algorithms used in SUDAAN. Research Triangle Park, NC: Research Triangle Institute; 1997
15. Bernstein AB, Taylor KA. The use and availability of medical care in health manpower shortage areas.Inquiry. 1983;20:369 –380
16. General Accounting Office.Health Care Shortage Areas: Designations Not a Useful Tool for Directing Resources to Underserved. Washington, DC: Health and Human Services; 1995:200
17. Orenstein W, Rodewald LE. Successful control of vaccine-preventable disease requires more than vaccines.Am J Prev Med. 2000;19(3 suppl): 13–14
18. Schlenker TL, Bain C, Baughman AL, Hadler SC. Measles herd immu-nity. The association of attack rates with immunization rates in pre-school children.JAMA. 1992;267:823– 825
19. Lifson AR, Roddy M, Ehresmann KR. The association of poverty and low immunization rates in ZIP code areas. A retrospective survey of Minnesota kindergartners.Minn Med. 2000;83(8):51–55
20. Nokes DJ, Anderson RM. Measles, mumps, and rubella vaccine: what coverage to block transmission?Lancet. 1988;2(8624):1374
21. Fine PE. Herd immunity: history, theory, practice.Epidemiol Rev. 1993; 15:265–302
22. De Serres G, Gay NJ, Farrington CP. Epidemiology of transmissible disease after elimination.Am J Epidemiol. 2000;151:1039 –1048 23. Kenyon TA, Matuck MA, Stroh G. Persistently low immunization
cov-erage among inner-city preschool children despite access to free vac-cine.Pediatrics. 1998;101:612– 616
24. Fairbrother G, Friedman S, DuMont KA, Lobach KS. Markers for pri-mary care: missed-opportunities to immunize and screen for lead and tuberculosis by private physicians serving large numbers of inner-city Medicaid-eligible children.Pediatrics. 1996;97:785–790
DOI: 10.1542/peds.113.4.e296
2004;113;e296
Pediatrics
Irigoyen, Mark Sawyer, Hussein Yusuf, Ronald Davis and Graham Kalton
Jorge Rosenthal, Lance Rodewald, Mary McCauley, Stephen Berman, Matilde
Diverse, Medically Underserved Areas of the United States
Immunization Coverage Levels Among 19- to 35-Month-Old Children in 4
Services
Updated Information &
http://pediatrics.aappublications.org/content/113/4/e296
including high resolution figures, can be found at:
References
http://pediatrics.aappublications.org/content/113/4/e296#BIBL
This article cites 19 articles, 4 of which you can access for free at:
Subspecialty Collections
_sub
http://www.aappublications.org/cgi/collection/vaccine:immunization Vaccine/Immunization
b
http://www.aappublications.org/cgi/collection/infectious_diseases_su Infectious Disease
following collection(s):
This article, along with others on similar topics, appears in the
Permissions & Licensing
http://www.aappublications.org/site/misc/Permissions.xhtml
in its entirety can be found online at:
Information about reproducing this article in parts (figures, tables) or
Reprints
http://www.aappublications.org/site/misc/reprints.xhtml
DOI: 10.1542/peds.113.4.e296
2004;113;e296
Pediatrics
Irigoyen, Mark Sawyer, Hussein Yusuf, Ronald Davis and Graham Kalton
Jorge Rosenthal, Lance Rodewald, Mary McCauley, Stephen Berman, Matilde
Diverse, Medically Underserved Areas of the United States
Immunization Coverage Levels Among 19- to 35-Month-Old Children in 4
http://pediatrics.aappublications.org/content/113/4/e296
located on the World Wide Web at:
The online version of this article, along with updated information and services, is
by the American Academy of Pediatrics. All rights reserved. Print ISSN: 1073-0397.