Original Research Article
Risk factors for dietary deficiency and their probable role in elderly
morbidities: a cross sectional study among elderly residing in rural field
practice areas of S.N. Medical College, Bagalkot, North Karnataka
Sachin Desai*, Sidharth Agarwal, B. S. Mannapur, A. S. Dorle
INTRODUCTION
Population ageing is a global phenomenon. Globally, the elderly population is going through a demographic transition.1 From 5.6% in 1961 the proportion has increased to 8.6% in 2011.2 The dietary pattern of the elderly decreases with age and is affected by multiple determinants like psychosocial stress, dementia, delirium, poor economic status, poor dentition, chronic debilitating illnesses, smoking, alcohol and thus they are prone to
develop malnutrition and nutritional deficiency disorders.3 The study was undertaken with the objectives to assess the risk factors for dietary deficiency disorders among elderly and their role in elderly morbidities.
METHODS
Six geriatric camps were conducted on third Friday of every month from January 2017 to June 2017 in rural area of Shirur town of Bagalkot, and a total of 140
ABSTRACT
Background: Nutrition is an important element of health, among the elderly. They are prone for dietary deficiencies and thus suffer from a plethora of nutritional deficiency disorders due to various factors, prevalent from region to region. Estimating the risk factors for nutritional deficiencies, dietary patterns and their role in elderly morbidities is of utmost importance.
Methods: 140 Elderly, with the help from their caregivers, were screened for nutritional deficiencies by a detailed general physical examination and for signs of nutritional deficiencies namely: water soluble B-complex vitamins. Elderly were examined for the anthropometric measurements like height, weight, BMI, mid arm circumference, calf circumference and nutritional deficiency disorders. Elderly malnutrition was assessed using mini nutritional assessment (MNA)scale score, body mass index (BMI)and weight loss >10% of body weight.
Results: Of the total elderly, 45 (32.1%) of elderly are underweight and 42 (30.0%) of elderly were obese. 63 (45%) each, had a waist hip ratio value of >0.95 in men and >0.85 in women. 69 (49.3%) of the elderly were having a Mid-arm circumference of <24 centimeters. 1 (43.6 %) elderly, was having 12-14 points (normal nutritional status) 76 (54.3 %) had a score of 8-11 points i.e. at risk of Malnutrition 03 (2.1%) had a score between 0-7 patients were malnourished.
Conclusions: Dietary patterns of the elderly decreases with age and is affected by multiple determinants like psychosocial stress, dementia, delirium, poor economic status, poor dentition, chronic debilitating illnesses, smoking and alcohol, which play a vital role in elderly malnutrition.
Keywords: Risk factors, Elderly, Dietary defeciencies, Rural area
Department ofCommunity Medicine, S. N. Medical College, Bagalkot, Karnataka, India
Received: 29 March 2018
Revised: 09 May 2018
Accepted: 10 May 2018
*Correspondence:
Dr. Sachin Desai,
E-mail: [email protected]
Copyright: © the author(s), publisher and licensee Medip Academy. This is an open-access article distributed under the terms of the Creative Commons Attribution Non-Commercial License, which permits unrestricted non-commercial use, distribution, and reproduction in any medium, provided the original work is properly cited.
elderly, with the help of their caregivers, were interviewed for their dietary pattern. It was a community based cross-sectional study. A total of 140 elderly above 60 years, along with their accompanying caregiver, residing in the field practice areas (rural) of Department of Community Medicine of S.N. Medical College of Bagalkot city, for past one year, were interviewed by a predesigned, pretested, questionnaire from January 2017 to June 2017.4,5 Deaf, dumb, blind elderly, those with psychiatric morbidities were excluded from the study. A detailed sociodemographic information was elicited and the elders financial status was assessed as per modified BG Prasad’s socioeconomic scale.6
The elderly quantitative dietary consumption was assessed as per the 24 hour recall method, food frequency of common food items and average in kilocalories and grams of protein per week, for calorie and protein consumption was tabulated in comparison with the requirements specified by Indian Council of Medical Research (ICMR).7 The elderly were clinically examined for nutritional deficiencies related to water soluble B complex vitamin deficiencies. Using a weighing scale, stadiometer and measuring tape the elderly participants BMI, Waist Hip Ratio, calf circumference and mid-arm circumference were assessed. Elderly were classified as malnourished based on three criteria: MNA Scoring, BMI and weight loss >10% of body weight.9,10
Sample size calculation done using Open epi Software 2.3.1. At 95% confidence level; According to the study conducted by Yadav et al with the prevalence of nutritional deficiencies being 24.9 (p=24.9).11 At 7%
precision error, sample size calculated is 152. 12 elderly (6 men and 6 women elderly withdrew from the study due to travel to another place).
Statistical analysis
Statistical Package for Social Sciences (SPSS) version 18 (trial version) was used to analyze the data. Chi square test was used to find out the association between the risk factors for dietary deficiencies and elderly malnutrition. Fisher’s exact P was used when the expected numbers of a cell were small or zero.
RESULTS
Socio-demographic variables
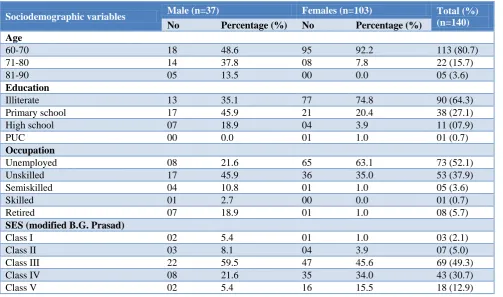
In Table 1, majority (80.71%) of the elderly belonged to young old age group i.e. 60-74 years age group, 103 was women and 37 were men. Majority 69 (49.29) belonged to class III & 53 (37.86%) belonged to class IV Modified B G Prasad classification. Majority 90 (64.29%) of the elderly were educated up to primary school and 38 (27.41%) up to secondary school. Majority of the elderly 73 (52.1%) were unemployed, unskilled, semiskilled, skilled and retired respectively. 53 (37.9%) 5 (3.6%) 1(0.7%) 8 (5.7%) were unskilled, semiskilled, skilled and retired respectively. Per capita income Class I 3 (2.1%) Class II 07 (5.0%) Class III 69 (49.3%) Class IV 43 (30.7%) and 18 (12.9%). Type of family: Joint families were 75 (53.6%) nuclear families were 56 (40%) & problem families were 09 (6.4%).
Table 1: Sociodemographic variables of study participants.
Sociodemographic variables Male (n=37) Females (n=103) Total (%)
(n=140) No Percentage (%) No Percentage (%)
Age
60-70 18 48.6 95 92.2 113 (80.7)
71-80 14 37.8 08 7.8 22 (15.7)
81-90 05 13.5 00 0.0 05 (3.6)
Education
Illiterate 13 35.1 77 74.8 90 (64.3)
Primary school 17 45.9 21 20.4 38 (27.1)
High school 07 18.9 04 3.9 11 (07.9)
PUC 00 0.0 01 1.0 01 (0.7)
Occupation
Unemployed 08 21.6 65 63.1 73 (52.1)
Unskilled 17 45.9 36 35.0 53 (37.9)
Semiskilled 04 10.8 01 1.0 05 (3.6)
Skilled 01 2.7 00 0.0 01 (0.7)
Retired 07 18.9 01 1.0 08 (5.7)
SES (modified B.G. Prasad)
Class I 02 5.4 01 1.0 03 (2.1)
Class II 03 8.1 04 3.9 07 (5.0)
Class III 22 59.5 47 45.6 69 (49.3)
Class IV 08 21.6 35 34.0 43 (30.7)
Socio-demographic variables Male (n=37) Females (n=103) Total (%) (n=140) No Percentage (%) No Percentage (%)
Type of family
Joint family 20 54.1 55 53.4 75 (53.6)
Nuclear family 17 45.9 39 37.9 56 (40.0)
Broken family 00 0.0 09 8.7 09 (6.4)
Marital status
Unmarried 04 10.8 1 1.0 05 (3.6)
Married 31 83.8 67 65.0 98 (70.0)
Widow/widower 02 5.4 35 34.0 37 (26.4)
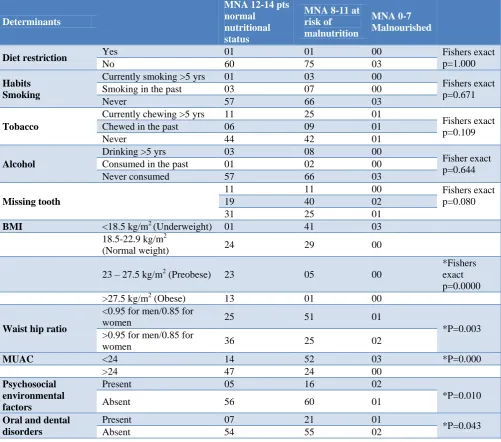
Table 2: Determinants for malnutrition among elderly.
Determinants
MNA 12-14 pts normal
nutritional status
MNA 8-11 at risk of malnutrition
MNA 0-7 Malnourished
Diet restriction Yes 01 01 00 Fishers exact
p=1.000
No 60 75 03
Habits Smoking
Currently smoking >5 yrs 01 03 00
Fishers exact p=0.671
Smoking in the past 03 07 00
Never 57 66 03
Tobacco
Currently chewing >5 yrs 11 25 01
Fishers exact p=0.109
Chewed in the past 06 09 01
Never 44 42 01
Alcohol
Drinking >5 yrs 03 08 00
Fisher exact p=0.644
Consumed in the past 01 02 00
Never consumed 57 66 03
Missing tooth
11 11 00 Fishers exact
p=0.080
19 40 02
31 25 01
BMI <18.5 kg/m2 (Underweight) 01 41 03 18.5-22.9 kg/m2
(Normal weight) 24 29 00
23 – 27.5 kg/m2 (Preobese) 23 05 00
*Fishers exact p=0.0000 >27.5 kg/m2 (Obese) 13 01 00
Waist hip ratio
<0.95 for men/0.85 for
women 25 51 01
*P=0.003 >0.95 for men/0.85 for
women 36 25 02
MUAC <24 14 52 03 *P=0.000
>24 47 24 00
Psychosocial environmental factors
Present 05 16 02
*P=0.010
Absent 56 60 01
Oral and dental disorders
Present 07 21 01
*P=0.043
Absent 54 55 02
Calorie and protein requirements for elderly
28 (75.68%) men and 53 (51.45%) were deficient in calorie and protein intake. As regards the dietary diversity there were 6 food items consumed namely
Clinical signs and symptoms for nutritional deficiencies
Out of the 140 elderly studied, 102 (72.9%) had generalized weakness, 55 (39.3%) had loss of appetite, 38 (27%) of the elderly had <10% loss of body weight, 15 (10.7%) had nausea and vomiting, hyperacidity was seen among 40 (28.6%) of the elderly, and 03 (2.1%) patients had difficulty in swallowing, 10 (7.1%) of them had regurgitation of food, constipation 13 (9.3%) and 03 (2.1%) had bleeding per rectum. 15 (10.7%) elderly suffered from diabetes mellitus, hypertension was prevalent in 25 (17.9%) among those examined. Depression was seen among 05 (3.6%) elderly.
Anthropometry
45 (32.1%) of elderly are underweight and 42 (30.0%) of the elderly, were obese. 63 (45%) had a waist hip ratio value of >0.95 in men and >0.85 in women. 69 (49.3%) of the elderly were having a Mid-arm circumference of <24 centimeters.
Determinants for MNA
Determinants studied were diet restriction, smoking, chewing tobacco, drinking alcohol, abnormal dentition, psychosocial environmental factors (Table 2).
MNA Scoring
61 (43.6 %) elderly, were having 12-14 points (normal nutritional status) 76 (54.3 %) had a score of 8-11 points i.e. at risk of malnutrition 03 (2.1%) had a score between 0-7 patients were malnourished.
Nutritional deficiencies in elderly
06 Elderly had glossitis and bleeding gums, 21 elderly experienced difficulties in night vision, 02 elderly had angular stomatitis and 54 participants experienced tingling numbness and had koilonychia in the nails.
DISCUSSION
As per the study conducted in West Bengal by Lahiri S et alhad a 29.4 % of elderly who were at risk of developing malnutrition and 60.4% were malnourished.12 It was very higher as compared to the Elderly in Assam by Agarwalla et al.13 who were at risk of malnutrition i.e. 55% and 5% were malnourished. But our study had similar findings as per Agarwalla et al i.e. 54.3% were at the risk of developing malnutrition. And only 2.1% were malnourished. In a study carried out by Shivaj et al in Bikaner, Rajasthan, showed that approximately 11.6% elderly were malnourished while 46% were at risk of malnutrition and 42.4% were well nourished and in an another study done by Vedantam et al in rural south India, in which the MNA scale classified 14% as malnourished and 49% at risk of malnourishment.14,15 In a study done by Baweja et al from Western Rajasthan,
7.1% elderly were malnourished while 50.3% were at risk of malnutrition and only 42.6% were well nourished.16
CONCLUSION
The dietary pattern of the elderly decreases with age and is affected by multiple determinants like Psychosocial stress, Dementia, Delirium, Poor economic status, poor dentition, chronic debilitating illnesses, smoking, alcohol and thus they are prone to develop malnutrition and nutritional deficiency disorders. The elderly in our area were more at the risk of developing malnourishment, and hence need to be addressed at the earliest.
Recommendations
Educating the elderly to address the above mentioned risk factors, Better dietary patterns to alleviate all the cultural and psychosocial barriers and address all the risk factors through camp approaches for healthy dietary pattern and lifestyle.
ACKNOWLEDGEMENTS
We would like to thank to all the study participants. Funding: No funding sources
Conflict of interest: None declared
Ethical approval: The study was approved by the Institutional Ethics Committee
REFERENCES
1. Demographic transition. 2011; Available at: http://www.censusindia.gov.in/2011Census/Presenta tion/Demographic-Transition-in-India.pdf. Accessed 23 January 2018.
2. Census of India, Population composition. 2011; Available at: www.censusindia.gov.in/vital_ statistics/srs_report.pdf. Accessed on 23 January 2018.
3. Nutritional support strategy for protein energy malnutrition in the elderly, Malnutrition risk factors, 2007. Available at: https://www.hassante. fr/portail/upload/docs/application/pdf/malnutrition_ elderly_guidelines.pdf. Accessed on 23 January 2018.
4. Definition of an older or elderly person. . March 2011. Available at: http://www.who.int/healthinfo/ survey/ageing- defnolder/en/. Accessed 23 January 2018.
5. Caregiver Toolkit, An Online Toolkit to Facilitate Support for Caregivers for Seniors. February 1997. Available at: http://caregivertoolkit.ca/?page_id= 198#.VgzFK-yq qko. Accessed 23 January 2018. 6. Sharma R. Online interactive calculator for
7. Nutrient requirements and recommended dietary allowances for Indians. RDA 2010 Final draft. A Report of the Expert Group of the Indian Council of Medical Research 2009.Pdf. Accessed 23 January 2018.
8. Mini Nutritional Assessment. Available at: http://www.mna-elderly.org/forms/mini/mna_mini_ english.pdf. Accessed 23 January 2018.
9. Appropriate body-mass index for Asian populations and its implications for policy and intervention strategies. The Lancet. 2004;363(9403):157–63. 10. Mathew AC, Das D, Sampath S, Vijayakumar M,
Ramakrishnan N, Ravishankar SL. Prevalence and correlates of malnutrition among elderly in an urban area in Coimbatore. Indian J Public Health. 2016;60(2):112.
11. Yadav N, Ravindra R, Sharma S, Singh A, Mishra M. Dietary habits and nutritional status of elderly living in urban areas of Allahabad district. Indian J Prev Soc Med. 2012;43(1):80-6.
12. Lahiri S, Biswas A, Santra S, Lahiri SK. Assessment of nutritional status among elderly population in rural area of West Bengal, India. Int J Med Sci Public Health. 2014;4(4): 569-72.
13. Agarwalla R, Saikia AM, Baruah R. Assessment of the Nutritional Status of the Elderly and Its Correlates. J Fam Comm Med. 2015;22(1):39–43. 14. Shivraj M, Singh VB, Meena BL, Kusum S, Neelam
M, Dayal S, et al. Study of Nutritional Status in Elderly in Indian Population. Int J Current Res. 2014;6(11):10253-7.
15. Vedantam A, Subramanian V, Rao NV, John KR. Malnutrition in free-living elderly in rural south India: prevalence and risk factors. Public Health Nutr. 2010;13(9):1328-32.
16. Baweja S, Agarwal H, Mathur A, Haldiya KR, Mathur A. Assessment of Nutritional Status and Related Risk Factors in Community Dwelling Elderly Rajasthan. J Ind Acad Geriatr. 2008;4:5-13.