ISSN (e): 2250-3021, ISSN (p): 2278-8719
Vol. 09, Issue 2 (February. 2019), ||V (I) || PP 41-51
IoT Scanning Through Walls Using Wi-Fi
C. M. S. Ferreira
1, J. S. Pereira
1,2,3, S. P. Mendes
1,21Polytechnic Institute of Leiria, School of Technology and Management, Leiria, Portugal
2Center for research in Informatics and Communications, Polytechnic Institute of Leiria, Portugal
3Instituto de Telecomunicações, Leiria Branch, Portugal
Corresponding Author:C. M. S. Ferreira
Abstract:
Earthquakes are one of the most devastating and frightening natural disasters that can be experienced. After such occurrences, it may be vital to identify objects or (living) beings within buildings that have collapsed. In this context the usage of scanning techniques employing Wi-Fi allow an innovative approach to facilitate referred identification. By using wireless technology, this work presents a proposal for the detection and identification of object contours or silhouettes through walls. This goal was achieved by reading the radio signal strength (RSS) variations with an array of affordable IoT (Internet of Things) Wi-Fi antennas.Keywords:
Antenna, Emitter, Path loss, Radio Signal Strength (RSS), and Wi-Fi.--- --- Date of Submission: 21-01-2019 Date of acceptance: 05-02-2019 --- ---
I.
INTRODUCTION
In recent years there has been a growing interest in IoT (Internet of Things) technologies. The evolution of technology has favored usage of Wi-Fi (Wireless Fidelity) devices that as they become more sophisticated are also smaller, more energy-efficient, and cheaper. The gathering of these factors has attracted not only the research departments of the universities but also the industry in general and the result is the appearance of numerous academic and commercial projects on this subject which in itself is very broad.
The work "Holography of Wi-Fi Radiation" [1] is a good example of the use of a coherent light (electromagnetic waves with precisely known amplitude and phase) emitted by Wi-Fi systems. In this work, the radiation that results from the propagation in the space of electromagnetic waves, forms a hologram that allows to identify objects located between the emitter and the receiver.
At the same time, there are commercial solutions about the TWI (Through-the-Wall Imaging) subject using RF (Radio-frequency) in security and rescue applications. The majority are Ultra-Wide Band like Cambridge Consultants’ system Prism200 [2]. This is a commercial Through Wall Radar that provides a 3D view through brick or concrete walls over a range of up to 20 meters. This technology provides comprehensive coverage of indoor spaces and has well known advantages over conventional narrow band solutions, but its high cost and the susceptibility to receive interference from signals in overlapping spectral bands and low resolution are major disadvantages that must be considered. On the other hand, as Wi-Fi signals are present in a growing number of buildings all over the world, there are some TWI projects that use Wi-Fi sources to try to detect the position of people or objects inside of buildings. Nevertheless, if it is necessary to detect such targets in a building without a Wi-Fi source this TWI project doesn’t offer an adequate solution.
Thus, the purpose of this work is to present a low cost project which can contribute to the detection of objects and living beings within buildings that do not have Wi-Fi Networks.
This way, in free space, RF power varies inversely with the square of the distance between the receiver and transmitter. The stronger the power, the higher the signal strength [3] [4]. It is well known that RF signals are influenced by the environment and by other factors [5]. This means that fog, objects, human beings or walls, attenuate signal power between the transmitters and receivers. In addition, it is important to note that the attenuation also depends on the frequency used [3]. RSSI (Received Signal Strength Indicator), describes the total signal power received and is usually expressed in dBm. Additionally, free space path loss model of propagation and Shadowing model are common methods of RSSI signal propagation for WSN (Wireless Sensor Network) [4] [5].
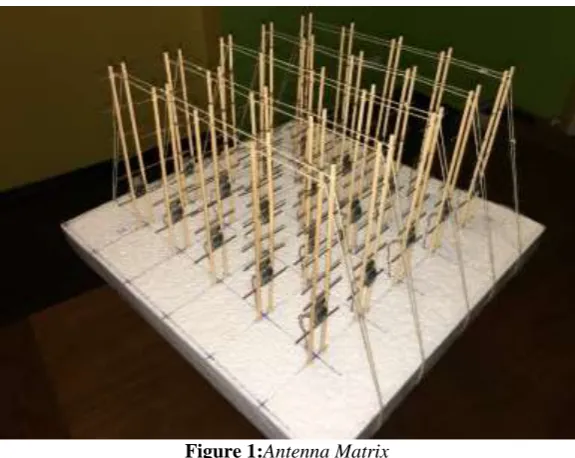
Figure 1:Antenna Matrix
Section II presents the RSSI Matrix theory while section III presents our hardware implementation. Section IV presents the calibration process of the whole TWI system and section V presents the object detection tests. Finally, section VI presents the conclusion and section VII presents future work.
II.
RSSI MATRIX
Assuming that antennas are in free space and are separated by a large distance d in the far field of each
other, the received power Pr will be equal to the product of the power density P of the incident wave and the
effective aperture area Ae of the receiving antenna (1) [6].
Pr PAe (1)
Gt is the gain of the transmitting antenna in the direction of the receiving antenna and Gr is the gain of
the receiving antenna in the direction of transmitting antenna. With the Friss transmission formula [7], the equation
(1) can be rewritten in equation (2) where Pt is the power at the transmitter, Pr is the power at the receiver, d is
the distance in meters and λ is the wavelength (speed of light/frequency):
2
( )
4
Pr G G Pt r t d
(2)
The path loss model of free space propagation is an ideal transmission case. It is known that when there is an infinite vacuum around antenna, the signal transmission energy is only related to transmission distance. There is a linear relationship between the signal transmission energy and transmission distance [5]. Thus, this model has no effect on obstacles and scattered reflection.
However, as tests occur not in free space but in the real world with buildings, fog, rain, objects and living beings, it is necessary to consider their interference (scattered reflection, shade, and absorbance) in the process.
This way, to take into account attenuation caused by objects, living beings and walls in real situations, it
is necessary to use a larger exponent n>2, in (3) [5]. The attenuation characteristic in the long distance is following
the log-normal distribution, thus the path loss model is shown as follows:
0
0
( ) ( ) 10 log( )
L L
d
P d P d n X
d
(3)
Equation (3) computes the path loss of a receiving signal when the measuring distance is d [meters] and
the absolute power value is expressed in dBm; PL(d0) indicates the path loss of a receiving signal when the
reference distance is d0; n indicates the path loss index in a specific environment; X is in dB and is a cover factor
when the range of standard deviation is between 4~10 and the mean value is 0. The larger the the greater the
RSSI equation is as follows:
( )
t L
RSSI P P d (4)
In equation (4) Pt, is the power at the transmitter,PL is the path loss when the distance is d.
The signal strength received from a reference node at the distance d0 is ri,j as follows:
, ( , )
i j t L i j
r P P d i1,...,M , j1,...,N (5)
The signal strength received of an array of M x N antennas is ri,j and di,j(m) is the real distance between
the emitter and each receiver (i,j) in the antenna matrix.
The path loss model measured at distance di,jis as follows:
,
, 0
0
( i j) ( ) 10 log( i j) d
P d P d n X
d
(6)
Equation (6) computes the received signal strength when the measured real distance isdi,j and P(d0) is the
received signal strength when the reference distance is d0 and X𝜎 ~ N
(
0,𝜎2)
.
The reference distance is consideredas d0 and has been set to 1 meter.
As per (7) the value A is the matrix of the RSSI values of the M x N receivers of our matrix antenna (Fig.
1) composed with M rows and N columns.
A[ri j, c], i1,...,M , j1,...,N (7)
The ri j, is the average value of 100 RSSI readings (in one second). The c is also the average value of
100 RSSI readings of an extra antenna in any position out of the matrix antenna. For example, it can be equal to
1, 1 M N
r .
R is the matrix of M N Q P RSSI values of the A Matrix that is used to compose an image of M Q
rows of pixels and
N P
columns of pixels.R[Ar s, ],r1,...,Q, s1,...,P
(8)
with
, ,
r s i j
A r c, r1,...,Q, s1,...,P (9)
III.
HARDWARE IMPLEMENTATION
A. Raspberry PI
Raspberry PI 3 is a small and affordable computer that has a general purpose usage. This device can send and receive data through Ethernet and/or Wi-Fi interfaces and can run, among others, operating systems like Raspbian, Windows 10 IoT Core or Ubuntu. Raspbian is the Raspberry PI Foundation’s official operating system [8]. In this project the Raspbian operating system was used as Wi-Fi AP (Access Point) with a DHCP (Dynamic Host Configuration Protocol) server, providing an IP address to all Wi-Fi receivers within the antenna Matrix. Additionally it works as a web server and database server (MySQL).
B. Antenna Matrix
To receive wireless signal from the emitter (Raspberry PI) a directional matrix of, at least, sixteen Yagi antennas was used. In this matrix, each antenna reads the RSSI signal and records it on a database. One of the
antennas is the reference used for the RSSI value c of (7). An example of this antenna matrix is presented in fig.
Each Yagi antenna includes an ESP8266-01S chip and was constructed as shown in fig. 2 and fig. 3 with 1 mm diameter copper rods. The copper rods length is presented on table 1 [9].
Figure 2:Yagi Antenna
Table 1:Yagi antenna dimensions
Position Length
A 60 mm
B 53mm
C 52 mm
D 51.5 mm
E 51 mm
F 50 mm
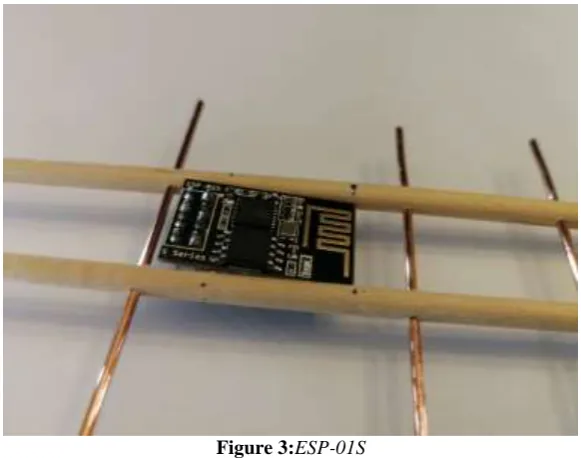
The ESP-01S presented in fig. 3 is a low-cost Wi-Fi microchip. Its ESP8266EX microcontroller integrates a Tensilica L106 32-bit RISC processor which achieves extra-low power consumption and reaches a maximum clock speed of 160 MHz. The Real-Time Operating System (RTOS) and Wi-Fi stack allow about 80% of the processing power to be available for user application programming and development [10] [11].
Figure 3:ESP-01S
ESP8266EX integrates the antenna switches, RF Balun, power amplifier, low noise receive amplifier and is designed to occupy minimal PCB (Printed Circuit Board) area [10] [11]. Developers can completely control ESP-01S behavior including its Wi-Fi power that, in this case, was set to 8 (min: 0 dBm - max: +20.5 dBm). This characteristic is very important to minimize neighbor device interference and saturation RSSI readings.
The antenna applied on this module is a 3 dBi PCB-on-board antenna which is a Meandered Planar Inverted-F Antenna (MIFA). The MIFA design is space efficient where the RF performance is predictable and usually requires no more than 15.2 x 5.7 mm of space to ensure a Voltage Standing Wave Ratio (VSWR) of lessthan 2 across a 2.4 GHz ISM band.
reason that the antennas on the matrix were placed in order to guarantee 7.5 cm between each other, minimizing the interference between them.
Tests were performed to determine the benefit of using this Yagi antenna configuration. Thus, the performance of the ESP 01S mounted on a Yagi antenna was compared with performance of an ESP-01S without Yagi antenna and a difference of about 5 dB was obtained as seen on table II.
Table 2:Gain Difference
ESP-01 Power measured (dBm)
Mounted on Yagi
Antenna -62
Standalone -67
IV.
IDEAL TX POWER ON RASPBERRY PI
To determine the ideal transmission power on the Raspberry PI a test was made in which the transmission power on Raspberry PI was automatically decremented from the default value 31 to 0. To do this, the following script was executed on Raspberry PI:
#!/bin/bash for i in {30..0..-1} do
echo “ “
echo “txPower was changed to $i “ echo “ “
echo “Actual txPower: “ echo “ “
sudoiwconfig wlan0 txpower $i sudoiwconfig
sleep 15 done
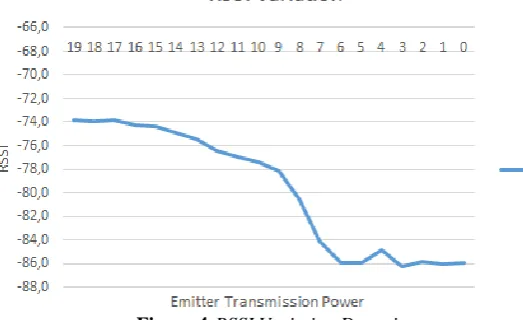
After the transmission power decrement, it was possible to conclude that the Raspberry PI transmission power should be between the 17 and 6. This means that when Tx Power was above 17 or Tx Power was below 6, antennas could not detect enough RSSI variation as seen on fig. 4.
Figure 4:RSSI Variation Detection
V. OBJECT DETECTION
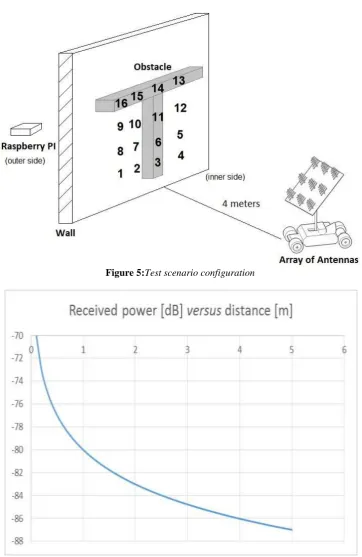
After Tx Power on Raspberry PI has been set to the level 7 and the Output Power of all antennas has been set to 8, RSSI tests were made on a real wall with obstacles depicted by fig. 5, 7, 9 and fig. 11. The numbers 1 to 16 of fig. 7, 9 and 11 represent the positions in which the Raspberry PI has transmitted its signal (as a Wi-Fi emitter) on the other side of the wall. At the same time each static Yagi antenna measured 100 RSSI values per second and its ESP 01S recorded the average values in the Raspberry PI database.
This is the preferable distance because as seen in fig. 6 in the first meter occurs a great loss of power which is to say that this is an unstable zone. Then as the distance increases the power variation decreases which means more stability from the first meter [13].
Figure 5:Test scenario configuration
Figure 6:Loss variation as a function of distance
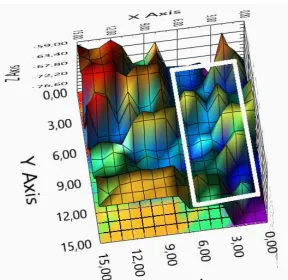
Figure 7:Bookshelf with clear wall on the left
Figure 8:RSSI matrix scan result employing eq. 8 shows attenuation of the shape of the bookshelf with free wall
on the left
Figure 9:Bookshelf with clear wall on the right
Figure 10:Attenuation of the wooden furniture with free wall on the right
Figure 11:Raspberry PI sixteen outdoor positions
Figure 12:Wall without object attenuation
VI. CONCLUSION
This work is a direct result of the motivation to obtain results in the TTW (Trough the Wall) specific area, using affordable IoT technologies.
In this TTW approach sixteen ESP8266-01S microprocessors were used. Additionally, they were coupled in directional antennas that were assembled in the form of an array to improve resolution and transmission power. With a Raspberry PI as an emitter and, at same time, as a database and web server, this technique allowed to carry out tests that can contribute to the detection of objects within buildings in the most diverse contexts, including security and catastrophic situations.
VII.
FUTURE WORK
As future work it is proposed that taking advantage of the constant evolution of IoT technologies will better control the gain of the devices and replace Raspberry PI with a smaller device that allows the Wi-Fi authentication of an increasing number of client devices.
It is further proposed, that the array of antennas can be installed in an autonomous vehicle and that the Raspberry PI or a smaller device can be coupled to an unmanned aerial vehicle.
On the other hand, as a final result, it is desirable to reproduce in 2D and 3D the objects detected.
REFERENCES
[1]. P. M. Holl, F. Reinhard, “Holography of Wi-fi Radiation”, Physical Review Letters, PRL 118, 183901,
May 2017.
[2]. “Through-wall radar PRISM200 - Through-wall radar - CAMBRIDGE RADAR-TECH
INTERNATIONAL LIMITED”, http://cambrate.com/product.php?id=16.
[3]. P. Kolios, “Wireless Environment and Mobility Issues”, Dept. of Computer Science, University of Cyprus.
[4]. X. Jiuqiang, W. Liu, F. Lang, Y.Zhang, C. Wang. “Distance measurement model based on RSSI in WSN",
https://www.researchgate.net/publication/220279158_Distance_measurement_model_based_on_RSSI_in WSN, 2010.
[5]. F. Shang, W. Su, Q. Wang, H. Gao, e Q. Fu, “A Location Estimation Algorithm Based on RSSI Vector
Similarity Degree”, International Journal of Distributed Sensor Networks, vol. 2014, pp. 1–22, Ago.
[6]. R. Johnson, “Antenna Engineering Handbook” (3rd ed.), New York, NY: McGraw-Hill, Inc. p. 1-12. ISBN
0-07-032381-X, 1992.
[7]. H.T. Friis, "A Note on a Simple Transmission Formula", IRE Proc.: 254–256, May 1946.
[8]. V. Ziemann, “A Hands-On Course in Sensors Using the Arduino and Raspberry Pi”, CRC Press, Taylor &
Francis Group, ISBN 9781351188319, 2018.
[9]. “directional YAGI WLAN Antenna EXTENSION for 2.4 GHz by photonix – Thingiverse”,
https://www.thingiverse.com/thing:19548, 2012.
[10]. N. Kolban, "Kolbans's Book on ESP8266, http://neilkolban.com/tech/esp8266/, 2016.
[11]. M. Schwartz, "Internet of Things with ESP8266", Packt Publishing , ISBN 978-1786468024 2016.
[12]. “Calculating Wavelengths - Just Incase You Wondered! DigitalAir Wireless”,
https://www.digitalairwireless.com/articles/blog/calculating-wavelengths-just-incase-you-wondered
[13]. N. Bowden, "Wi-Fi Planning, Walls and dB’s – Measuring Obstruction Losses For WLAN Predictive
Modelling",https://www.ekahau.com/blog/2015/09/07/wi-fi-planning-walls-and-dbs-measuring-obstruction-losses-for-wlan-predictive-modelling/, Feb. 2015.
[14]. P. Mayes, “Proceedings of the 1993 antenna applications symposium”,
http://www.dtic.mil/dtic/tr/fulltext/u2/a277202.pdf, Feb. 1994.
[15]. E. Goldoni, A. Savioli, M. Risi, P. Gamba, "Experimental analysis of RSSI-based indoor localization with
IEEE 802.15.4," European Wireless Conference (EW), Italy, April 12-15, 2010.
[16]. G. S. Kuruoglu, M. Erol, S. Oktug, "Localization in Wireless Sensor Networks with Range Measurement
Errors," Advanced International Conference on Telecommu-nications AICT’09, Venice, Italy, May 24– 28, 2009.
[17]. P. Kumar, L. Reddy, S. Varma, "Distance measurement and error estimation scheme for RSSI based
localization in wireless sensor network," IEEE conference on WCSN, Allahabad, India,, 2009.
[18]. J. Zheng, C. Wu, H. Chu, Y. Xu, “An Improved RSSI Measurement In Wireless Sensor Networks”,
Procedia Engineering, vol. 15, Jan. 2011.
[19]. B. Bengherbia, Y. Bachene, S. T. Kebir, S. Chadli, H. Hentabli, "Experimental Analysis of Rssi-Based
Outdoor Localization in Wireless Sensor Networks”, 2014.
[20]. D. Maduskar, S. Tapaswi, “RSSI based adaptive indoor location tracker”, Sci Phone Appl Mob Devices,
2017.
[21]. A. S. Paul, E. A. Wan, “RSSI-Based Indoor Localization and Tracking Using Sigma-Point Kalman
[22]. Y. Wang, B. Zhao, Z. Jiang, “RSSI-Based Smooth Localization for Indoor Environment”, The Scientific World Journal, Volume 2014, Article ID 639142, 2014.
[23]. F. Adib, "See Through Wall With Wi-Fi", Department of Electrical Engineering and Computer Science,
Massachusetts Institute of Technology, 2013.
[24]. J. L. Lawson, "YAGI ANTENNA DESIGN", American Radio Relay League, Incorporated, ISBN
9780872590410, 1986.
[25]. Z. Fang, Z. Zhao, P. Guo, Y.-G. Zhang, “Analysis of distance measurement based on RSSI”, Chinese
Journal of Sensors and Actuators, 2007.
[26]. M. Sauter, “From GSM to LTE An Introduction to mobile NetWorks and Mobile Broadband”, John Wiley
& Sons, Lda, ISBN 978-0-470-66711-8, 2011.