Page 13 www.ijiras.com | Email: [email protected]
An Effective Deployment Strategy And Geometric Routing For
Wireless Sensor Network
P. Sathees Lingam
Research Scholor, Department of ECE, TCE, Madurai, TamilNadu, India
S. Parthasarathi
Assistant Professor, Department of ECE, TCE, Madurai, TamilNadu, India
K. Hariharan
Associate Professor, Department of ECE, TCE, Madurai, TamilNadu, India
I. INTRODUCTION
A WSN has large number of the sensing nodes, which is simultaneously acquires process and transmit sensor data. The deployment of sensor node could be random or deterministic as well as the communication could be wired or wireless. Each sensor node contains sensing unit, processing unit and communication unit as a major component. Sensors are used to detect or measure the physical parameters and the collected information has been processed in the processing unit. After processing the information should be forwarded to sink node or base station and the communication could be done with single hop as well as multi-hop through communication
channel. The cost effective wireless communication plays a vital role in wireless sensor network because the installation of wireless sensor network is too easy and cost effective. At the beginning of the sensor network, the sensor node deployment is a major issue for researchers which means the suitable deployment strategy will give better sensor network. Such sensor node deployment can be done with random manner as well as deterministic manner. The sensor node thrown from the helicopter or air vehicle for military surveillance applications which is called random deployment. Each node doesn‟t know its own location and some of the node might not be dropped within the coverage area of the neighbor node. It requires mobility to reach the communication range of
Abstract: Now a day’s, we are very much interested in smart Agricultural field. As per smart envision of agriculture, the sensors are playing a vital role to measure physical parameters of the field. To make a smart agricultural field, it requires multiple sensor node which should be deployed in stipulated places based on the internal characteristics of the node. In this paper, the deployment of nodes are mainly depends on to cover a deterministic area and utilize the minimum number of nodes to get maximum coverage of the field (‘K’ coverage). In this research analyzes, it has been analyzed an effective sensor nodes deployment Strategies to get ‘K’ coverage as well as analyzed geometric routing to get less energy consumption. The sensor nodes are deployed under two different conditions for getting maximum coverage by using minimum number of sensors of deterministic area. As well as it has been analyzed an energy efficient geometric routing by utilizing the geometric deployment. According to this research analyzes, the total number of intermediate hops to reach information from source to sink has been vastly varied between two different conditional deployments. And the distant based geometric routing energy consumption is also varied under two different geometric deployment strategies. As per research analysis the communication consumes more energy than sensing and processing of sensor node. So, if the number hops increases between source to sink then the energy consumption to transmit and receive the information is also getting increases.
Page 14 www.ijiras.com | Email: [email protected] neighbor node and it cant be easy to determine the location of
sensor node. But in deterministic deployment could be easy to get „K‟ coverage within the coverage region as well as easily determine the location of sensor node within the determined coverage region.
Second the communication between sensor nodes are also takes an another important issue on wireless sensor network. The communication could be done by single hop as well as multi-hop which means source to destination communication could be done with single hop or multiple hop. The information from each sensor has been delivers to sink or base station either single hop or multi-hop communication. As far as research concern, a sensor node can communicate only neighbor nodes within the communication range which means it can flood the information to all the neighbor nodes within the communication range. But if the sink node not in communication range of source node, then the source node should transfer information by flooding through neighbor nodes by using multi-hop communication. The researchers mainly focused on hierarchical routing and flat routing (data centric) which could be done by flooding of information through all the neighbors of source node. It doesn‟t bother about the direction of sink location and searching the location of sink is an very difficult task in routing. But in distant based geometric routing, the source node to sink node information delivery by using multi-hop is highly directional and it rectifies unnecessary wastage of power due to information flooding to all of its neighbor.
The energy efficiency of the battery operated sensor node is an another issue in wireless sensor network. Each and every node consumes energy for sensing, processing and communication. As per researchers analysis, the communication takes much energy when comparing to sensing and processing. Due to unbalanced energy consumption of sensor node the battery life is getting reduced which means easily depleted. In this paper, it has been analyzed III. Static and deterministic sensor nodes deployment strategy under two different conditions for „K‟ coverage. II. Define and implement a geometric routing for geometric deployment strategy. III. Mathematical representation of energy consumption analysis to sensor node. IV. The performance analysis with suitable WSN module and the channel allocation has been given for sensor node communications by IEEE 802.15.4.
II. PROBLEM FORMULATION
Some research efforts have studied the deployment problem from the coverage and connectivity perspectives. In [1], You-Chiun Wang et al. derive the necessary conditions for mobile node deployment with various position based on distance. Here, every time the node is getting moved randomly to improve connectivity. As far as the researchers concern, mobility of node is taking much energy while comparing static placement. For getting maximum coverage, it needs coordinate points unless it will not be feasible for further routing. For routing it requires multiple vector table as well as it wants to check the location of a particular node. It is not easy to find the coordinates of each nodes when it is mobile.
So, it requires multiple geometry for placement and to find the coordinates. In this paper, the researcher takes various assumptions to place the neighbor node. For implementing towards the routing such mobile node deployment might not be feasible because its coordinate changed multiple within the coverage area. So, finding the exact coordinate point of each node is very critical task as well as it will also consumes some amount of energy when u implement difference strategy for finding coordinates. This could be improved based on static node placement within the coverage area as well finding the coordinates of each node permanently and it can be implemented on further geometric routing.
In [2], J i m Zhang and Hongchi Shi et al. Grid based energy efficient routing has been analyzed. In this paper, the energy calculation has been done with some mathematical calculation. But as far as research concern, the grid based node deployment based on this paper couldn‟t cover the entire region. So, the coverage problem is a major issue in this paper. In [5], Stavros Toumpis et al, derived the equations and methods for shortest path between multiple source and multiple sink. According to this research, multiple sink usage can take unnecessary energy consumption in wireless sensor network here, explained the OSI layer wise representation for data transmission between multiple source to multiple sink.
The research in [8], Kenan Xu et al. propose three deployment strategies, namely, connectivity-oriented deployment, lifetime-oriented deployment, and hybrid deployment (balancing the concerns of connectivity requirements and lifetime extension). And derived various energy consumption equations based on the battery power. To improve the connectivity of the network, relay node has been placed to getting single hop communication. As per research because of relay node deployment conclude that there in „K‟ coverage.
III. DETERMINISTIC DEPLOYMENT
Device deployment is a fundamental issue in WSN design. As per various research concern, there are two important deployment strategies are available. They are Deterministic and Random. As per the geometric of the agricultural field the deterministic way of node deployment strategy has been implemented. It has been assumed the coverage region as square with area of coverage region is „R x R‟. The sensor at the node has the sensing range „RS‟ and the antenna have the communication range „RC‟. As per reference [1], the communication range (RS) can be maximum level of 2 * RS, the maximum allowable distance between neighbor nodes can be √3 * RS and the width of the sensor coverage area ( δ) is:
δ = √ (RS2 – [(1/4)*R
C2). (1) The sensor node deployment has been started from the left most top with following conditions number of sensor nodes placed to get „K‟ coverage. There are two important conditions available they are RC< √3 * RS and RC>= √3 * RS. As we know the geometry of the plant or field, node placement has been processed based on horizontally as well as vertically with some conditions.
Page 15 www.ijiras.com | Email: [email protected]
RC< √3 * RS (2)
RC>= √3 * RS (3)
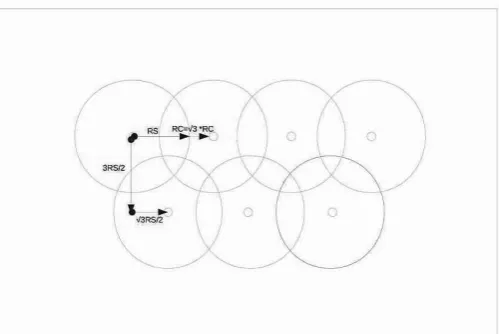
In fig 1. the starting node placement location is assumed at top left of the region. If the condition RC< √3 RS & (X>0, Y<M) then each sensor will be separated by distance of „RC‟ horizontally. And the Placement of adjacent row nodes will be If the condition (X>M, Y<M) then the Vertical Separator from a center of the node to „RS + δ‟ distance and the horizontal Separator from point „RS + δ‟ to - RC/2 distance. At the same time if the condition RC< √3 RS & (X<M, Y<M) then the sensors on each row will be separated by distance of „- RC‟ horizontally. Now the Placement of adjacent row nodes will be If the condition (X<0, Y<M) then the Vertical Separator from a center of the node to „RS + δ‟ distance and the Horizontal Separator from point „RS + δ‟ to RC/2 distance. At last When X<0, X>M & Y<0, Y>M = Invalid condition (out of coverage region). Then the second condition of node deployment strategy is also applicable to get „K‟ coverage within the coverage region. But as far as this research concern, the value of „δ‟ could be used in the condition RC< √3 * RS but the value of „δ‟ could be used in the condition RC>= √3 * RS. It can be easily deployed geometrically to get maximum coverage.
Figure 1: Sensor node deployment under condition RC< √3 *
RS
In fig 2. the second condition of RC>= √3 RS& (X>0, Y<M) the adjacent Sensor will be regularly separated by a distance of √3 * RS horizontally. And placement of adjacent row nodes will be if the condition (X>M, Y<M) then the vertical Separator from a center of the node to „(3RS) / 2)‟ distance and the Horizontal Separator from point „(3RS) / 2)‟ to „[- (√3 * RS)/ 2]‟ distance. At the same time if the condition RC>= √3 RS& (X<M, Y<M) then the adjacent Sensor will be regularly separated by a distance -(√3 * RS)horizontally. Now the placement of adjacent row nodes will be if the condition (X<0, Y<M) then the vertical Separator from a center of the node to „(3RS) / 2)‟ distance and the horizontal Separator from point „(3RS) / 2)‟ to „(√3 * RS)/ 2‟ distance. At last when the condition X<0, X>M & Y<0, Y>M = invalid condition (out of coverage region). So, as per this analysis, number of sensor node deployment could be less for getting „K‟ coverage with in the coverage area. Such number of nodes to get maximum coverage on the field can be varied in both conditions of deployment strategies. Here, the deployment strategy is considered only to get maximum coverage by using minimum
number of nodes. It will not give any analysis regarding the node failure as far as concern.
Figure 2: Sensor node deployment under condition RC = √3 *
RS
IV. COORDINATE OF NODES
Because of this deterministic deployment, each and every node must have geometric ID. As per our new deployment strategy, geometrically it can be find the coordinates of each node with some assumption. In this research analysis, it can be consider two different conditions [1]. They are RC < √3 * RS and RC = √3 * RS. According to the condition RC< √3 * RS, the assumptions are α= √2 * RS , β=RS+ δ and X denotes x1,x2,x3 ---- xn (1,2,3,4,5,6,7 ---- n) and based on the condition RC = √3 * RS the assumptions are α= √3 * RS , β= 3RS/2 and X denotes x1,x2,x3 ---- xn (1,2,3,4,5,6,7 ---- n). The coverage area has been assumed as „R x R‟ which is considered as a square region. Because of geometric routing, it should be noted that each node must have ID based on the distance which means each node should know its own coordinates. Here, as per this research, the field could be selected with square [R x R] based on 2D.
Assignment of Coordinate For Individual Nodes
Page 16 www.ijiras.com | Email: [email protected] The left most top of the region could be a coordinate (0,R) and
the right most top of the region could be a coordinate (R,R). At last the center point of the region could be a coordinate (R/2, R/2). The first node deployment could be critical one at this coverage region because of this first node only the other nodes could be deployed based on the conditions. Here, it has been considered that the first node placed at the point (x1α, R-β). From this first point horizontally each point separated with „α‟ distance till less than „R‟. if its is greater than „R‟ then the node deployment has been dropped β distance vertically and moved center of the two point above based on RC/2. Now each node deployed horizontally with the distance „α‟ from that point. This process is repeated till it reaches vertically less than zero and horizontally less than zero or „R‟.
V. PROPOSED GEOMETRIC ROUTING
Routing is a network layer protocol which is highly useful in WSN. Researches are mainly focused on these routing protocols to minimize the energy consumption. As per reference, the routing protocol can be classified as Data centric (Flat) protocol, Hierarchical protocol and Geometric protocol. Many of the researchers focused on Data centric and Hierarchical protocols because according to application the sensor nodes deployment might not be deterministic. So, it can‟t be initialize any specific ID to those particular nodes.
But as per agricultural application the geometry of agricultural field can be finding and can be place the sensor nodes with deterministic manner. Based on the sensor node deployment strategy we have deployed all the sensors to get „K‟ coverage. Here we have analyzed two important aspect of routing by placing sink node in three different places within the coverage area „R‟. In this paper, it has been analyzed the energy consumption of nodes based on these three sink node placement methodology. As per geometric routing, the source node wants to send data to sink through intermediate nodes.
Algorithm to find sink node by source node:
Flooding the query with sink ID to all neighbor nodes
Neighbor nodes calculate the distance between sink and transmit the value to source node
Neighbor node which has less distance again flooding the query to all neighbor nodes.
Now all neighbor nodes calculate distance from sink and transmit value to neighbor nod
Repeat this process till find the sink node.
Normally, the source node doesn‟t know where is sinking. Source node knows only the neighboring nodes of source node with in the coverage range. Each and every neighbor node again sends the same query to its entire neighbor because of this concept unnecessarily spreading the query to all nodes towards all directions. To avoid this unnecessary wastage of flooding power, a new distance based routing strategy has been introduced.
For reducing flooding power geometric routing has been introduced. Initially, the source node spread query to its entire neighbor along with sink node ID. Then each neighbor node calculates the distance between sink nodes and sends the distance information again to the source. The source node analyzes the shortest distance and transmitting the information
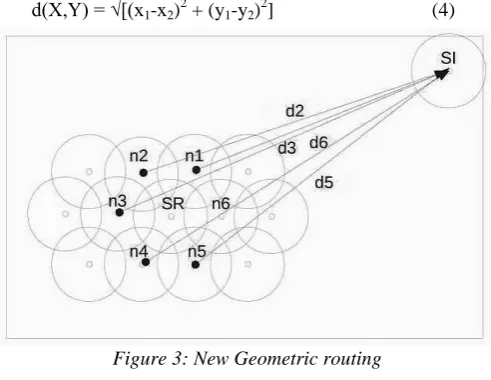
towards such node which contains less distance towards sink. In fig 3. the source node (SR) has 6 neighbor nodes and each neighbor node calculates the distance with sink node (SI). When comparing with d2, d3, d4, d5, d6 node d1 has less distance and it can be selected to transfer the information of source node towards the sink node. The distance between all neighbor nodes of source node towards sink node is calculated based on Euclidean distance.
d(X,Y) = √[(x1-x2)2 + (y1-y2)2] (4)
Figure 3: New Geometric routing
VI. ENERGY CONSUMPTION ANALYSIS
As per reference the energy consumption can be mainly divided in to three domains. They are Sensing, Data processing & Data aggregation and Communication. The energy consumed due to sensing of data of one bit in length (Heinzelmen et al 2002)
ES = PS. T (5)
ADC power consumption:
PS=FS * 2 ENOB (6)
From the above formula PS is Power consumption of sensing, FS is Sensing frequency, ENOB is Effective number of bits and t = Sensing time. A negligible amount of energy consumes at this sensing level.
Now the Data Processing (Computation) is analyzed with the reference of Waiy chandrasekaran “Energy efficient DSP for WSN”
PP = f * C * V 2
dd + Vdd (I0 e Vdd/n*V
T) (7)
EDP = PP * tDP (8)
From the above formula „f‟ is clock frequency, C is capacitance switched per cycle [C ~ 0.67nF], Vdd is supply voltage and VT = Thermal Voltage (n ~ 21.26 & I0 ~ 1.196), EDP defined as Energy consumption for data processing and tDP is time required for data processing. Here, the IInd term indicates the power loss due to leakage current (usually it will be 10%). The leakage energy will become large (50%) at low duty cycle. Overall the energy consumption of data processing in time is being negligible amount.
Page 17 www.ijiras.com | Email: [email protected] process is a very important process, it is also consumes some
energy. The consumed energy of data aggregation is
EA(K,L) = KγL (9)
From the above formula „K‟ is No of Stream, L denotes length of information and γ = 5nj/bit/stream (wang et all 1999) At last the communication consumes more energy than any other energy consumption. In communication, energy consumes in more stages they are start-up energy (Energy to switch on), Reception energy, Switching energy (Switching from Transmit mode to Receive mode) and Transmission Energy.
EC = EST + ERX + ESW + ETX (10) From the above formula EC is total communication energy, EST is start-up energy, ERX is reception energy, ESW is switch energy (switching from Transmit mode to Receive mode) and ETX is Transmission Energy. As per reference the Start-up energy with respect to start-up time (EST) is
EST = PLO * TST (11)
From the above formula the power consumption of the circuitry (ex: VCO – Voltage controlled oscillator & phase locked loop) and TST denotes the time required to start up all components. And the switching energy (TX / RX mode) of sensor node is
ESW = PLO * TSW (12)
From the above formula ESW denotes switching energy, PLO is power consumption of circuitry and TSW denotes time required for switching. And the transmission Energy (ETX) of one sensor node is
ETX (K, D) = Eelect * K + eamp * k * D2 (13) ETX(d,l) = αl + βld2 (“Heinzelamn et al 2002”) (14)
ERX(l) = αl (“Heinzelamn et al 2002”) (15)
From the above formula ETX (K,d) denotes energy consumed by „K‟ number of bits with „d‟ distance, Eelect is consumed electrical energy, eamp denotes consumed amplifier energy and D is Distance. And also „l‟ denotes length of the data and α, β is constants [(ex) Eelect = 50nj/bit, eamp = 100pj/bit/m2]. And now the the calculation of reception energy is
ERX = Eelect * K (16)
In case of line of sight propagation the FRISS formula calculates Receive power:
PRX(d) = [(PTX(d)*Gt*Gr)/(4πd/λ) 2
] (17)
From the above formula Pr(d) denotes power consumption at reception in distance „d‟, Pt(d) is Power consumption at transmitter in distance „d‟, Gt& Gr denotes antenna gain of transmitter and receiver, d is the distance between transmitter and receiver and λ = Wave length.
VII.PERFORMANCE EVALUATION
In this section, the Node MCU – V2 has been taken as a our sensor module which is a 32 bit processor. As per this module, it requires 3.6 V/80mA battery and 26 MHz crystal oscillator to operate. And it contains 10 bit ADC and 802.11b wifi. The wifi module output power could be 20 db and it can be operated within the temperature -40oc to 125oc. The power management can be controlled with three modes: they are OFF, Deep Sleep, Sleep modes. In OFF state, RTC disabled as well as all registers are getting cleared, In Sleep mode and
Deep sleep mode only RTC is in operating condition. As per data sheet the deep sleep mode it drives for 300 mS duration and it consumes 15 mA and the sleep mode drives for 300 mS duration and it consumes 0.9 mA. For wake up it consumes 1 mA current.
As per this paper, the node consumes very very less (negligible) amount of energy at sensing and Data processing. But the majority of energy consumed at communication mode. As per analysis and based on formulas, ETX consumes 0.00006144 Joules of energy for transmitting one packet (1024 bit) information transferred to the distance 10 m. At the same time TRX consumes 0.0000512 Jules of energy for receiving one packet of information to 10 m distance. The data aggregation also consumes some amount of energy which is also considerable. As per formula which was given in previous chapter, the data aggregation process consumes 0.00004096 Jules of energy for aggregating two streams (each 1024 bits) of information. So, in this paper, the transmission energy, reception energy and data aggregation energy only considered for power consumption analysis.
Figure 4: Sensor node deployment for ‘K’ coverage
Page 18 www.ijiras.com | Email: [email protected]
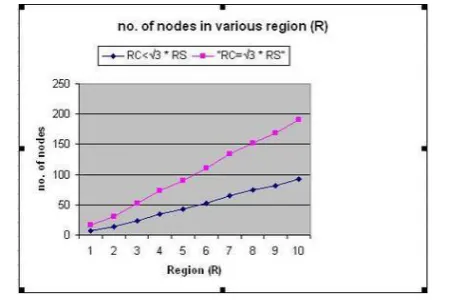
Figure 5: Total number of nodes occupied by varying size of region (R) under two conditions
Energy Consumption for 10 packet delivery Source node Sink node Relay node
0.00006144 0.0000512 0.00019456 0.00012288 0.0001024 0.00038912 0.00018432 0.0001536 0.00058368 0.00024576 0.0002048 0.00077824
0.0003072 0.000256 0.0009728
0.00036864 0.0003072 0.00116736 0.00043008 0.0003584 0.00136192 0.00044652 0.0004049 0.00155638 0.00046296 0.0004608 0.00175097 0.0004794 0.000512 0.00194553
Table 1: Energy consumption analysis for 10 packet of information delivery from source to sink
Figure 6: Energy consumption chart based on table
In geometric routing, if the number of hops between source to sink is getting increased, then the flooding process towards nearby nodes will also been increased even though it is highly directed towards the sink. As well as each time flooding of information to the neighbor consumes same kind of energy which was specified in the above. So, at last when comparing two different deployment strategies, RC< √3 * RS is giving better energy consumption. As per power analysis, every node consumes some amount of energy to deliver the information packet up to sink. The negligible amount of energy consumed at the time of sensing as well as data processing. So, as per communication energy consumption, the source is only consumes transmission energy, the sink consumes only reception energy. But the relay nodes (intermediate nodes) are consumes transmission energy, aggregation energy and reception energy. Source node consumes 0.00006144 (only transmission) joules of energy for its transmission of one packet information and Sink node
consumes 0.0000512 (only reception) joules of energy for its reception for one packet of information. But the relay node consumes 0.00019456 (transmission + reception + aggregation) joules of energy for one packet of information. In fig. 5, the analysis result taken for amount of energy consumption for 10 packets of information delivery under sink, source and relay node condition.
VIII. EXTENSIBILITY
In this paper, just focused on „K‟ coverage about optimize sensor node placement under two different conditions. In case of node failure, need to replace a new node. For example, if the entire region is covered by 100 sensors then the information gathered from each sensor and processed based on the data which received from each sensor. Suppose if any sensor node get damaged or failed then the particular region is not getting covered as well as some times the other nodes information also could not be relayed because of such node failure.
To avoid this situation, some of the mobile alternative node can be placed some where within the region. The mobile node collects the information about activeness of each sensor. If any of the node gets failed which means not receiving proper information from that node, then the mobile anchor node can be moves that particular node position and act as a static node in place of that failure node.
IX. CONCLUSION
The sensor network deployment and efficient routing is a fundamental issue in WSN. The number and positions of devices determine the usability of a system in terms of coverage, connectivity, lifetime, cost, etc. And the vast amount of energy has been consumed at inefficient routing. In this paper, the influence of deterministic deployment on connectivity and lifetime in a large-scale heterogeneous WSN has been analyzed. Based on it, proposed deployment has been done under two different conditions, RC< √3 * RS & RC = √3 * RS As well as the coordinates of each node gets found based the two different deployment strategies. When comparing these conditions, RC< √3 * RS requires more number of nodes to cover the entire region. At the same time while distance based routing (geometric routing), number of hops also increases to reach sink. So, as per energy consumptions analysis, the condition RC = √3 * RS is consumed less energy. The performance of the strategies is further investigated by simulations. This paper provides a guideline for deployment of typical large scale heterogeneous WSN. The performance of the strategies is further investigated by simulations of large scale WSN. This paper provides a guideline for deployment geometric routing of typical large scale heterogeneous WSN.
REFERENCES
Page 19 www.ijiras.com | Email: [email protected] Sensor Networks to Ensure Multilevel Coverage” Y
Senior Member, IEEE TRANSACTIONS ON PARALLEL AND DISTRIBUTED SYSTEMS, VOL. 19, NO. 9, SEPTEMBER 2008
[2] Jian zhang and Hongchi Shi, “ENERGY – EFFICIENT ROUTING FOR 2D GRID WIRELESS SENSOR NETWORKS” information technology: Research and education, 2003. Proceedings. ITRE2003, International conference on 11-13 Aug. 2003, pag(s) 311 – 315. [3] Ian F. Akyildiz and Mehmet Can Varun, “Wireless sensor
network” book, Ian F. Akyildiz Series in Communication and Networking, WILEY.
[4] Bsoxian Zhang and Hussein T.Mouftah SITE, University of Ottawa, Ottawa, “Efficient Grid – Based Routing in Wireless Multi-Hop Network”Proceedings of the 10th IEEE Symposium on Computers and Communications (ISCC 2005).
[5] Stavros Toumpis, Member, IEEE, and Leandros Tassiulas, Member, IEEE “Optimal Deployment of Large Wireless Sensor Networks” IEEE TRANSACTIONS ON INFORMATION THEORY, VOL. 52, NO. 7, JULY 2006
[6] Chih-Yung Chang, Associate Member, IEEE, Chao-Tsun Chang, Yu-Chieh Chen, and Hsu-Ruey Chang “Obstacle-Resistant Deployment Algorithms for Wireless Sensor Networks” IEEE TRANSACTIONS ON VEHICULAR TECHNOLOGY, VOL. 58, NO. 6, JULY 2009
[7] ZHANG, Dingyu XUE, Chengdong WU, Peng JI, Long CHENG College of Information Science and Technology Northeastern University Shenyang, China Yunzhou “Research of Nodes Deployment for Wireless Sensor Network In Deterministic Area” 2009 IEEE
[8] Kenan Xu, Hossam Hassanein, Glen Takahara, Quanhong Wang “Relay Node Deployment Strategies in Heterogeneous Wireless Sensor Networks: Single-Hop Communication Case” IEEE Communications Society subject matter experts for publication in the IEEE GLOBECOM 2005 proceedings.
[9] Anna Hac, “Wireless sensor network designs” book, University of Hawaii at Manoa, Honolulu, USA, John Wilcy & Sons, Ltd.
[10]Wen-Hwa Liao, Mon-Shin Lin “An Energy-Efficient Sensor Deployment Scheme for Wireless Sensor Networks” 978-1-4577-0577-9/11/$26.00 ©2011 IEEE.
[11]Aye Mon Htun, Maung Sann Maw and Iwao Sasase “Reduced Complexity on Mobile Sensor Deployment and Coverage Hole Healing by Using Adaptive Threshold Distance in Hybrid Wireless Sensor Networks” 2014 IEEE 25th International Symposium on Personal, Indoor and Mobile Radio Communications.
[12]A.Rakavi, M. S.K.Manikandan, K.Hariharan“Grid Based Mobile Sensor Node Deployment for Improving Area Coverage in Wireless Sensor Networks” 2015 3rd International Conference on Signal Processing, Communication and Networking (ICSCN).
[13]Z. Abrams, A. Goel, and S. Plotkin, “Set K-Cover Algorithms for Energy Efficient Monitoring in Wireless Sensor Networks,” Proc. Third IEEE Int‟l Symp. Information Processing in Sensor Networks (IPSN ‟04), pp. 424-432, 2004.
[14]M.D. Adickes, R.E. Billo, B.A. Norman, S. Banerjee, B.O. Nnaji, and J. Rajgopal, “Optimization of Indoor Wireless Communica-tion Network Layouts,” IIE Trans., vol. 34, no. 9, pp. 823-836, Sept. 2002.
[15]S.S. Dhillon and K. Chakrabarty, “Sensor Placement for Effective Coverage and Surveillance in Distributed Sensor Networks,” Proc. IEEE Wireless Comm. and Networking Conf. (WCNC ‟03), pp. 1609-1614, 2003. [16]Y.C. Wang, C.C. Hu, and Y.C. Tseng, “Efficient
Deployment Algorithms for Ensuring Coverage and Connectivity of Wireless Sensor Networks,” Proc. First IEEE Int‟l Conf. Wireless Internet (WICON ‟05), pp. 114-121, 2005.
[17]Wint Yi Poe, Jens B. Schmitt “Node Deployment in Large Wireless Sensor Networks: Coverage, Energy Consumption, and Worst-Case Delay” AINTEC‟09, November 18–20, 2009, Bangkok, Thailand.
[18]Prabhudutta Mohanty, Priyaranjan Mohapatra “Maximum Coverage in WSN using Optimal Deployment Technique” IJCA Special Issue on “2nd National Conference- Computing, Communication and Sensor Network” CCSN, 2011.