Development and Validation of a stability indicating method
for the simultaneous determination of Levosulpiride and
Rabeprazole by High Performance Liquid Chromatography
Atulita Mullapudi 1, Sirisha Pingali 2 Tata Santosh3*
3Pharmaceutical Research & Development Laboratory, Corpuscle Research Solutions,
Visakhapatnam-530003, India.
Date Received:
6TH Sep 2013
Date of Accepted:
1st Oct 2013
Date Published:
14th Oct 2013
25
Abstract:
A simple, selective, rapid, precise and economical reverse phase high pressure liquid chromatographic method has been developed for the simultaneous estimation of Levosulpiride and Rabeprazole in pharmaceutical Tablet dosage form. The mobile phase consisted of 60:40 % (v/v) of Methanol & 0.1% v/v orthophosphoric acid operated on isocratic mode. The flow rate is 1.0 ml/min. Chromatographic separation of Levosulpiride and Rabeprazole was performed on AGILENT POLARIS C18 column (150 X 4.6 mm id, ODS 2, 5µm). The wavelength of detection is 232 nm. The injection volume is 20µL. The retention time of Levosulpiride and Rabeprazole are 2.1 ± 0.10 minutes and 4.1 ± 0.10 respectively. The run time of analysis is 6 minutes. The developed method was validated for parameters such as accuracy, precision, linearity, limit of detection, limit of quantitation and solution stability. The influence of acid, alkaline, oxidative Stress and photolytic stress conditions on both the drugs was studied. Results indicated complete degradation in alkaline medium for Levosulpiride and Rabeprazole. The proposed method has been successfully used for the estimation in tablet dosage forms.
Keywords: Levosulpiride, Rabeprazole, HPLC, Proton Pump Inhibitors, Dopaminergic antagonist
Introduction
Levosulpiride is chemically 5-(aminosulfonyl)-N‐[(1‐ethyl‐2‐pyrrolidinyl) methyl]‐2 methoxy benzamide[1] (Fig. 1a). Levosulpiride is a purified levo‐isomer of sulpiride. It is not official in any pharmacopoeia. Compared with racemic and dextro‐forms, the levo‐form of sulpiride has greater central anti-dopaminergic activity, antiemetic and anti-dyspeptic effects and lower acute toxicity. Rabeprazole is chemically 2- [[[4- (3methoxypropoxy)-3-methyl-2-pyridinyl]-methyl] sulfinyl]-1H–benzimidazole sodium salt[2]. Levosulpiride is a D2-dopamine receptor antagonist and commonly prescribed to patients with psychosis, depression and functional dyspepsia. At low doses, Levosulpiride increases
dopaminergic neurotransmission, primarily by blocking of the dopamine autoreceptors, which inhibits the pre-synaptic dopamine synthesis and release of dopamine[3] Compared with racemic and dextro-forms, the levo-form of sulpiride has greater central anti-dopaminergic activity[4], antiemetic and anti-dyspeptic effects and lower acute toxicity[5]
26
H+, K+ATPase of the coating gastric cells and dose-dependent oppress basal and stimulated gastric acid secretion.
Literature review reveals that UV [8,9] HPLC[10,11] methods for Levosulpiride alone or in combined dosage forms and various UV[12,13] HPTLC [14,15], HPLC [16,17] methods for Rabeprazole sodium alone or in combined dosage forms. The aim of the present study was to develop accurate, precise and selective reverse phase HPLC methods for the simultaneous analysis of Levosulpiride and Rabeprazole sodium.
Fig-1a: Structure of Levosulpiride
Fig-1b: Structure of Rabeprazole
2. EXPERIMENTAL
2.1. Reagents and chemicals
Orthophosphoric acid (AR Grade, Merck ltd), Methanol (HPLC grade, Merck ltd), Milli-Q water, Levosulpiride (99.8 % w/w is a gift sample from Unichem Laboratories Ltd) and Rabeprazole (100% w/w purchased from Sigma, glacial acetic Acid (GR Grade, SD Fine Chem Ltd). All other chemicals are of the highest grade commercially available unless otherwise specified. RABONIK tablets for evaluation of the assay content were purchased from a local pharmacy.
2.2. Apparatus and chromatographic conditions
The Chromatographic system consisted of a Shimadzu Class VP Binary pump LC-10ATvp, SIL-10ADvp Auto sampler, CTO-10Avp Column Temperature Oven, SPD-10Avp UV-Visible Detector. All the components of the system are controlled using SCL-10Avp System Controller. Data acquisition was done using LC Solutions software.
The mobile phase consisted of 60:40 % (v/v) of Methanol & 0.1% v/v orthophosphoric acid operated on isocratic mode. The flow rate is 1.0 ml/min.
Chromatographic determination of Levosulpiride and Rabeprazole was performed on AGILENT POLARIS C18 column (150 X 4.6 mm id, ODS 2,
5µm). The wavelength of detection is 232 nm. The injection volume is 20µL.
2.3. Preparation of standard solutions, Calibration Standards & Quality Control Samples
Stock solutions of Levosulpiride (1mg/mL), & Rabeprazole (1mg/mL) were prepared separately in a volumetric flask using methanol and labeled accordingly. Suitable dilutions were then prepared using 50:50 %v/v Methanol & Milli-Q water as Diluent Solution. A Linear Calibration curve containing 8 non-zero standards were prepared using diluent solution in the concentration range of 5-50 µg/mL for Rabeprazole & 10-100 µg/mL for Levosulpiride. The calibration standard sample is then transferred into the auto sampler for analysis. Samples for Specificity (Sample with Rabeprazole alone, sample with Levosulpiride alone, Blank Sample and sample containing both the drugs)
For the preparation of quality control samples, a separate stock containing approximately the same concentration of the rabeprazole and levosulpiride were prepared and labeled as quality control stocks. From these stocks, quality control samples containing rabeprazole and levosulpiride were prepared at three concentration levels namely LQC, MQC, and HQC so as to obtain low, median and high concentration quality control samples. The performance of the linear calibration curve is then evaluated using quality control samples were also prepared accordingly.
2.4. Assay
27
by using the validated method. The sample is then injected in triplicate7.
2.5 Method Validation
2.5.1 System Suitability
A sample containing mixture of Levosulpiride (at concentration of 50µg/ml) and Rabeprazole (at concentration of 50µg/ml) was used as system suitability sample. System suitability was assessed by six replicate analysis. A percent coefficient of variation (% CV) less than 1 % for retention times for the drugs is taken as the acceptance criterion.
2.5.2 Detection and Quantitation Limits (Sensitivity)
Limits of detection (LOD) and quantification (LOQ)
(Fig-2) were estimated from both linearity calibration
curve method and signal to noise ratio method. The detection limit was defined as the lowest concentration level resulting in a peak area of three times the baseline noise. The quantification limit was defined as the lowest concentration level that provided a peak area with signal to noise ratio higher than 5, with precision (%CV) and accuracy with (±) 20%.
Fig-2: Chromatograms shown below indicate limit of Detection (LOD) above and Limit of Quantitation (LOQ) below.
2.5.3 Linearity (Calibration Curve)
The calibration curve was constructed with eight non-zero standards ranging from 5 to 50.00 µg/mL for Rabeprazole and 10–100 for Levosulpiride. The linearity was evaluated by linear regression analysis, which was calculated by least square method. It is depicted in (Fig- 3).
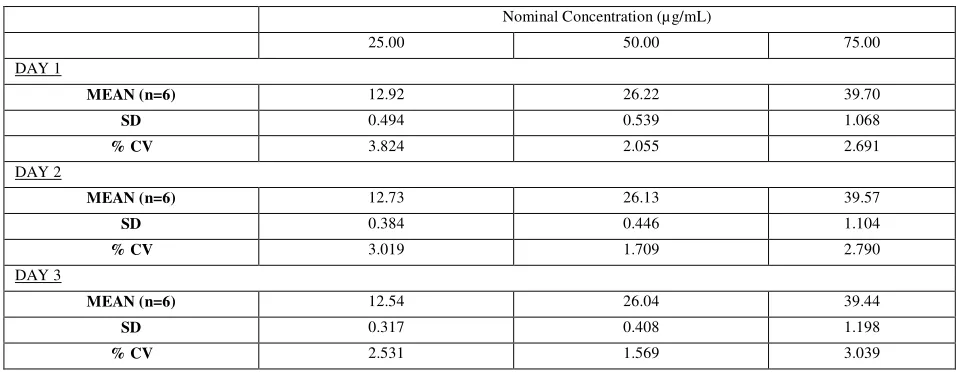
2.5.4 Accuracy and Precision
Accuracy of assay method was determined for both intra-day and inter-day variations using triplicate analysis of the QC samples. Precision of the assay was determined by repeatability (intra-day) and intermediate precision (inter-day). Repeatability refers to the use of the analytical procedure within the laboratory over the shorter period of the time that was evaluated by assaying the QC samples during the same day. Intermediate precision was assessed by comparing the assays on different days (3 days).
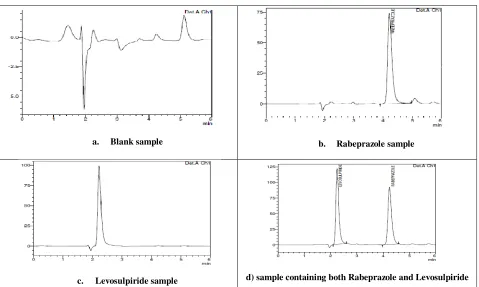
2.5.5 Specificity
For demonstration of specificity, 4 samples namely blank sample, sample containing rabeprazole alone, sample containing levosulpiride alone and sample containing the mixture of levosulpiride and rabeprazole were prepared separately. Specificity of the method was determined by comparing results of all the samples (Fig-4). The developed method is said to be specific if the % interference calculated as peak area (if any) at the retention time of each of the analytes in the blank sample is less than 20% of peak area at the corresponding retention times of each of the drugs in the lowest calibration standard. Sample Specificity is also observed in the degradation study of the drug. None of the degraded products must interfere with the quantification of the drug.
2.5.6 Stability
28
2.5.7 Stress Degradation Studies
For Stress Degradation Analysis, 1 mL aliquots (in duplicate) of samples containing MQC level concentration are treated separately with 100 µL of 0.1N HCl (Acid stress), 0.1N NaOH (Alkaline stress), 5% v/v Hydrogen Peroxide (Oxidative Stress), for 24 Hrs. Samples for Photolytic stress are placed in a transparent glass vial & placed in a UV chamber for 24 Hrs. Samples are then injected for analysis. The results of analysis are then compared with similarly prepared fresh samples. The analysis is performed in triplicate.
3.0 RESULTS AND DISCUSSION
3.1 Method Development and Validation
The HPLC procedure was optimized with a view to develop a stability indicating assay method. Functional group analysis revealed the presence of acidic character to the molecules. Therefore we evaluated the chromatographic behavior at different pH values ranging from pH 3.0 to pH 6.5 using various columns like Hypersil-BDS-C18, Symmetry C18, Ymc-pack C18, Ymc-pack pro, Spherisorb C18, Phenomenex C18 have been tried with different buffer salts such ammonium formate, ortho phosphoric acid, di-potassium hydrogen orthophosphate, in combination with acetonitrile, methanol and tetrahydrofuran. However less tailing and high theoretical plates are obtained with Agilent Polaris column C18 150 X 4.6 cm 5µm column. The peak response of Levosulpiride decreased with increased composition of Methanol in the mobile phase. Mobile phase composition consisted of 60:40 % (v/v) of Methanol & 0.1% v/v orthophosphoric acid operated on isocratic mode. The flow rate of the method is 1.0 ml/min. Calibration standards were prepared in diluent solution containing 50:50 % v/v of methanol and milli-Q water. The wavelength of detection is 232nm. The column temperature is maintained at 25 OC. At the reported flow rate, peak shape was excellent; however increasing or decreasing the flow rate resulted in unacceptable tailing factor and poor peak shape. Hence 1.0 ml/min was optimized flow rate decreasing the consumption of the mobile phase, which in turn proves to be cost effective for long term routine quality control analysis. To evaluate the feasibility of the experiment under regular lab conditions, we assessed the stability of Rabeprazole and Levosulpiride under room temperature and under normal light conditions.
3.2 Method Validation
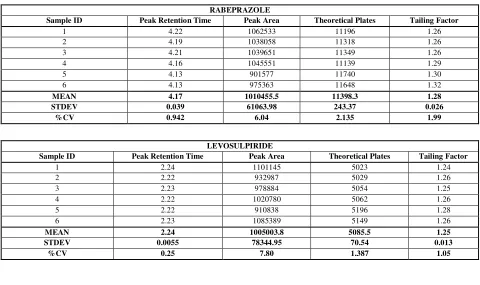
3.2.1 System Suitability
The % RSD of the peak area for both drugs is within the acceptable criteria (Table-1). The efficiency of the column was expressed as the number of theoretical plates for the six replicate injections was around 10883 ±1 20 for Rabeprazole and 5153 ± 65 for Levosulpiride. The USP tailing factor was 1.25 ± 0.1 for Rabeprazole while that of Levosulpiride is 1.21 ±0.08.
3.2.2 Determination and Quantification Limits (Sensitivity)
Fig-2 represents the chromatogram of limit of
detection and limit of quantification. The method is found to be sensitive which can be determined from the data obtained from the (Table-2).
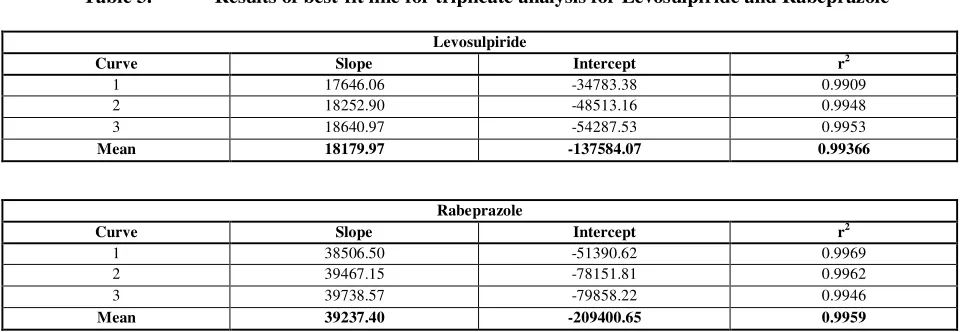
3.2.3 Linearity
The linearity was demonstrated in triplicate. The results of the best fit line (y = mx + c) for the triplicate analysis is given in Table 3. The accuracy of the calibration standards was evaluated from the back calculated concentrations (Table 4). All the standards were found to be within the range of 90.33-109.23% for levosulpiride and 92.49-105.33% for rabeprazole.
3.2.4 Accuracy and Precision
Accuracy and precision calculated for the QC samples during the intra- and inter –day run are given the (Table-5). The intra-day (day-1) and inter-day accuracy for Rabeprazole ranged from 51.8-52.7 % while that of Levosulpiride ranged from 102.78- 105.46 %. The results obtained from intermediate precision (inter-day) also indicated a good method precision. All the data were within the acceptance criteria.
3.2.5 Specificity
Specificity was determined by comparison of the Blank chromatogram with that of the Standard chromatogram (Fig-4)
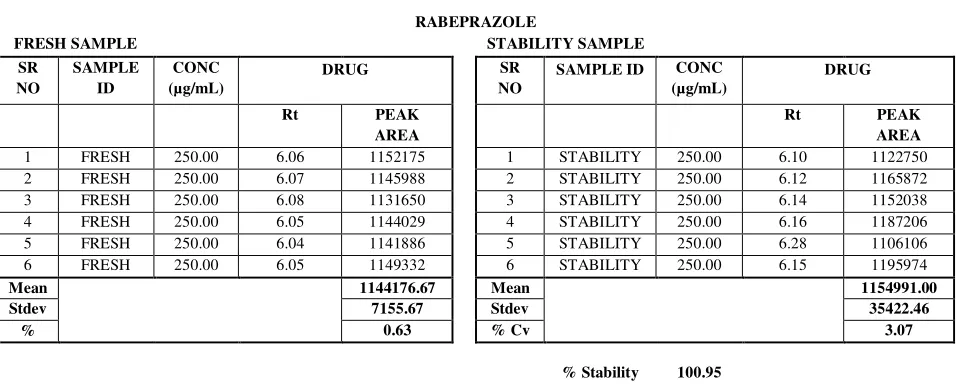
3.2.6 Room Temperature Stability
29
mean peak area of the stability sample to the mean peak area of the fresh sample and expressed as the percentage (n=6). The room temperature stability was found to be 120.85 % for Rabeprazole and 110.95 % for Levosulpiride. The results are tabulated in Table-6.
3.2.7 Stress Degradation
Stress studies revealed that Rabeprazole is not susceptible to degradation under acid, light (UV) and oxidative stress conditions (Fig 5a). However, in alkaline conditions (0.1N NaOH), the drug was instable and the degradation peak eluted earlier accompanied with a drastic peak distortion and increased tailing. Except for alkaline conditions, the drug content was within 95 –105 % for all stress conditions indicating the stability and specificity of the analytical method to differentiate the degradation peaks.
Stress studies on Levosulpiride indicated instability under alkaline conditions. This has been clearly demonstrated by the help of overlap spectra of all the stress samples as compared with that of freshly prepared sample of similar concentration (Fig 5b).
3.2.8 Robustness study
Robustness is the measure of method capacity to remain unaffected by deliberate small changes in the chromatographic conditions. The experimental conditions were deliberately altered to evaluate the robustness of the method. The impact of flow-rate (1.0 ± 0.1 ml/min), and effect of mobile-phase composition (± 5%) on chromatographic parameters such as retention time, theoretical plates, and tailing factor, were studied.
At lower flow rate, the retention time of Rabeprazole was 4.63 ± 0.10 minutes while that of Levosulpiride was 2.48 ± 0.10 minutes . At lower flow rate, the tailing factor for Rabeprazole increased to 1.27 ± 0.03 while that of Levosulpiride 1.33± 0.03. At higher flow rate, tailing factor for Levosulpiride is 1.28 and Rabeprazole 1.34. The elution was earlier at higher flow rate; Rabeprazole and Levosulpiride eluted at 3.79 ± 0.01 and 2.06 ± 0.02 minutes respectively. The retention time of Rabeprazole and Levosulpiride were 4.63 ± 0.02 and 2.48 ± 0.03 minutes respectively (n=6) when the mobile phase composed of 75 methanol and 25 parts of 20m orthophosporic acid (pH 3.0).
3.3 Application of the method to dosage forms
The HPLC method developed is sensitive and specific for the quantitative determination of Rabeprazole and Levosulpiride. Also the method is validated for different
parameters; hence it has been applied for the simultaneous estimation in pharmaceutical dosage forms. RABEKIND was evaluated. The % assay of Levosulpiride in the tablet is 99.85% and that of Rabeprazole is . 101.25 %. None of the tablets ingredients interfered with the analyte peak. The spectrum of Rabeprazole and Levosulpiride in the extracted tablet was matching with that of standard compounds indicating the purity of the compounds in the tablets
Conclusions
30
Table 1. System Suitability test for Rabeprazole and Levosulpiride
RABEPRAZOLE
Sample ID Peak Retention Time Peak Area Theoretical Plates Tailing Factor
1 4.22 1062533 11196 1.26
2 4.19 1038058 11318 1.26
3 4.21 1039651 11349 1.26
4 4.16 1045551 11139 1.29
5 4.13 901577 11740 1.30
6 4.13 975363 11648 1.32
MEAN 4.17 1010455.5 11398.3 1.28
STDEV 0.039 61063.98 243.37 0.026
%CV 0.942 6.04 2.135 1.99
LEVOSULPIRIDE
Sample ID Peak Retention Time Peak Area Theoretical Plates Tailing Factor
1 2.24 1101145 5023 1.24
2 2.22 932987 5029 1.26
3 2.23 978884 5054 1.25
4 2.22 1020780 5062 1.26
5 2.22 910838 5196 1.28
6 2.23 1085389 5149 1.26
MEAN 2.24 1005003.8 5085.5 1.25
STDEV 0.0055 78344.95 70.54 0.013
%CV 0.25 7.80 1.387 1.05
Fig-3a: Linear calibration curve of Rabeprazole.
Fig-3b: Linear calibration curve of Levosulpiride.
y = 38,506.5099x - 51,390.6253 R² = 0.9969
-500000 0 500000 1000000 1500000 2000000
0.00 20.00 40.00 60.00
Series1
Linear (Series1)
y = 17,646.0638x - 34,783.3811 R² = 0.9909
-500000 0 500000 1000000 1500000 2000000
0 50 100 150
Series1
31
Table 2. Sensitivity
RABEPRAZOLE LEVOSULPIRIDE
LOD LOD
SR NO DRUG SR NO DRUG
Retention Time Peak Area Retention Time Peak Area
1 4.22 10201 1 2.26 19985
2 4.22 11124 2 2.26 19788
3 4.18 10525 3 2.22 19739
MEAN 4.20 24833.3 MEAN 2.24 17170.7
ST DEV 0.023 3942.05 ST DEV 0.02 2275.06
% CV 0.54 15.8 % CV 1.02 13.24
RABEPRAZOLE LEVOSULPIRIDE
LOQ LOQ
SR NO DRUG SR NO DRUG
Retention Time Peak Area Retention Time Peak Area
1 4.17 24641 1 2.22 28845
2 4.21 27367 2 2.25 25966
3 4.21 30266 3 2.26 29813
MEAN 4.19 24091.3 MEAN 2.24 28208
ST DEV 0.023 3562.9 ST DEV 0.02 2001.04
% CV 0.550 14.8 % CV 0.927 7.09
Fig-4: Comparison of (a)Blank Chromatogram, (b) Rabeprazole alone (c) Levosulpiride alone and
(d) sample containing both Levosulpiride and Rabeprazole
a. Blank sample b. Rabeprazole sample
32
Table 3. Results of best-fit line for triplicate analysis for Levosulpiride and Rabeprazole
Levosulpiride
Curve Slope Intercept r2
1 17646.06 -34783.38 0.9909
2 18252.90 -48513.16 0.9948
3 18640.97 -54287.53 0.9953
Mean 18179.97 -137584.07 0.99366
Rabeprazole
Curve Slope Intercept r2
1 38506.50 -51390.62 0.9969
2 39467.15 -78151.81 0.9962
3 39738.57 -79858.22 0.9946
Mean 39237.40 -209400.65 0.9959
Table 4. Linearity and Range for Levosulpiride and rabeprazole demonstrating accuracy, carryover effect and
specificity of the method (Curve 1).
LEVOSULPIRIDE
SAMPLE ID Concentration
(Microgram/mL) Retention Time Peak Area
Back Calc
Concentration % Accuracy
BLANK 0 NO PEAK 0 NA NA
CC 1 10.00 2.26 142567 10.05 100.50
CC 2 20.00 2.26 353611 22.01 110.05
CC 3 30.00 2.26 442951 27.07 90.24
CC 4 40.00 2.26 705462 41.95 104.87
CC 5 60.00 2.26 918789 54.04 90.06
CC 6 80.00 2.26 1306797 76.03 95.03
CC 7 90.00 2.26 1629827 94.33 104.82
CC 8 100.00 1.62 1774753 102.55 102.55
CO BLANK 0 NO PEAK 0 NA NA
• NA - Not applicable
NA - Not applicable
RABEPRAZOLE
SAMPLE ID Concentration (Microgram/mL)
Retention
Time Peak Area
Back Calc
Concentration % Accuracy
BLANK 0.00 NO PEAK 0 NA NA
CC 1 5.00 4.42 138752 4.94 98.76
CC 2 10.00 4.44 334571 10.02 100.23
CC 3 15.00 4.44 493687 14.16 94.37
CC 4 20.00 4.47 722196 20.09 100.45
CC 5 30.00 4.46 1023915 27.92 93.08
CC 6 40.00 4.46 1483126 39.85 99.63
CC 7 45.00 4.46 1719781 46.00 102.21
CC 8 50.00 4.48 1900356 50.69 101.37
33 Table 5a. Results of inter and intra-day accuracy & precision for levosulpiride
Nominal Concentration (µ g/mL)
25.00 50.00 75.00
DAY 1
MEAN (n=6) 26.37 52.50 77.09
SD 1.7331 1.6663 2.9448
% CV 6.573 3.174 3.820
DAY 2
MEAN (n=6) 26.17 52.82 77.65
SD 1.0087 1.6410 2.6389
% CV 3.855 3.106 3.398
DAY 3
MEAN (n=6) 25.65 52.71 77.51
SD 0.7023 1.246 3.218
% CV 2.7376 2.3645 4.129
Table 5b. Results of inter and intra-day accuracy & precision for Rabeprazole
Nominal Concentration (µ g/mL)
25.00 50.00 75.00
DAY 1
MEAN (n=6) 12.92 26.22 39.70
SD 0.494 0.539 1.068
% CV 3.824 2.055 2.691
DAY 2
MEAN (n=6) 12.73 26.13 39.57
SD 0.384 0.446 1.104
% CV 3.019 1.709 2.790
DAY 3
MEAN (n=6) 12.54 26.04 39.44
SD 0.317 0.408 1.198
34 Fig-5a: Overlay Chromatogram showing the influence of various stress conditions on Rabeprazole; Data 1-Acid
Stress, Data 2 – Oxidative Stress; Data 3 – Photolytic Stress; Data 4 – Alkaline Stress. Data 4 clearly
indicates the spectral degradation of Rabeprazole due to alkaline instability.
Fig-5b: Overlay Chromatogram showing the influence of various stress conditions on Levosulpiride; Data
1-Acid Stress, Data 2 – Oxidative Stress; Data 3 –Photolytic Stress; Data 4 – Alkaline Stress.. Data 3
shows the Photolytic degradation product of Levosulpiride Data 4 clearly indicates the spectral
35 Table 6a. Room Temperature Stability of Rabeprazole (n = 6).
RABEPRAZOLE
FRESH SAMPLE STABILITY SAMPLE
SR NO
SAMPLE ID
CONC (µg/mL)
DRUG SR
NO
SAMPLE ID CONC (µg/mL)
DRUG
Rt PEAK
AREA
Rt PEAK
AREA
1 FRESH 250.00 6.06 1152175 1 STABILITY 250.00 6.10 1122750
2 FRESH 250.00 6.07 1145988 2 STABILITY 250.00 6.12 1165872
3 FRESH 250.00 6.08 1131650 3 STABILITY 250.00 6.14 1152038
4 FRESH 250.00 6.05 1144029 4 STABILITY 250.00 6.16 1187206
5 FRESH 250.00 6.04 1141886 5 STABILITY 250.00 6.28 1106106
6 FRESH 250.00 6.05 1149332 6 STABILITY 250.00 6.15 1195974
Mean 1144176.67 Mean 1154991.00
Stdev 7155.67 Stdev 35422.46
% 0.63 % Cv 3.07
% Stability 100.95
Table 6b. Room Temperature Stability of levosulpiride (n = 6).
LEVOSULPIRIDE
FRESH SAMPLE STABILITY SAMPLE
SR NO SAMPL E ID
CONC (µg/mL
)
DRUG SR NO SAMPLE ID CONC
(µg/mL )
DRUG
Rt PEAK
AREA
Rt PEAK
AREA
1 FRESH 50.03 8.94 3754020 1 STABILITY 50.03 9.08 3712110
2 FRESH 50.03 8.97 3745764 2 STABILITY 50.03 9.14 3717038
3 FRESH 50.03 8.97 3733460 3 STABILITY 50.03 9.19 3670043
4 FRESH 50.03 8.93 3731874 4 STABILITY 50.03 9.22 3734664
5 FRESH 50.03 8.93 3717159 5 STABILITY 50.03 9.32 3705677
6 FRESH 50.03 8.95 3726962 6 STABILITY 50.03 9.20 3739258
MEAN 3734873.17 MEAN 3713131.67
STDE 13210.46 STDE 24798.13
% CV 0.35 % CV 0.67
36 References:
1. Mucci A, Nolfe G and Maj M: Levosulpiride A review of its clinical use in psychiatry. Pharmacology and Respiratory 1995; 31: 95-101 2. Sabnis SS, Dhavale ND, Jadhav VY, Gandhi SV,
Spectrophotometric simultaneous determination of Rabeprazole Sodium and Itopride Hydrochloride in capsule dosage form. Spectrochimica Acta, 2008; 69: 849-852
3. Tonini M, Cipollina L, Poluzzi E, Crema F, Corazza G and De Ponti F: Clinical implications of enteric and central D2 receptor blockade by antidopaminergic gastrointestinal prokinetics. Aliment Pharmacology and Therapeutics 2004; 19: 379-90.
4. Lozano R, Peralta Concha M, Montealegre A, de Leon A, Ortiz Villalba J and Esteban H: Effectiveness and safety of Levosulpiride in the treatment of dysmotility-like functional dyspepsia. Therapeutics and Clinical Risk Management 2007; 3: 149-155.
5. The Martindale 35th ed: The complete drug reference, published pharmaceutical press, lambeta high street, londan SEI 75M, UK. 2006.
6. Rena S, Park M, Sah H, and Lee B, Effect of pharmaceutical excipients on aqueous stability of rabeprazole sodium. International J. Pharmaceutics, 2008; 350: 197-204.
7. Ramakrishna NVS, Vishwottam KN, Wishu S, Koteshwara M, Suresh Kumar S, High performance liquid chromatography method for the quantification of rabeprazole in human plasma using solidphase extraction. J. of Chromatography B, 2005; 816: 209-214.
8. Venkatesh chouhan*, Shobha manjunath, S.Sandeep, Spectrophotometric estimation of levosulpiride in bulk drug and formulations, Int J Pharm Pharm Sci, Vol 3, Issue 2, 2011, 135-137. 9. Yogesh P. Agrawal, Surya Prakash Gautam, Ajay
Verma, Mona Y. Agrawal and Arun K. Gupta, Simultaneous estimation of esomeprazole and levosulpiride in solid dosage form, Pelagia Research Library Der Pharmacia Sinica, 2012, 3 (3):337-342. 10. S.P. Silambarasan, K. Anandakumar, R.
Venkatalakshmi and C. Sasikala, Development of UV Spectrophotometry and RP-HPLC Methods for the Estimation of Levosulpiride in Bulk and in Tablet Formulation Asian J. Research Chem. 3(3): July- Sept. 2010, 542-544.
11. Snehalatha.t*, Padmalatha.m, Ramya.s, Kanakadurga.m, A simple and validated rp-hplc method for the simultaneous estimation of rabeprazole and Levosulpiride in bulk and pharmaceutical dosage forms, int. res j pharm. app sci., 2012; 2(2):99-106.
12. N.B. Dobaria, N. H. Vadia and S. J. Rajput, Simultaneous Spectrophotometric Estimation of Rabeprazole Sodium and Domperidone Maleate in their Combined Pharmaceutical Dosage Form, International Journal of Chem Tech Research, Vol.1, No.4, pg.no-1162-1166, Oct-Dec 2009.
13. Patel Vandana. B.*, Baldha R. G, and Mayank Bapna, Simultaneous Spectrophotometric Estimation of Rabeprazole Sodium and Domperidone in combined dosage forms, International Journal of PharmTech Research, Vol.2, No.2, pp 1563-1568, April-June 2010. 14. Janhavi R Rao*, Vishal V Bharekar, Toufik S
Mulla, Savita S Yadav, and milind P Raj, validated hptlc method for simultaneous estimation of rabeprazole sodium and aceclofenac in bulk drug and formulation, international journal of comprehensive pharmacy 2011, 5 (06).
15. Mallikarjuna rao.N*, Development and Validation of Stability Indicating HPTLC method for Simultaneous Estimation of Paracetamol, Aceclofenac and Rabeprazole in Combined Tablet Dosage Formulation, International Journal of PharmTech Research, Vol. 3, No.2, pp 909-918, April-June 2011. 16. Prasanna Reddy Battu* and MS Reddy,
Development and Validation of RP-HPLC for the Rabeprazole sodium in Pharmaceutical formulations and Human Plasma, Asian J. Research Chem. 2(1):49-51, Jan.-March, 2009. 17. Vaithiyanathan Sree Janardhanan*, Rajappan