BALLOT BEDLAM
SAMUEL ISSACHAROFF†
ABSTRACT
In both law and public scrutiny, renewed attention is being given to the simple act of casting a ballot. At a time when the formal act of voting has been relaxed, and more than a third of Americans cast their ballots in a manner other than voting at the polls on Election Day, there is a decided pushback. In some sense this is hardly novel; questions of ballot integrity and ballot access have been recurring issues in the United States from Reconstruction to the Civil Rights Era. In both of these previous eras, enfranchisement and disenfranchisement had a partisan edge, but were understood to be battles over the black franchise—and properly so. Whether that remains the case is the subject of this Article.
The inquiry begins with the partisan implications of turnout and focuses primarily on the partisan dimension of new efforts at ballot restriction. This Article contends that although issues of the franchise correlate with race, as does the partisan divide between Democrats and Republicans, the new battles over ballot access do not readily lend themselves to a narrative that focuses primarily on racial exclusion. Rather, they point to a deep vulnerability of American democracy in entrusting election administration and election eligibility to local partisan control.
TABLE OF CONTENTS
Introduction ... 1364
I. The Rules of Voting ... 1371
II. Fraud, Vote Suppression, and the Power of Faith ... 1377
III. Race and Partisanship in Voting-Rights Law ... 1387
A. The Evolution of the Modern Right To Vote ... 1387
B. Voting Rights and Bipartisan Competition... 1392
Copyright © 2015 Samuel Issacharoff.
IV. Vote Denial in an Era of Partisan Competition ... 1400
A. Complications in the Voting-Rights Model ... 1400
B. A Law of Democracy Through the Prism of Race ... 1403
Conclusion ... 1408
INTRODUCTION
Every four years, election coverage focuses heavily on an elusive band of Americans thought to inhabit remote parts of the country. This mysterious group is usually termed the “undecided voters” (or occasionally the “independent voters”), whose lack of partisan affiliation and firm convictions is deemed to forecast how the oscillating center of the American political spectrum is going to tip the election. This otherwise unknown and unseen group then gathers briefly in its preferred habitat: the tightly orchestrated focus-group room of a television network. Some Americans, looking for a break from campaign attack advertisements, actually watch the deliberations of the uncertain, indulging themselves with only an occasional snicker, while thinking, “who are these people?” Even for those who want to see how people on the eve of a presidential election could in fact remain undecided, what remains unaddressed is whether the preferences of this small vacillating group are actually going to decide the election.
An alternative hypothesis would have it that this group of undecideds is not only hard to find in the real world, but also not a meaningful barometer for election forecasting. Instead, it may be that elections are not won and lost primarily in the minds of this elusive group of the undecided, but instead, following the political wisdom of Woody Allen, that 80 percent of success is just showing up.1
On this view, the bulk of the electorate has reasonably fixed political preferences that are unlikely to shift in the waning hours of the never-ending election cycle. Consider that President Barack Obama won handily in 2008 and 2012 with more than half of the popular vote and well in excess of 60 percent of the Electoral College vote.2 Yet in
1. See Lynn Vavreck, The Myth of Swing Voters in Midterm Elections, N.Y.TIMES (Apr. 22, 2014), http://www.nytimes.com/2014/04/23/upshot/the-myth-of-swing-voters-in-midterm-elections.html (defending this thesis). For citation to the Woody Allen quote, see Garson O’Toole, Showing Up Is 80 Percent of Life, QUOTE INVESTIGATOR (June 10, 2013), http://quoteinvestigator.com/2013/06/10/showing-up (discussing myriad potential sources and attributions for the quote typically attributed to Woody Allen).
2010, the Republicans won more than half of the national popular vote and swept the table, gaining control of the U.S. House of Representatives.3
Following the story of the undecided voters would indicate that they swung heavily to Obama in 2008, to the Republicans in 2010, and then back to Obama in 2012—a rather extraordinary account of political mass migrations.
Although it is possible that such massive shifts took place, a simpler account is provided by examining the correlation between turnout and partisan success:
(Obama popular-vote totals); 2008 Electoral College Results, U.S. ARCHIVES, http://www .archives.gov/federal-register/electoral-college/2008/election-results.html (last visited Mar. 10, 2015) (Obama 2008 Electoral College vote and popular-vote totals; percentages calculated by author); 2012 Electoral College Results, U.S. ARCHIVES, http://www.archives.gov/federal-register/electoral-college/2012/election-results.html (last visited Mar. 10, 2015) (Obama 2012 Electoral College vote and popular-vote totals; percentages calculated by author).
Table 1. Voter Turnout and Partisan Success4
The simpler account is that Democrats seem to do better when voter turnout is higher, and worse when turnout is lower. Certainly there is an interactive effect such that the correlation does not establish causation, but even the simple correlation presented in Table 1 is noteworthy, and not just to the casual observer. In 2012, commentators and campaigns alike operated under the assumption that if the electorate were the same as in 2008, President Obama
4. “Successful party” is defined as the party that gained seats in that election. See Reported Voting and Registration by Race, Hispanic Origin, Sex, and Age Groups: November 1964 to 2012, U.S. CENSUS BUREAU, A1 (Feb. 2012), http://www.census.gov/hhes/www/socdemo/voting/publications/historical/index.html (turnout data pulled from spreadsheet); Election Results, FED.ELECTION COMM’N, http://www.fec.gov/ pubrec/electionresults.shtml (last visited Mar. 10, 2015) (election results for House and Senate). 5. Compare FED.ELECTION COMM’N, FEDERAL ELECTIONS 2008:ELECTION RESULTS FOR THE U.S.PRESIDENT, THE U.S.SENATE AND THE U.S.HOUSE OF REPRESENTATIVES 3 (2009) [hereinafter FEDERAL ELECTIONS 2008], available at http://www.fec.gov/pubrec/ fe2008/federalelections2008.pdf (reporting that after the 2008 general election, fifty-seven Democrats would serve in the Senate and 257 in the House), with FED.ELECTION COMM’N, FEDERAL ELECTIONS 2006:ELECTION RESULTS FOR THE U.S.SENATE AND THE U.S.HOUSE OF REPRESENTATIVES 3 (2007) [hereinafter FEDERAL ELECTIONS 2006], available at
http://www.fec.gov/pubrec/fe2006/federalelections2006.pdf (reporting that after the 2006 general election, forty-nine Democrats would serve in the Senate and 233 in the House).
6. Compare FED.ELECTION COMM’N, FEDERAL ELECTIONS 2010:ELECTION RESULTS FOR THE U.S.SENATE AND THE U.S. HOUSE OF REPRESENTATIVES 3 (2011) [hereinafter FEDERAL ELECTIONS 2010], available at http://www.fec.gov/pubrec/fe2010/federal elections2010.pdf (reporting that after the 2010 general election, forty-seven Republicans would serve in the Senate and 242 in the House), with FEDERAL ELECTIONS 2008,supra note 5, at 3 (reporting that after the 2008 general election, forty-one Republicans would serve in the Senate and 178 in the House).
7. Compare FED.ELECTION COMM’N, FEDERAL ELECTIONS 2012:ELECTION RESULTS FOR THE U.S.SENATE AND THE U.S.HOUSE OF REPRESENTATIVES 3 (2013) [hereinafter FEDERAL ELECTIONS 2012], available at http://www.fec.gov/pubrec/fe2012/federal elections2012.pdf (reporting that after the 2012 general election, fifty-three Democrats would serve in the Senate and 201 in the House), withFEDERAL ELECTIONS 2010,supra note 6, at 3 (reporting that after the 2010 general election, fifty-one Democrats would serve in the Senate and 193 in the House).
Year Turnout (as % of citizens)
Senate Seats Gained by Successful Party
House Seats Gained by Successful Party
Successful Party
20085 63.6% 8 24 Democrats
20106 45% 6 64 Republicans
would be reelected, and if it were the same as in 2010, he would be defeated by Mitt Romney.8
Understood against the measure of turnout, the well-publicized meltdown of Karl Rove on national television in response to Obama’s 2012 win in Ohio was no send-up.9 Republicans genuinely believed they would win—not on the basis of poll numbers disputing the prediction of the invariably accurate Nate Silver, but on the basis of turnout projections that substantially underestimated the effectiveness of the electoral machinery that Obama for America had spent years honing.10
In many ways, this was simply a variant of the Democratic incredulity that Republicans could win Ohio in 2004 based on a similar lack of insight into how Republican electoral-machine advances could produce a stunning turnout in Southern Ohio. Both campaigns understood the centrality of turnout in electoral battles, and there was a bit of technological leapfrogging as their campaigns adapted to the changing electoral landscape.
The changed electoral landscape exists across three different dimensions. Each is a topic unto itself, but I will only posit them here
8. See, e.g., JONATHAN ALTER,THE CENTER HOLDS:OBAMA AND HIS ENEMIES 4 (2013) (“Only 80 million Americans voted in 2010, compared to 130 million in 2008 . . . . Where were those missing 50 million voters? They would have to be lured back to the polls if Obama was to have any chance of re-election.”); Ronald Brownstein, Republicans Can’t Win with White Voters Alone, THE ATLANTIC, (Sept. 7, 2013, 8:00 AM), http://www.theatlantic.com/politics/archive/ 2013/09/republicans-cant-win-with-white-voters-alone/279436 (“Throughout 2012, many Republicans anticipated that the white proportion of the vote would increase from 2008 and even quietly based their polling on that assumption; but, ultimately, the white share of the vote followed the long-term trend and fell to 72 percent—exactly the level that Obama campaign manager Jim Messina projected early in the year.”); Jan Crawford, Adviser: Romney “Shellshocked” by Loss, CBSNEWS.COM (Nov. 8, 2012, 5:57 PM), http://www.cbsnews.com/ news/adviser-romney-shellshocked-by-loss/2 (“‘They were right,’ a Romney campaign senior adviser said of the Obama campaign’s assessments [of voter turnout]. ‘And if they were right, we lose.’”); Karl Rove, Obama’s Shrinking Majority, ROVE.COM (July 12, 2012), http://www .rove.com/articles/397 (describing Obama’s challenge in no small part as increasing racial-minority turnout); William Frey, Minority Turnout Determined the 2012 Election, BROOKINGS INST. (May 10, 2013), http://www.brookings.edu/research/papers/2013/05/10-election-2012-minority-voter-turnout-frey (conducting a post-election analysis confirming these predictions).
9. Karl Rove was a live commentator on Fox News during the 2012 count and pointedly rejected the network’s own early analysis that Obama would win Ohio and with it (in essence) the Presidency. See Gabriel Sherman, How Karl Rove Fought with Fox News over the Ohio Call, N.Y.MAG. (Nov. 7, 2012, 12:49 PM), http://nymag.com/daily/intelligencer/2012/11/how-rove-fought-with-fox-over-ohio.html (including a video of the incident).
and then try to assess the current battles over voter access under the assumption that these changes are real and important.
First, the parties and the electorate as a whole have become increasingly polarized. Party polarization is now at its highest levels since Reconstruction:11 there is currently no overlap in the party delegations in Congress, meaning that no Republican votes more on the liberal side than any Democrat, and correspondingly, no Democrat votes more on the conservative side than any Republican.12
The electorate has become similarly polarized, with a reduction in overlapping views across a range of issues, and even in overlapping
sources of information.13 Modern forms of communication,
particularly cable news outlets and internet sources, allow for sharp demarcations between what may be thought of as the Fox News and MSNBC demographics.14
As a result, there are increasingly divided sets of voters choosing from among well-differentiated candidates.15
The parties have responded to the hollowing out of the center and the centrality of turnout by directing their campaigns toward voter mobilization rather than appeals to the median voter,16 as predicted by the spatial-market theories of economic theorists Harold
11. See Dylan Matthews, It’s Official: The 112th Congress Was the Most Polarized Ever, WASH.POST (Jan. 17, 2013), http://www.washingtonpost.com/blogs/wonkblog/wp/2013/01/17/its-official-the-112th-congress-was-the-most-polarized-ever (examining recent DW-NOMINATE scores, which are the industry-standard means of measuring ideological polarization).
12. See Drew Desilver, The Polarized Congress of Today Has Its Roots in the 1970s, PEW RESEARCH CTR. (June 12, 2014), http://www.pewresearch.org/fact-tank/2014/06/12/polarized-politics-in-congress-began-in-the-1970s-and-has-been-getting-worse-ever-since (tracking the polarization in Congress over time).
13. See generally Political Polarization in the American Public, PEW RESEARCH CTR. (June 12, 2014), http://www.people-press.org/2014/06/12/political-polarization-in-the-american-public (examining popular polarization).
14. See Amy Mitchell, Jeffrey Gottfried, Jocelyn Kiley & Katerina Eva Mats, Political Polarization and Media Habits, PEW RESEARCH CTR. (Oct. 21, 2014), http://www.journalism .org/2014/10/21/political-polarization-media-habits (documenting general trends in media polarization).
15. For an overview of the literature on the polarization of the electorate, see Richard H. Pildes, Romanticizing Democracy, Political Fragmentation, and the Decline of American Government,124 YALE L.J. 804, 821–24 (2014).
Hotelling and Anthony Downs.17
A mobilization strategy requires both activist volunteers and money, and both party activists and donors are more drawn from the ideological poles of the party than is the typical voter, even the typical voter within each party. Median-voter theories of parties hewing toward the center assume a stable electoral base, something that may be true in countries with compulsory voting, such as Australia or Argentina,18
but not where turnout may be the critical variable. There is no reason to assume that strategies aimed at capturing the median point of the overall political distribution of preferences would be more likely to increase turnout. In fact, such strategies might be counterproductive in terms of mobilizing the base.
Second,the legal framework has also been altered. Most notably, the Supreme Court decision in Shelby County v. Holder19
struck down the trigger mechanism for Section 5 of the Voting Rights Act (VRA)—the provision that forces some jurisdictions, primarily in the former Jim Crow South, to submit proposed voting changes for administrative preclearance by the Department of Justice (DOJ), or by judicial declaration in the D.C. District Court.20 With the effective termination of Section 5, there is a legal path to implementing restrictions on voter access in states like North Carolina and Texas. Indeed, of the nine states that were completely covered under Section 5, only Virginia is not currently under uniform Republican control.21 The termination of Section 5 came at a time when the DOJ was in Democratic hands and the previously covered states capable of restricting voter access were, by and large, under Republican control.22
17. See Samuel Issacharoff, Collateral Damage: The Endangered Center in American Politics, 46WM.&MARY L.REV.415,422(2004) (discussing the spatial model of political distributions proposed by Downs, on the basis of work on spatial distribution by Hotelling). 18. See Compulsory Voting, INT’L INST. FOR DEMOCRACY &ELECTORAL ASSISTANCE (Feb. 17, 2015), http://www.idea.int/vt/compulsory_voting.cfm (listing all countries with some form of compulsory voting, including one obscure Swiss canton).
19. Shelby Cnty. v. Holder, 133 S. Ct. 2612 (2013). 20. Id. at 2631.
21. See Kennedy Elliott & Dan Balz, Party Control by State, WASH.POST (Dec. 28, 2013), http://www.washingtonpost.com/wp-srv/special/national/red-blue (listing states controlled by a single political party); Jurisdictions Previously Covered by Section 5, VOTING SECTION, U.S. DEP’T OF JUSTICE, http://www.justice.gov/crt/about/vot/sec_5/covered.php (last visited Mar. 10, 2015) (listing covered jurisdictions).
Third, the single predictor necessary to determine whether a state will impose voter-access restrictions is whether Republicans control the ballot-access process. This is not intended as a normative claim, but simply as a real-world fact of life. Voting restrictions are not only likely to be found in Republican-controlled jurisdictions, but are also likely to be similar in kind across those jurisdictions.23 Part of this could be copying or learning from the experiences of other states. But the similarity of these voting restrictions in form, and their prevalence across states with significantly different prior voting regimes and divergent demographics, points to something else. The likeliest hypothesis is that both political parties have a similar understanding of the relation between turnout and electoral outcomes, and both parties understand voting access as a threshold determinant of turnout.
This Article offers several observations about the changed legal and political environment pertaining to the right to vote. With a focus on turnout comes an appreciation that election rules matter and that control of the rules can affect balloting and results. Although this has long been known to political insiders, the battle for control of the rules of the game has not generally played out on the national stage. Unfortunately, all this changed with the contested presidential election in Florida in 2000, and the legal battles leading to Bush v. Gore.24 Beginning with the run-up to the 2010 elections, and then heating up after their loss in 2012, Republicans—as the “out” party— turned to ballot-access reform as a major strategic aim, justified by the claimed need to combat fraud at the polls.25
In turn, the pitched battles over ballot access have brought the most basic issues of the franchise back into mainstream legal and political discourse. The coincidence between the rise of ballot-access
issues and the Supreme Court’s decision in Shelby County
complicates the picture. The demise of the trigger for administrative oversight under the VRA after Shelby County highlights the
23. Seeinfra Table 2.
24. Bush v. Gore, 531 U.S. 98 (2000).
inevitable racial impact of any strategy to reduce Democratic voter turnout26 or, correspondingly, of Democratic efforts to increase turnout.27
There is an inescapable overlap between Democratic voters who might be screened out by ballot restrictions, and the minority communities whose voting rights were the object of the VRA. In many jurisdictions the efforts at partisan gain look very much like older efforts at racial exclusion. To the conventional question whether the renewed ballot restrictions should be understood in terms of race or party, the answer unfortunately is yes. Race and party are intertwined to such a large extent that it is difficult to disentangle the two when seeking a simple narrative of causation.28
But the more difficult question is a different one: How is it that a mature democracy like the United States still allows basic rules of ballot access to be a battleground for political skirmishing?
I. THE RULES OF VOTING
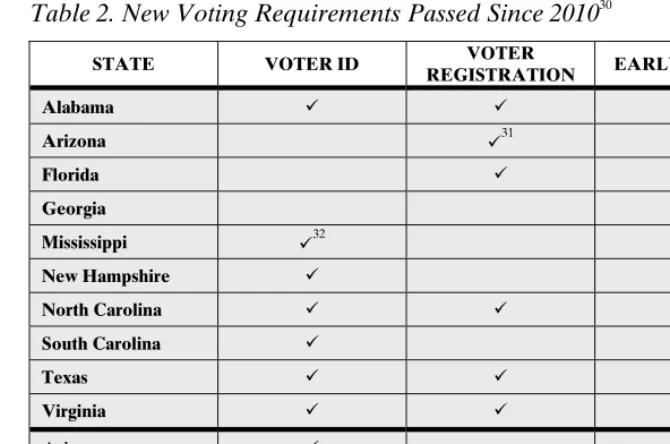
As the following depiction (Table 2) shows, there is a strong correlation between Republican control of the election-administration process in a state and the efforts made to regulate ballot access more intensively in that state. Table 2 shows both states previously covered by Section 5, and those that were not covered. The operative variable in all circumstances is which party is in control in any particular state. The types of regulations include increased voter-ID requirements for in-person voting, stricter voter-registration requirements, and curtailment of early-voting opportunities. These regulations are most likely to emerge when there is a Republican governor and Republican control of the state legislature.29
In fact,
26. See, e.g., Jamelle Bouie, Republicans Admit Voter-ID Laws Are Aimed at Democratic Voters, THE DAILY BEAST (Aug. 28, 2013), http://www.thedailybeast.com/articles/2013/08/28/ republicans-admit-voter-id-laws-are-aimed-at-democratic-voters.html (documenting examples of Republican candor about an anti-Democratic voting strategy, and studies of the racial salience thereof).
27. See Jonathan Martin, At Risk in Senate, Democrats Seek To Rally Blacks,N.Y.TIMES, Aug. 31, 2014, at A1 (describing the Democratic Party’s efforts to increase minority-voter turnout).
28. See Richard Hasen, Race or Party?: How Courts Should Think About Republican Efforts To Make It Harder To Vote in North Carolina and Elsewhere, 127 HARV.L.REV.F. 58, 67 (2014).
Republican-with the exception of a voter-ID requirement in Rhode Island and some alterations in Illinois and West Virginia, these restrictions are in force only in states under Republican control.
Table 2. New Voting Requirements Passed Since 201030
STATE VOTER ID VOTER
REGISTRATION EARLY VOTING
Alabama
Arizona 31
Florida
Georgia
Mississippi 32
New Hampshire
North Carolina
South Carolina
Texas
Virginia
Arkansas
Illinois
Indiana
controlled legislatures and Republican governors. Wendy Weiser & Erik Opsal, The State of Voting in 2014, BRENNAN CTR. FOR JUSTICE (June 17, 2014), http://www.brennan center.org/analysis/state-voting-2014 (providing a comprehensive account of election-law changes since 2010).
30. Table 2 draws on data from the Brennan Center’s compilation of state laws. See Weiser & Opsal, supra note 29. Bold text indicates states that were once completely or partly covered under Section 5. Highlighting indicates states that were under Republican control at the time of the VRA’s passage. See VOTING SECTION, U.S.DEP’T OF JUSTICE, supra note 21 (listing previously covered jurisdictions). I deem a state to have been under Republican control if two out of three of the state’s senate, house, and governorship were controlled by Republicans. Restrictions that were passed but later repealed are excluded.
Kansas 33
Montana 34
Nebraska
North Dakota
Ohio 35
Pennsylvania
Rhode Island
Tennessee
West Virginia
Wisconsin
Consider three states: Texas, North Carolina, and Wisconsin. Under Section 5, preclearance of proposed voting changes by the DOJ was triggered by the existence of restrictive voting practices and depressed voter turnout in the 1964 presidential election. The coverage formula generated by 1964 presidential-election statistics yielded inclusion under the preclearance regime for entire states in the old Confederacy, and for some counties in other states, including Northern states such as New York or South Dakota.36
Of the states under consideration, only Texas was subject to Section 5 under the now-defunct coverage formula. North Carolina, a border state, had been partially covered; Wisconsin was not covered at all.37 Yet all three have adopted largely similar voter-ID laws in more-or-less the same time frame, and did so before Section 5 was rendered impotent in Shelby County.38
These three states have little in common, save that
33. As with Arizona, Kansas’s voter-registration restrictions are enjoined pending a lawsuit initiated by the secretary of state to push federal officials to help enforce proof-of-citizenship measures. See Kobach, 772 F.3d at 1199.
34. Montana attempted, but ultimately failed, to abolish same-day registration by referendum. See Damon Daniels, Montana Voters Keep Same-Day Registration, DEMOS (Nov. 7, 2014), http://www.demos.org/blog/11/7/14/montana-voters-keep-same-day-registration.
35. Ohio’s restriction on early voting was partially the result of interventions by the Republican secretary of state. See Zachary Roth, Ohio Cuts Early Voting Method Favored by Blacks, MSNBC.COM (Feb. 25, 2014 3:24 PM), http://www.msnbc.com/msnbc/ohio-early-voting-cuts.
36. U.S. DEP’T OF JUSTICE, JURISDICTIONS PREVIOUSLY COVERED BY SECTION 5, http://www.justice.gov/crt/about/vot/sec_5/covered.php (last visited Mar. 10, 2015).
37. VOTING SECTION,U.S.DEP’T OF JUSTICE,supra note 21.
38. Shelby County v. Holder, 133 S. Ct. 2612 (2013), was handed down on June 25, 2013. Both Wisconsin and Texas adopted their respective voter-ID laws long before this date. See
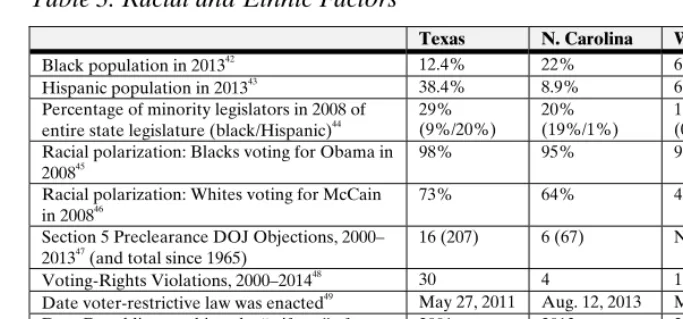
they were, at the time of Section 5’s invalidation, uniformly under Republican control.39 Indeed, the contrast between our three cases becomes even starker when we consider the various factors identified in the Senate Report for a different provision of the VRA, Section 2,40 which addressed diminished minority electoral opportunity. The following Senate Report factors in Table 3 can be easily statistically measured:41
considering its voter-ID laws before Shelby County, at which point its primary state-Senate sponsor ominously—and without further explanation—declared: “‘So, now we can go with the full bill,’” one that included a panoply of other restrictions. N.C. State Conference of NAACP v. McCrory, 997 F. Supp. 2d 322, 336 (M.D.N.C. 2014), aff’d in part, rev’d in partsub nom. League of Women Voters of N.C. v. North Carolina, 769 F.3d 224 (4th Cir. 2014), staying order, 135 S. Ct. 6 (2014); see id. at 335–38 (discussing the legislative process in depth).
39. Texas’s House of Representatives was under Democratic control until 2000; North Carolina had a Democratic governor until 2013; a Republican governor took office concurrently with a assembly majority in Wisconsin only from 2011 onwards. For a discussion on state-legislature control, see NAT’L CONF. OF ST.LEGISLATURES,STATE PARTISAN COMPOSITION (Feb. 4, 2015), http://www.ncsl.org/research/about-state-legislatures/partisan-composition.aspx. For gubernatorial election results in the relevant date range (except Texas), see NAT’L GOVERNORS ASS’N, Gubernatorial Election Results (Jan. 8, 2015), http://www.nga.org/cms/elections; see also TEX.ST.LIBR.&ARCHIVES COMM’N,Governors of Texas, 1846-Present, https://www.tsl.texas.gov/ref/abouttx/governors.html (last visited Mar. 10, 2015) (listing all past Texas governors; noting that Anne Richards, the last Democrat to hold the office, was succeeded by George W. Bush, a Republican, in 1995; and observing that the office has been held by Republicans ever since).
40. The Voting Rights Act Amendments of 1982 expressly overturned the Supreme Court’s decision in Mobile v. Bolden, 446 U.S. 55 (1980), that a plaintiff must show that the state actors being sued evinced a racially discriminatory purpose to win a Section 2 claim; instead, the VRA was clarified to require merely a showing of discriminatory effect. Voting Rights Act Amendments of 1982 § 2, Pub. L. No. 97-205 (1982), 52 U.S.C. § 10301(b) (2014). Courts have relied on the Senate report accompanying the amendments, S.REP.NO. 97-417, at 28–29 (1982), which listed various factors that might be considered in determining disparate impact. See generally SAMUEL ISSACHAROFF, PAMELA KARLAN & RICHARD PILDES, THE LAW OF DEMOCRACY: LEGAL STRUCTURE OF THE POLITICAL PROCESS 623–51 (4th ed. 2012) [hereinafter THE LAW OF DEMOCRACY] (describing the Senate Report and its factors in considerable detail). The factors from this Report have been a critically important part of litigation under the amended VRA since the Supreme Court’s reliance on them in Thornburg v. Gingles, 478 U.S. 30 (1986).
Table 3. Racial and Ethnic Factors
Texas N. Carolina Wisconsin Black population in 201342
12.4% 22% 6.5% Hispanic population in 201343
38.4% 8.9% 6.3% Percentage of minority legislators in 2008 of
entire state legislature (black/Hispanic)44
29% (9%/20%)
20% (19%/1%)
1% (0%/1%) Racial polarization: Blacks voting for Obama in
200845
98% 95% 91%
Racial polarization: Whites voting for McCain
in 200846 73% 64% 45%
Section 5 Preclearance DOJ Objections, 2000– 201347 (and total since 1965)
16 (207) 6 (67) N/A
Voting-Rights Violations, 2000–201448
30 4 1
Date voter-restrictive law was enacted49
May 27, 2011 Aug. 12, 2013 May 25, 2011 Date Republicans achieved a “trifecta” after
200050
2001 2013 2011
42. U.S.CENSUS BUREAU, State and County Quick Facts: Texas, http://quickfacts.census .gov/qfd/states/48000.html (last visited Mar. 10, 2015); U.S.CENSUS BUREAU,State and County Quick Facts: North Carolina, http://quickfacts.census.gov/qfd/states/37000.html (last visited Mar. 10, 2015); U.S. CENSUS BUREAU, State and County Quick Facts: Wisconsin, http://quick facts.census.gov/qfd/states/55000.html (last visited Mar. 10, 2015).
43. See sources cited supra note 42.
44. NAT’L CONF. OF ST. LEGISLATURES, AFRICAN-AMERICAN LEGISLATORS 2009, http://www.ncsl.org/research/about-state-legislatures/african-american-legislators-in-2009.aspx (last visited Mar. 10, 2015); NAT’L CONF. OF ST.LEGISLATURES, LATINO LEGISLATORS 2009, http://www.ncsl.org/research/about-state-legislatures/latino-legislators-overview.aspx (last visited Mar. 10, 2015). The 2008 dataset is the latest available.
45. Vexingly, the National Exit Poll Consortium, which conducts what is considered the most reliable exit poll, chose for cost-cutting reasons to skip nineteen states, including Texas, in the 2012 presidential election. Jon Cohen & Scott Clement, Networks, AP Cancel Exit Polls in 19 States, WASH.POST (Oct. 4, 2012), http://www.washingtonpost.com/blogs/the-fix/wp/2012/ 10/04/networks-ap-cancel-exit-polls-in-19-states. Thus, I have used the 2008 exit-poll data.
Election Center 2008: Exit Polls, CNN.COM (Nov. 2008), http://www.cnn.com/ELECTION/ 2008/results/polls.
46. Election Center 2008: Exit Polls, supra note 45.
47. Voting Determination Letters for Texas, CIVIL RIGHTS DIV.,U.S.DEP’T OF JUSTICE, http://www.justice.gov/crt/records/vot/obj_letters/state_letters.php?state=tx (last visited Mar. 10, 2015) (listing all objection letters interposed against Texas since the inception of Section 5);
Voting Determination Letters for North Carolina, CIVIL RIGHTS DIV.,U.S.DEP’T OF JUSTICE, http://www.justice.gov/crt/records/vot/obj_letters/state_letters.php?state=nc (last visited Mar. 10, 2015) (same, for North Carolina).
48. THE PERSISTENT CHALLENGE OF VOTING DISCRIMINATION:ASTUDY OF RECENT VOTING RIGHTS VIOLATIONS BY STATE, LEADERSHIP CONFERENCE ON CIVIL &HUMAN RIGHTS 18, 22–26, 27 (2014), available at http://www.civilrights.org/press/2014/Racial-Discrimination-in-Voting-Whitepaper.pdf (listing violations).
49. 2013 N.C. Sess. Laws 1507 (Session Law 2013-381); 2011 Tex. Gen. Laws 619–25; 2011 Wis. Sess. Laws 103–27 (Act 23).
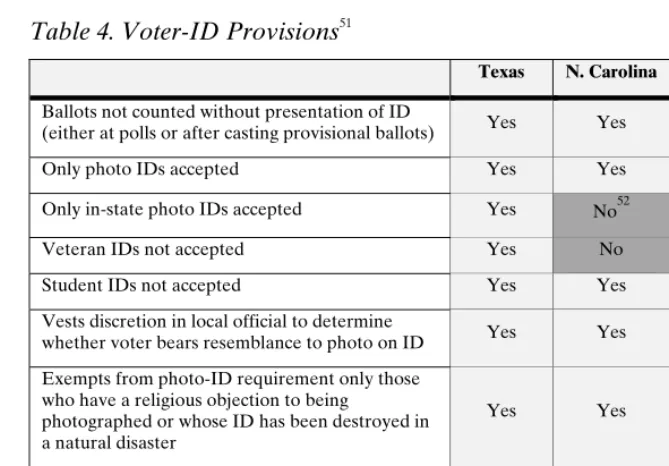
Table 3 shows the differences in state voter composition across three states that are the subject of intensive current litigation. Despite these marked dissimilarities, each state’s response was basically similar. A specific focus on the new voter-ID laws shows the overlap in both the adoption of each state’s voter-ID law and the laws’ ultimate content:
Table 4. Voter-ID Provisions51
Texas N. Carolina Wisconsin
Ballots not counted without presentation of ID
(either at polls or after casting provisional ballots) Yes Yes Yes
Only photo IDs accepted Yes Yes Yes
Only in-state photo IDs accepted Yes No52 Yes
Veteran IDs not accepted Yes No Yes
Student IDs not accepted Yes Yes No
Vests discretion in local official to determine
whether voter bears resemblance to photo on ID Yes Yes Yes
Exempts from photo-ID requirement only those who have a religious objection to being
photographed or whose ID has been destroyed in a natural disaster
Yes Yes No
Supplemental free election photo IDs accepted53 Yes No No
Exempts absentee voting from photo-ID
requirements Yes Yes No
Roundup, BRENNAN CTR. FOR JUSTICE, http://www.brennancenter.org/analysis/election-2012-voting-laws-roundup (listing all proposed and enacted changes to voting laws since 2010). A “trifecta” refers to a time at which a Republican governor held office concurrently with a Republican majority in both houses of the state legislature. See sources cited supra note 39. 51. See generally 2013 N.C. Sess. Laws 1507 (Session Law 2013-381); 2011 Tex. Gen. Laws 619–25; 2011 Wis. Sess. Laws 103–27 (Act 23).
52. Specifically, the act permits the use of “[a] drivers license or nonoperators identification card issued by another state, the District of Columbia, or a territory or commonwealth of the United States, but only if the voter’s voter registration was within 90 days of the election.” 2013N.C. Sess. Laws1507 (Session Law 2013-381 § 2.1(e)(8)) (codified at N.C. GEN.STAT. § 163-166.13(e)(8)).
II. FRAUD,VOTE SUPPRESSION, AND THE POWER OF FAITH
It is remarkable that the question of election fraud has surfaced as a hot-button political issue, with a focus on in-person vote fraud, no less. Very few elections turn so close to the margin as to be susceptible to fraudulent manipulation by individual voters pretending to be eligible to vote more than once. There are certainly examples in U.S. history of vote fraud, running from the habits of Tammany Hall operatives of throwing ballot boxes into the East River,54
to the curious propensity of dead persons in some south-Texas counties to all vote for Lyndon Johnson, and to arrive at the polls to do so in alphabetical order.55
Whether tossing out ballots or stuffing the ballot box, all of these mechanisms operate at the wholesale level. Trying to tip an election by retail-voter impersonation is much like trying to change the salinity of the sea by adding a box of salt. Not surprisingly, the bipartisan presidential commission, which was appointed in the wake of the 2012 election to examine proposals for election reform,56
dismissed the claims of in-person vote fraud as insignificant, stating: “Fraud is rare, but when it does occur, absentee ballots are often the method of choice.”57
54. Local lore has it that the massive lever-voting machines long in use in New York City were first selected because they were too heavy to toss into the river. See ANDREW GUMBEL, STEAL THIS VOTE 7 (2005) (“Ballots have been bought and sold on the open market, stolen, forged, spoiled, and tossed into lakes, rivers, and oceans.”); Jennifer 8. Lee, A Love Affair with Lever Voting Machines, N.Y. TIMES (Mar. 10, 2009, 7:15 AM), http://cityroom.blogs .nytimes.com/2009/03/10/a-love-affair-with-lever-voting-machines (“[Lever machines] became widely adopted across the entire city by 1926 because they were seen as more resistant to tampering—a tremendous problem during 19th-century elections.”). My colleague, Michael Waldman, believes that this story stems from the time Henry George ran for mayor of New York against Abram Hewitt. See GEORGE SELDES, WITNESS TO A CENTURY 192 (2011) (“[I]t was later revealed that Tammany Hall not only stuffed the ballot boxes for Hewitt but threw many Henry George ballots and boxes into one of the rivers. Henry George was counted out. He died three or four years later.”).
55. “Box 13” in Jim Wells County contained over two hundred such votes, just enough to put Lyndon B. Johnson over his opponent, Coke Stevenson, in the 1948 Democratic Primary.
See ROBERT A.CARO,THE YEARS OF LYNDON JOHNSON:MEANS OF ASCENT 324–30 (1991). To be fair to Johnson, he fervently believed, with some justification, that Stevenson had done the same to him four years earlier. Id.
56. See Exec. Order No. 13,639, 78 Fed. Reg. 19,979 (Mar. 28, 2013) (establishing the Presidential Commission on Election Administration).
57. PRESIDENTIAL COMM’N ON ELECTION ADMIN., THE AMERICAN VOTING EXPERIENCE: REPORT AND RECOMMENDATIONS OF THE PRESIDENTIAL COMMISSION ON ELECTION ADMINISTRATION 56 (2014) (citing Paul Gronke, Professor of Political Science, Reed College, PCEA Hearing Testimony, Denver, CO, at 48 (Aug. 8, 2013)), available at
Yet once inserted into the partisan blend, vote fraud takes on a life of its own. It is difficult to disprove nonspecific allegations of fraud as illegal conduct subject to conspiracy prosecution, and thus unlikely to be broadcast. This gives some ballast to the argument that because vote fraud is undetected, it is likely occurring—a classically nonfalsifiable proposition that cannot move the terms of debate beyond matters of prior belief. The most comprehensive studies indicate both that there are virtually no established cases of in-person vote fraud, and that some people nonetheless hold strong beliefs that others have either seen or heard of actual cases.58 Paradoxically, the level at which a voter-ID law is exacting in any particular jurisdiction does not appear to reduce the public perception of fraud, and the level of exaction may even be correlated with an increased concern over fraud59—perhaps the public-policy equivalent of being told not to think about hippos in tutus chasing swirling broomsticks.60
The best predictor of individual beliefs regarding vote fraud may well be each individual’s partisan affiliation. Unfortunately, one’s partisan
58. See Robert Pastor, Robert Santos, Alison Prevost, & Vassia Stoilov, Voting and ID Requirements: A Survey of Registered Voters in Three States, 40 AM.REV.PUB.ADMIN. 461, 475 (2010). Pastor et al. note that 53.2 percent of registered voters surveyed in Indiana, a state with strict voter-ID laws, report hearing about fraud at another polling place, while 73.1 percent of those surveyed in Maryland, a state without strict voter-ID laws, report hearing about fraud at another polling place. Id. at 464, 475. Compare Justin Levitt, A Comprehensive Investigation of Voter Impersonation Finds 31 Credible Incidents Out of One Billion Ballots Cast, WASH.POST (Aug. 6, 2014), http://www.washingtonpost.com/blogs/wonkblog/wp/2014/08/06/a-comprehen sive-investigation-of-voter-impersonation-finds-31-credible-incidents-out-of-one-billion-ballots-cast (listing discrete incidents), and LORRAINE MINNITE,THE MYTH OF VOTER FRAUD (2010) (same), with Pastor et al., supra, at 477 (noting that one-fifth of registered voters surveyed saw or heard of fraud at their own polling place).
59. See Stephen Ansolabehere & Nathaniel Persily, Vote Fraud in the Eye of the Beholder: The Role of Public Opinion in the Challenge to Voter Identification Requirements, 121HARV.L. REV.1737, 1756 (2008) (finding, through the use of a comprehensive survey instrument (and controlling for usual confounders), that fears of fraud remain flat when voter-ID laws are implemented—indeed, “those subjected to photo ID requirements believe, if anything, that fraud is more prevalent”). But see Pastor et al., supra note 58, at 464, 475 (finding a higher expectation of fraud at other polling stations in a state with less strict voter-ID laws).
affiliation has a powerful relationship to whether one believes in vote fraud and many other areas of policy.61
Faith does operate on both sides of the partisan divide. Possibly, however, there is a greater factual basis for opponents of ratcheted-up voting rules to fear that something more may be going on. For much of American history, the issue of fraud has been associated with efforts to suppress the franchise of minorities and other “out” groups.62
The particular forms of contemporary franchise restrictions, especially the more exacting ID requirements, are susceptible to a racially disparate impact. Efforts to discern the at-risk population show that minorities are more likely to lack either a driver’s license63
61. In particular, partisanship is the critical lens through which the public weighs the usefulness of strict voter-ID laws. See Ansolabehere & Persily, supra note 59, at 1747 (“Party remains a significant predictor of beliefs about both Fraud and Impersonation in a multivariate analysis that controls for ideology, education, age, race, income, and region.”). Party, too, is a powerful explanatory variable for belief in a variety of theories, including, but not limited to, the belief that “shape-shifting reptilian people control our world by taking on human form and gaining political power to manipulate our societies”—a belief held by nearly twice as many people who voted in 2012 for the Republican presidential candidate than for the Democratic presidential candidate. Press Release, Public Policy Polling, Democrats and Republicans Differ on Conspiracy Theory Beliefs (Apr. 2, 2013), available at http://www.publicpolicy polling.com/pdf/2011/PPP_Release_National_ConspiracyTheories_040213.pdf; see also Dan M. Kahan, Foreword: Neutral Principles, Motivated Cognition, and Some Problems for Constitutional Law, 125HARV.L. REV.1, 19 (2011) (surveying psychological research that found that unsubstantiated factual claims indicate motivated cognition, the phenomenon in which identity is expressed through particular factual claims); Spencer Overton, Voter Identification, 105MICH.L.REV.631, 663 (2007) (stressing that most arguments concerning voter identification have been premised on unsubstantiated factual assumptions).
62. Seegenerally LORRAINE C.MINNITE,THE POLITICS OF VOTER FRAUD14–21 (2007),
available at http://poli375engage.pbworks.com/f/Politics_of_Voter_Fraud_Final.pdf (outlining the history of voter restrictions employed against minority groups justified as preventing fraud);
see also ROGERS M.SMITH,CIVIC IDEALS:CONFLICTING VISIONS OF CITIZENSHIP IN U.S. HISTORY (1997) (tying franchise eligibility to efforts to diminish the political influence of new immigrants).
or another form of accepted photo identification.64
Most studies show that this racially disparate pattern persists even when controlling for other factors such as education or income.65
Put together, these historical and present social-science studies indicate that minority voters are more at risk of being excluded by increased voter-ID laws, and that there is reason for concern when fraud claims overlap with disfavored minority voters’ claims of exclusion.
Predilection does not constitute proof, however. The fact that restrictions on the franchise in general—and voter-ID laws in particular—play to the vulnerabilities of discrete communities does not establish that there is any discernible impact, either on overall turnout or on differential turnout among various groups. Recall that somewhere between 40 and 60 percent of eligible voters do not
employers verify the citizenship of each person they employ by use of at least one piece of secondary identification).
64. BRENNAN CTR. FOR JUSTICE, CITIZENS WITHOUT PROOF:ASURVEY OF AMERICANS’ POSSESSION OF DOCUMENTARY PROOF OF CITIZENSHIP AND PHOTO IDENTIFICATION 1–3 (Nov. 2006), available at http://www.brennancenter.org/sites/default/files/legacy/d/download_ file_39242.pdf (conducting a random poll of 987 adults adjusted for demographic factors, and finding that at least 11 percent of U.S. citizens lacked an unexpired government-issued photo ID, and that 18 percent of the elderly and 25 percent of African Americans likewise lacked such an ID, as compared to 8 percent of whites). But see Pastor et al., supra note 58, at 469 (surveying registered voters in Maryland, Mississippi, and Indiana, and finding that only 1.2 percent of total responders lacked any form of government-issued photo ID).
65. See Matt A. Barreto, Stephen A. Nuño & Gabriel R. Sanchez, The Disproportionate Impact of Voter-ID Requirements on the Electorate: New Evidence from Indiana, 42 PS:POL.SCI &POL. 111, 113 (2009) (“Even among likely voters [in Indiana], differences persist with respect to race. Among all registered voters, 84.2% of whites have the correct ID credential in Indiana compared to 78.0% of blacks . . . . When we only focus on likely voters, those who consistently voted in 2002, 2004, and 2006, a 6-point gap between blacks and whites is still evident.”); Matt A. Barreto, Stephen A. Nuño & Gabriel R. Sanchez, The Disproportionate Impact of Indiana Voter ID Requirements on the Electorate 13 (Wash. Inst. for the Study of Ethnicity & Race, Working Paper, Nov. 8, 2007), available at http://depts.washington.edu/uwiser/documents/ Indiana_voter.pdf (finding a gap of 11.5 percent between black and white possession of voter IDs on the basis of a survey of Indiana residents); Matt A. Barreto, Stephen A. Nuño & Gabriel R. Sanchez, Voter ID Requirements and the Disenfranchisements of Latino, Black and Asian Voters 14–17 (Am. Pol. Sci. Ass’n, Annual Meeting Paper, Sept. 1, 2007), available at
http://faculty.washington.edu/mbarreto/research/Voter_ID_APSA.pdf (conducting exit polls of voters in California, New Mexico, and Washington state to find that among voters, Latinos and blacks were not less likely to possess driver’s licenses than white voters, but that racial minorities were potentially more than 20 percent less likely to possess two forms of identification as compared to white voters). But see M.V. Hood III & Charles S. Bullock III,
participate in federal elections.66
The question therefore is whether the new voter restrictions affect individuals who would have voted absent such restrictions. The alternative, and perhaps more likely, hypothesis is that the same individuals who are likely to fall under an enhanced voter-ID requirement are also unlikely to vote at all, regardless of the mechanics of the voting restriction. This is a hard empirical question given that, at least for some portion of the nonvoting population, the decision whether or not to participate on election day is likely made at the margins and turns on the ease of voting, peer pressure, engagement by a candidate, competing personal obligations, and a host of such idiosyncratic factors. Undoubtedly across the mass of the American population, any encumbrances to the ability to vote will have some effect. But the issue is whether the impact of these impediments falls primarily on voters who are already marginalized from electoral engagement and who would not have voted regardless of these burdens.
To date, empirical studies have focused on the effect of voter-ID laws, but have been unable to find any substantial decline either in overall turnout or in the turnout of racial minorities as a result of these laws.67
Most studies testing a causal relationship between
66. Seesupra Table 1.
67. See, e.g.,Shelley de Alth, ID at the Polls: Assessing the Impact of Recent State Voter ID Laws on Voter Turnout,3 HARV.L.&POL’Y REV.185, 201 (2009) (finding that strengthened voter-ID laws were, at most, associated with a 1.1 percent decline in voter turnout); Stephen Ansolabehere, Access Versus Integrity in Voter Identification Requirements, 63 N.Y.U.ANN. SURV. AM. L. 613, 625–26 (2008) (examining several large survey sets to find that as an empirical matter, few if any voters reported being unable to vote or forced to cast a provisional ballot because of voter-ID laws); M.V. Hood III & Charles S. Bullock III, Much Ado About Nothing? An Empirical Assessment of the Georgia Voter ID Statute, 12ST.POL.&POL’Y Q.394, 394 (2012) (finding that the Georgia voter-ID law decreased overall turnout by 0.4 percent in 2008, but that no empirical evidence suggests that this effect was due to racial or ethnic discrimination); Jason D. Mycoff, Michael W. Wagner & David C. Wilson, The Empirical Effects of Voter-ID Laws: Present or Absent?, 42 PS: POL. SCI. & POL. 121, 125 (2009) [hereinafter Mycoff et al., Empirical] (“Thus, we fail to reject the null hypothesis that voter-ID laws do not significantly affect turnout.”); R. Michael Alvarez, Delia Bailey & Jonathan N. Katz, The Effect of Voter Identification Laws on Turnout 18 (Cal Inst. of Tech., Div. of the Humanities & Social Sci., Working Paper No. 1267R, 2008), available at
http://papers.ssrn.com/sol3/papers.cfm?abstract_id=1084598 (analyzing data from 2000–06 and, after controlling for education and income, finding no disparate racial impact); John R. Lott, Jr., Evidence of Voter Fraud and the Impact that Regulations To Reduce Fraud Have on Voter Participation Rates 8–9 (Crime Prevention Research Ctr., Working Paper, 2006), available at
ID laws and turnout have determined the impact of voter-ID laws on overall and minority turnout to be minor at best.68 It is easy to imagine that persons sufficiently distant from institutional arrangements providing or independently requiring a photo ID would also be more likely not to vote.69
This is a matter of conjecture, but it is striking that relatively few persons have actually been identified as impeded by voter-ID requirements in litigation thus far,70
a fact that
(Am. Pol. Sci. Ass’n, Annual Meeting Paper, Aug. 2007), available at http://www.brennan center.org/sites/default/files/legacy/d/download_file_50900.pdf [hereinafter Mycoff et al., Effect of Voter Identification] (using database matching over multiple states from the 2000–06 elections to conclude that “basic socio-demographics and other individual level characteristics such as political interest have a much larger effect on voting behavior than political context variables such as the type and degree of identification required for voting”); Timothy Vercellotti & David Anderson, Protecting the Franchise or Restricting it? The Effects of Voter Identification Requirements on Turnout13–14 (Am. Pol. Sci. Ass’n, Working Paper, Aug. 31 2006), available at http://moritzlaw.osu.edu/blogs/tokaji/voter%20id%20and%20turnout%20study.pdf (looking at the 2004 election only, and finding that imposing voter-ID requirements “reduced probabilities of voting of about 3 to 4 percent for the entire sample, with larger differences for specific subgroups,” in particular, poor communities of color).
68. See, e.g.,Alth, supra note 67, at 201 (finding a decline in turnout from strict voter-ID laws); Ansolabehere, supra note 67, at 625–26 (examining several large survey sets to find that as an empirical matter, few if any voters reported being unable to vote, or forced to cast a provisional ballot, because of voter-ID laws); Kyle Dropp, Voter Identification Law and Voter Turnout 27–30 (May 28, 2013) (unpublished manuscript), available at http://kyledropp.weebly .com/uploads/1/2/0/9/12094568/dropp_voter_id.pdf (finding a 2.3 percent relative decline in Democratic turnout but negligible racial impact of voter-ID laws); Hood & Bullock, supra note 67, at 394 (finding that the Georgia voter-ID law decreased overall turnout by 0.4 percent in 2008, but finding no empirical evidence to suggest that this effect was racial or ethnic); Mycoff et al., Empirical, supra note 67, at 125; Michael Pitts & Matthew Neumann, Documenting Disenfranchisement: Voter Identification During Indiana’s 2008 General Election, 15 J.L.&POL. 329, 354 (2009)(finding that since the Indiana primary, ID-related provisional ballots cast in Indiana increased in concert with provisional ballots of all kinds, suggesting that the trend in provisional balloting had little if anything to do with the voter-ID law);Mycoff et al., Effect of Voter Identification, supra note 67, at 17.
69. See Hood & Bullock, supra note 65, at 573 (finding that even without strict voter-ID laws, “those [registered voters] who lack driver’s licenses are generally less engaged politically” and thus less likely to vote even before a strict voter-ID law is applied). Seegenerally JAN E. LEIGHLEY &JONATHAN NAGLER,WHO VOTES NOW?DEMOGRAPHICS,ISSUES,INEQUALITY, AND TURNOUT IN THE UNITED STATES 27–51 (2014) (describing in detail why poorer, urban, and black voters—precisely those constituencies that organizations like the Brennan Center have concluded lack photo IDs—might be independently dissuaded from voting).
seemed to sway Justice Stevens in upholding the Indiana voter-ID law in Crawford v. Marion County Election Board.71
It is perhaps too soon to be entirely sanguine about no harm, no foul. First, the empirical studies on the impact of restrictive ID practices are problematic, both because the new round of voting restrictions is so recent,72
and also because the forms of voter-ID laws vary across jurisdictions73 and have gotten more onerous over time.74 There has not been enough time to test the observations against normal fluctuations in turnout (such as those associated with off-year elections) and other confounding political factors.75
At its most
71. Crawford v. Marion Cnty. Election Bd., 553 U.S. 181, 201 (2008) (noting the small number of individuals who demonstrated a burden at the trial level).
72. Daniel R. Biggers & Michael J. Hanmer, Why Voting Gets Harder: Understanding the Adoption of Voter ID Laws in the American States 2–3 (Am. Pol. Sci. Ass’n, Working Paper, 2011), available at http://www.gvpt.umd.edu/apworkshop/papers_fall12/B%20and%20H% 20APW%209-21-12.pdf (tracing the turn from voting facilitation to voter suppression in the states in the early twenty-first century); Vercellotti & Anderson, supra note 67, at 4–5 (finding that no jurisdiction included in the study implemented a strict voter-ID law in which a voter was prevented from voting unless he showed a state-issued photo ID).
73. Weiser & Opsal, supra note 29 (surveying the variety of voter-ID laws as of the 2014 general elections).
74. See, e.g.,IND.CODE ANN. § 3-11-8-25.1 (West 2014) (listing acceptable IDs); id. § 3-11.7-5-2.5(b) (stating that a provisional ballot cast by a voter without an ID will generally not be counted unless the voter presents an ID shortly afterwards). See generally INDIANA SECRETARY OF ST. ELECTION DIVISION, Photo ID Law, http://www.in.gov/sos/elections/2401.htm (last visited Mar. 10, 2015) (describing the implementation of Indiana’s voter-ID requirement). Although a voter may swear in an affidavit that he is too “indigent” to afford a photo ID, this option can be exercised only very shortly following the election rather than at the polls; the voter must make a separate trip to the county clerk’s office to complete the affidavit. See GA. CODE ANN. § 21-2-417(a) (West 2014) (effective Jan. 26, 2006) (listing Georgia’s photo-ID requirements); id. § 21-2-417(b) (requiring the voter to provide identification after Election Day for his provisional ballot to be counted); id. § 21-2-419(c) (setting a three-day time limit for the person casting a provisional ballot to demonstrate his eligibility); KAN.STAT.ANN. § 25-2908(h) (West 2014) (effective July 1, 2012) (listing acceptable forms of photo ID); id. § 25-3002(b)(8) (“No ballot cast shall be counted if the voter fails to provide valid identification as defined by K.S.A. 25-2908, and amendments thereto.”); TEX.ELEC.CODE ANN.§ 63.0101 (West 2013) (effective Jan. 1, 2012) (listing acceptable forms of photo ID);2011 Wis. Sess. Laws 103–27 (Act 23), enjoined by Frank v. Walker, 17 F. Supp. 3d 837, 862–63 (E.D. Wis. 2014).
simple, it would be hard to analyze black turnout in 2008 or 2012 without some account of the role of the Obama candidacy in galvanizing black turnout, regardless of the encumbrances on the franchise that may have been put in place.76
Even across partisan dimensions, it is hard to figure out the exact impact of the new voting restrictions. Again, among the new voting restrictions, voter ID is the most studied and most litigated topic,77 but
political knowledge. Kaat Smets & Carolien van Ham, The Embarrassment of Riches? A Meta-Analysis of Individual-Level Research on Voter Turnout,32 ELECTORAL STUD. 344, 348–56 (2013). One important element of political salience in the American context that can act as a severe, but less detectable, local confounder is a ballot initiative. See John G. Matsusaka,
Election Closeness and Voter Turnout: Evidence from California Ballot Propositions, 76 PUB. CHOICE 313, 332 (1993).
76. See generally Robert S. Erikson & Lorraine C. Minnite, Modeling Problems in the Voter Identification–Voter Turnout Debate, 8 ELECTION L.J. 85, 87 (2009) (discussing difficulties in designing studies to measure the effect of voter-ID laws on turnout). For example, any examination of the impact of vote restrictions on black turnout in 2008 and 2012 would need to confront the candidacy of Barack Obama at the head of the ballot, who both overwhelmingly captured the black vote and drove up black turnout. See Tasha S. Philpot, Daron R. Shaw & Ernest B. McGowen, Winning the Race: Black Voter Turnout in the 2008 Presidential Election, 73 PUB.OPINION Q. 995, 996–97 (2009). Further, any analysis that uses total voter turnout as a variable must disentangle other partisan variables. See, e.g., Michael J. Pitts, Photo ID, Provisional Balloting, and Indiana’s 2012 Primary Election, 47 U.RICH.L.REV. 939, 952–54 (2013) (concluding that the decrease in provisional-ballot use, far from indicating that voter ID is less of a problem than advertised in Indiana, most likely reflects high turnout from Republicans and groups more likely to possess voter IDs). There are also variations in voting reforms that make comparison between states difficult. See Keele & Minozzi, supra note 75, at 193–94 (stating that “the quality of any assumption is hard to assess outside the context of a specific empirical application”). Finally, most voting legislation is still new, having been approved only between 2012 and 2014, and some of these laws are only partially enforced because of litigation. See, e.g.,Veasey v. Perry, No. 13-CV-00193, 2014 WL 5090258, at *28 (S.D. Tex. Oct. 9, 2014).
here too the evidence is weak as to any partisan effect. Part of the effect, oddly, seems to be a paradoxical increase in the determination of communities—particularly minority communities—to vote in the face of perceived efforts at disenfranchisement, a countermobilization that might increaseDemocratic-leaning turnout.78
Some of the lack of effect might be a problem of the means of voter restrictions not matching the intended targets. For example, putting the backlash against restrictive voting laws aside, strict voter-ID laws requiring documentary proof of citizenship upon registration disproportionately exclude women who have changed their surnames
rev’d, 768 F.3d 744, 745 (7th Cir. 2014) (finding that subsequent action by the Wisconsin Supreme Court sufficiently altered the balance of equities to merit a stay of an injunction); Texas v. Holder, 888 F. Supp. 2d 113, 115 (D.D.C. 2012) (holding that the state failed to show that its voter-ID law would not lead to retrogression in the position of racial minorities with respect to their effective exercise of electoral franchise), vacated and remanded, 133 S. Ct. 2886 (2013); Stewart v. Marion Cnty., No. 1:08-CV-586-LJM-TAB, 2010 WL 1579672, at *1 (S.D. Ind. Apr. 16, 2010) (rejecting a poll-tax attack on a voter-ID law); Democratic Party of Ga., Inc. v. Perdue, 707 S.E.2d 67, 72 (Ga. 2011) (finding that “the [challenged statute was not] an impermissible qualification on voting . . . [because it did] not deprive any Georgia voter from casting a ballot in any election”); League of Women Voters of Ind., Inc. v. Rokita, 929 N.E.2d 758, 760–61 (Ind. 2010) (finding that the state’s requirement that in-person voters display a government-issued photo ID did not impose an additional qualification in violation of the state constitution); Applewhite v. Commonwealth, No. 330 M.D. 2012, 2014 WL 184988, at *26 (Pa. Commw. Ct. Jan. 17, 2014) (holding that the state’s voter-ID law violated the state constitution’s fundamental right to vote, but did not violate the federal or state equal-protection clauses, despite a claim that the state statute had disproportionately adverse effects on certain minority groups); City of Memphis v. Hargett, 414 S.W.3d 88, 104–06 (Tenn. 2013) (holding that the Tennessee Voter Identification Act’s photo-ID requirement was narrowly tailored to achieve the state’s compelling interest in the integrity of the election process, and that the burden of travel time was not, without more, sufficient to render the requirement unconstitutional); Milwaukee Branch of NAACP v. Walker, 851 N.W.2d 262, 265–66 (Wis. 2014) (approving voter-ID requirements under a “saving construction”—that the Division of Motor Vehicles must not require documents for which a voter must pay a fee to a government agency); League of Women Voters of Wis. Educ. Network, Inc. v. Walker, 851 N.W.2d 302, 305–06 (Wis. 2014) (finding that the challenged statute did not impose an unconstitutionally unreasonable restriction on the right to vote); cf. Serv. Emp. Int’l Union, Local 1 v. Husted, No. 2:12-CV-562, 2012 WL 5497757, at *1–3 (S.D. Ohio Nov. 13, 2012) (summarizing the complex history of the consent decree in Ohio, which ensures that voters without a photo ID can still cast counted ballots).
78. See Barry C. Burden, David T. Canon, Kenneth R. Mayer & Donald P. Moynihan,
since birth,79
and laws looking for currently valid driver’s licenses disproportionately disadvantage the elderly80—both of whom lean Republican.81
***
Although the empirical picture of ballot access is complicated, its prominence as a legal and political issue is clear. For the first time since the Civil Rights Era, courts are confronting voting-rights claims that turn not on the allocation of electoral opportunity across different voting systems or on redistricting configurations, but on basic right-to-vote issues. The restrictions implemented to date may not be particularly effective, but they are currently the subject of intensive litigation in many states, most notably in North Carolina, Texas, and Wisconsin.82 The next question concerns the proper legal framework for considering the new voting-rights challenges— specifically, whether the tools used to deny the franchise when race was the predominant paradigm for doing so continue to do the work today.
79. See BRENNAN CTR. FOR JUSTICE, supra note 64 (reporting the results of a random poll of 967 adults (adjusted for demographic factors), which found that a full 34 percent of voting-age women did not have ready access to any proof of citizenship with their current legal name). 80. See id. (finding that 18 percent of the elderly lack a valid photo ID);PAWASARAT,
supra note 63, at 1, 11 (using database matching to find that 23 percent of persons age sixty-five and over, or 177,399 people, do not have a Wisconsin state ID or driver’s license, but that the overwhelming majority of those people are white).
81. Exit Polls 2012: How the Vote Has Shifted, WASH. POST (Nov. 6, 2012), http://www.washingtonpost.com/wp-srv/special/politics/2012-exit-polls/table.html (describing the alignments of various demographic groups with the political parties, and the change of these alignments over time); Dahlia Lithwick, Ladies’ Choice: Voter ID Laws Might Suppress the Votes of Women. Republican Women, SLATE (Oct. 24, 2013, 11:26 AM), http://www.slate.com/articles/double_x/doublex/2013/10/how_voter_id_laws_might_suppress_th e_votes_of_women_republican_women.html; see also Biggers & Hanmer, supra note 72, at 12 (“[The elderly’s] proclivity to vote, combined with weaker attachments to the Democratic Party, make[] them an attractive segment to preserve in the electorate and removes any potential partisan advantage in restricting their access to the polls.”).
III. RACE AND PARTISANSHIP IN VOTING-RIGHTS LAW
A. The Evolution of the Modern Right To Vote
Much of modern political-process law emerges from the historic exclusion of black voters. Even cases that marked the Supreme Court’s first insertion into the political thicket, notably Baker v. Carr,83 were racially charged because the rural communities seeking to retain representational hegemony were also in part warding off the development of a minority presence in the urban political machines.84 This is a common account, and even a glance at the table of contents of the Law of Democracy casebook that I coauthor reveals the tremendous weight of racial-justice cases in virtually all areas of law regulating politics, save perhaps campaign finance.85
Examined more closely, however, the cases differentiate themselves across three primary dimensions. In the first instance are challenges over basic access to the franchise beginning in the post– Civil War era and continuing through the early phase of the Civil Rights Movement. After the battle for women’s enfranchisement was resolved by the Nineteenth Amendment, black exclusion from voting through the legacy of Jim Crow became the dominant vehicle for the development of an affirmative right of political participation.86
This first generation of simple participation yielded the great efforts of the VRA to suspend the operation of literacy tests and the like, and impose the government filter of preclearance under Section 5 to
83. Baker v. Carr, 369 U.S. 186 (1962).
84. For a discussion of the role of the Memphis Democratic organization, including the early African-American local leaders, in bringing the Baker litigation to the Supreme Court and pushing the Kennedy administration to support their claim to equipopulational representation, see Stephen Ansolabehere & Samuel Issacharoff, The Story of Baker v. Carr, in
CONSTITUTIONAL LAW STORIES 271–94 (Michael C. Dorf ed., 2d ed. 2004). 85. See generally THE LAW OF DEMOCRACY,supra note 40.
prevent the reintroduction of any devices that might adversely affect (“retrogress”87) the ability of minorities to vote.
The early efforts to foster political integration began with a simple syllogism. Black voters were concentrated in the South; black voters could not vote because of registration requirements and other barriers, including outright intimidation and violence; so as a result, no black candidates could get elected to office in the face of determined white obstruction.88
Congress responded with federal registrars capable of opening up the voter-registration process, and with the removal of polling-place barriers though Section 5.89
Federal intervention proved spectacularly successful as black-voter participation rose dramatically.90
Today’s voting landscape is unrecognizable. Indeed, the registration and participation figures for black voters, for all practical purposes, are equivalent to those of white voters.91
With the restored enfranchisement of black voters, however, came a series of structural obstacles that prevented black voting from being translated into black officeholding. This second generation of voting claims asserted that certain voting practices, primarily multimember districts or at-large elections, magnified the voting power of cohesive white majorities under conditions of racially polarized voting. The Supreme Court began to recognize these vote-dilution claims in the 1970s,92
and Congress unleashed a strong statutory response to continued minority exclusion in the 1982
87. Beer v. United States, 425 U.S. 130, 141 (1976) (“In other words the purpose of § 5 has always been to insure that no voting-procedure changes would be made that would lead to a retrogression in the position of racial minorities with respect to their effective exercise of the electoral franchise.”).
88. See generally QUIET REVOLUTION IN THE SOUTH: THE IMPACT OF THE VOTING RIGHTS ACT, 1965-1990 (Chandler Davidson & Bernard Grofman eds., 1994) [hereinafter QUIET REVOLUTION IN THE SOUTH] (discussing the state of affairs in the South before and after the VRA).
89. Id.
90. See, e.g., Shelby Cnty. v. Holder, 133 S. Ct. 2612, 2626 (2013)(documenting the early successes of the VRA in general and Section 5 in particular).
91. THE DIVERSIFYING ELECTORATE—VOTING RATES BY RACE AND HISPANIC ORIGIN IN 2012(AND OTHER RECENT ELECTIONS)2–4, U.S.CENSUS BUREAU (2013), available at
http://www.census.gov/prod/2013pubs/p20-568.pdf; see also Hope Yen, A Census First: Black Voter Turnout Passes Whites, NBCNEWS.COM (May 8, 2013), http://usnews.nbcnews.com/ _news/2013/05/08/18131900-a-census-first-black-voter-turnout-passes-whites.
amendments to Section 2.93
Subsequently, in the Shaw v. Reno94
line of cases,95 the Supreme Court drew a constitutional line around the extent to which Congress, DOJ, or state redistricting bodies could use race-specific line drawing to enhance minority representation.
As with the first generation of voting-access cases, the results of the second generation of election-to-office cases are stunning in terms of obtaining minority representation. Getting minority candidates into office, what is termed “descriptive representation,” was the signature success of the second generation of voting-rights cases. To take the simplest example, before the VRA, the number of African Americans in Congress was always in the single digits; in the 112th Congress, there were forty-three black representatives, a fairly consistent number for the past ten years.96 With the exception of single-office positions (such as senator or governor), minority representation is well entrenched. Even in single-office positions, minorities have made significant inroads by being elected as mayors and even governors in nonminority majority cities and states,97 and, most obviously, by being elected as President of the United States.98
Finally, a third set of claims involved the ability to have an effective voice in governance. In a simpler form, these cases
93. Voting Rights Act Amendments of 1982, Pub. L. No. 97-205, § 2(a), 96 Stat. 131, 134 (codified as amended at 42 U.S.C. § 1973(a) (2012)); see Thornburg v. Gingles, 478 U.S. 30, 35 (1986) (noting that “Congress substantially revised § 2 to make clear that a violation could be proved by showing discriminatory effect alone”). For a discussion of the transformative effect of vote-dilution litigation, primarily under Section 2, see Chandler Davidson, The Recent Evolution of Voting Rights Law Affecting Racial and Language Minorities, in QUIET REVOLUTION IN THE SOUTH, supra note88,at21.
94. Shaw v. Reno, 509 U.S. 630 (1993).
95. See, e.g., Easley v. Cromartie, 532 U.S. 234, 258 (2001) (upholding the majority– minority congressional districts created in North Carolina post-Shaw); Bush v. Vera, 517 U.S. 952, 954 (1996) (plurality opinion) (applying strict scrutiny to strike down bizarrely shaped majority–minority Texas congressional districts); Miller v. Johnson, 515 U.S. 900, 912 (1995) (holding that bizarre shape was not a threshold requirement of a claim of racial gerrymandering under Shaw); Shaw, 509 U.S. at 642 (holding that plaintiffs’ allegation that North Carolina’s redistricting legislation was “so extremely irregular on its face that it could rationally be viewed only as an effort to segregate the races for purposes of voting, without regard to traditional districting principles and without sufficiently compelling justification” was sufficient to state a claim upon which relief could be granted under the federal Equal Protection Clause).