Vol. 07, Issue 04 (April. 2017), ||V1|| PP 53-62
Statistical analysis of the significance of variation in properties of
cotton stalk fibres extracted from different sections of the cotton
stalk
Nkosilathi Z Nkomo
1*, Londiwe C Nkiwane
21,2Department of Fibre and Polymer Materials Engineering, National University of Science and Technology,
P.O Box AC 939, Ascot, Bulawayo, Zimbabwe
Abstract: - Cotton is cultivated primarily for its boll fibre and little use is made of the cotton stalk. The cotton stalks are breeding ground for pests therefore the stalks are normally burnt in the field creating air pollution. Cotton stalks were collected from farms through random sampling and subjected to natural water retting and there after mechanical decortication and categorised according to their location relative to the stalk as top section, middle section and bottom section fibres. The physical properties of the cotton stalk fibres was characterised by tensile strength, moisture regain, linear density, diameter and fibre length tests. These results were analysed using one way multivariate analysis (MANOVA) in SPSS with three levels being one for each section of the stalks to test the statistical significance of the differences of the fibre properties from different sections of the cotton stalk. Pillais trace test showed that there was statistical significant difference between fibres from different locations when considered jointly on the variables tensile strength, elongation, fibre density, fibre diameter, fibre length, linear density and moisture regain. This test was followed up by Tuskey’s HSD post hoc test which showed which parameters varied between which sections of the stalk.
Keywords: - Composites, cotton stalk fibres, fibre properties, multivariate analysis, statistical variation
I. INTRODUCTION
Cotton popularly known as “White Gold” is grown for fibre and seed all over the world. Cotton stalks are a by-product of cotton farming with the cotton stalk treated as waste material and small portions of it used as fuel by the rural people and some as animal feed. The cultivation of cotton generates plant residues equivalent to three to five times the weight of fibre produced [1]. These cotton stalks are normally burnt in the field as the preferred disposal method as they tend to harbour several insects and pests which would be harmful to the future croup [2]. The cotton stalks are a potential breeding ground for pests such as pink bollworm and the highly invasive polyphagous cotton mealybug Phenacoccus solenopsis Tinsley (Hemiptera: Pseudococcidae) [3, 4]. These pests feed on the squares or bolls of cotton left over in the cotton stalks for approximately 3 weeks and then commonly enter a state known as diapause which allows it to survive throughout the off season in a dormant state [5].
Fig 1.0. Picture of highly destructive, polyphagous mealybug
Table 1.0. Showing emission of greenhouse gas per million tonnes of cotton stalks burned in the field [8]
Green House Gas Emission Factor (g.kg-1) Total Emission (Mn Total Emission (Mn Mt
MT) Co2e)
NOx 2.68 0.00265 0.7898
CH4 2.7 0.0027 0.0675
*NO –Nitrous oxide, *CH4 – Methane, *Mn Mt Co2e – Million Metric tonnes of carbon dioxide equivalent
Bast fibres are obtained from the stems of various dicotyledonous plants. Botanically the term bast fibre is synonymous with phloem, the food conducting tissue of vascular plants. In bast stems the useful fibres are present as bundles towards the outer area of the stem. For composite reinforcement, the aim is usually to obtain fibres which are 50-100 μm in diameter and can be 100-300mm long. These technical fibres are actually themselves bundles of approximately 40 elementary fibres (cells) which may be 10-20 μm and 20-50mm long. Bast fibres are found in the outer portion of the stem, with woody core material known as shive [9]. Fig 1.1 shows how a typical cross section of a bast fibre looks like.
Fig 1.1. Cross section of a bast stem [10]
Bast fibres are normally extracted by retting process and then carrying out mechanical decortication. Most of the natural fibres are relatively cheap to extract and prepare for use. Hence natural fibres have attracted the attention of scientists and engineers for applications in the consumer industry. Most available methods of retting rely on the biological activity of microorganism, bacteria and fungi from the environment to degrade the pectin polysaccharides from the non-tissue and, thereby, separate the fibre bundles. Microbial/enzymatic retting is one of the widely used techniques [11]. The quality of the fibres is largely determined by retting condition and duration. The quality of the water also affects the quality of the fibres. Apparently there is no single method that can give optimum results in terms of retting period, fibre strength, environmental pollution and cost. Table 1.2 shows some of the mechanical properties of common bast fibres.The increasing interest in introducing degradable, renewable, and inexpensive reinforcement materials which are environmentally friendly has stimulated research in the area of bast cellulose fibres. These fibres have the advantage of low cost, less weight and density makes the natural fibres an excellent alternative for synthetic fibres [12].
Table 1.2. Mechanical and physical properties of plant fibres [13]
Fibre Diameter Density Elongatio n
Lengt h
Tensile Moistur e
Specific Failure
Type Strength regain Tensile Strain Strength
um g/cm3 % Mm MPa % MPa %
Bambo o
10-40 - 2.7 575 - 383 -
Ramie 28.1-35.0 - 3.6-3.8 60-250 915 8.550 590 3.7
Cotton stalks contain about 33% fibrous bark layer [14]. The bast fibres extracted from cotton stalk have been shown to be a good reinforcement for polymer composites with mechanical performance similar to that of flax and hemp fibre in fibre reinforced composites [14].
II. MATERIALS AND METHODS
The cotton stalks were collected using random sampling technique from cotton farms around Zimbabwe. The collection of the cotton stalks was done immediately after June/July harvest period. Only cotton stalks between 1.0-1.2metres in length were used. The cotton stalks were water retted for a period of 3 weeks in plastic drums using tap water with initial pH value of 7.40 and conductivity of 204. The initial TDS value of the retting water was 102ppm. The cotton stalks were weighed down with concrete block to prevent them floating to the surface of the water.
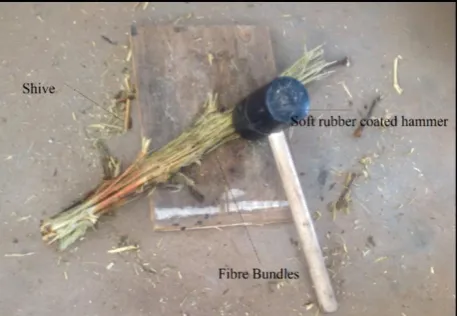
Fig 2.1. Showing natural water retting of cotton stalks at initial (a) and after three weeks (b) After the retting process the cotton stalks were subject to manual decortication using a rubber coated hammer to avoid damage to the cotton stalk fibres as shown in Fig 2.2. There after the cotton stalk fibres were cleaned and combed to remove any adhering dirt particles [15].
Fig 2.2. Mechanical decortication process in the extraction of cotton stalk fibres [15] 2.1 Characterization of the cotton stalk fibres
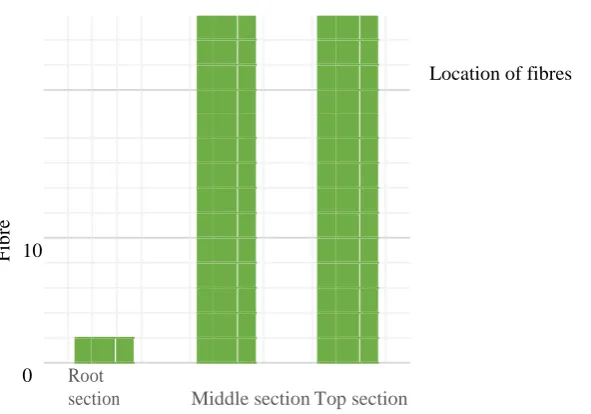
Fig 2.3. Showing the location of extracted fibres on the cotton stalk 2.2 Statistical Analysis
MANOVA statistical analysis was carried out using SPSS software to assess the statistical significance in the variation of the fibre mechanical properties from fibres in the different sections of the cotton stalk i.e top section, middle section and root section.
III. RESULTS AND DISCUSSION
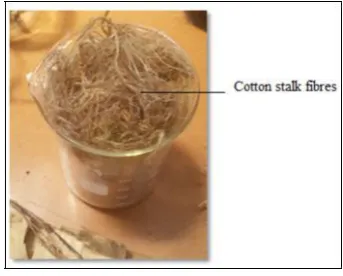
The cotton stalk fibres extracted were brownish in colour. Generally speaking, extending the water retting duration significantly increased the whiteness of the cotton stalk fibres. Water retting is able to improve the whiteness of fibres because coloured materials and contaminating substances, such as dust, dissolve and settle in the retting water [20]. The fibres from the top section of the stalk were dark brown in colour while the fibresfrom the root section were light brown in colour. Fig 3.1 shows some extracted cotton stalk fibres in a glass beaker.
Fig 3.1. Extracted cotton stalk fibres in a beaker
The mechanical properties of the cotton stalk fibre were characterised according to their location on the cotton stalks. The properties of fibres from the different sections were analysed using one way Multi-variance Analysis (MANOVA) on SPSS software to access the significance of the difference in properties between the fibres from different locations of the cotton stalk. The sample size was 40 fibres tested for each of the properties from 3 levels of the cotton stalk which were top section, middle section and root section. Table 3.1 shows descriptive statistics of the mechanical properties of the cotton stalk fibres from the different sections with the standard deviations and mean values.
Table 3.1. Descriptive statistics of the mechanical properties of the cotton stalk fibres
Parameters Location on stalk Mean Std.
Deviation
N
Tensile strength (MPa) Middle 56.3 0 40
Root 2.21 0 40
Top 39.79 0 40
Total 32.7667 22.72861 120
Elongation (%) Middle 0.4734 0 40
Top 0.4103 0 40
Total 0.3446 0.14056 120
Fibre Density (g/mm3) Middle 3.72 0 40
Root 1.45 0 40
Top 5.85 0 40
Total 3.6733 1.80413 120
Fibre Diameter (mm) Middle 0.1835 0.01369 40
Root 0.2275 0.03193 40
Top 0.1538 0.03094 40
Total 0.1882 0.04043 120
Moisture Regain (%) Middle 10.202 0.81965 40
Root 11.1405 0.75181 40
Top 10.6781 1.31388 40
Total 10.6735 1.05793 120
Fibre length (mm) Middle 7.9012 2.94373 40
Root 6.9162 2.01082 40
Top 9.0488 3.46947 40
Total 7.9554 2.97924 120
Linear density (tex) Middle 3.938 0 40
Root 2.364 0 40
Top 3.683 0 40
Total 3.3283 0.69268 120
The fibres from the root section of the cotton stalks had the lowest strength in comparison to fibre from the top and middle section of the cotton stalk. This could be attributed to the low fibre maturity of the fibres. The fibres from the root section of the cotton stalks had the lowest strength in comparison to fibre from the top and middle section of the cotton stalk. This could be attributed to the low fibre maturity of the fibres. The mean fibre tenacity for fibres from the root section was 0.00533kgf. This gave the fibres a tenacity of 2.21cN/tex. This tenacity is very low for root section fibres in comparison to other sections of the stalk which had tenacity more than 10times that value. The reason for this is the fibre were over matured and had little strength. The elongation of the root section fibres is calculated as 0.43%. The graph in fig 3.2 shows comparison of the tensile strength of fibres from different sections of the cotton stalk. The root section fibres have the lowest elongation at 0.43% of all the fibre from different sections of the cotton stalk. The tenacity of the fibres is of importance as it helps determine suitable end use of the fibres. The strength of fibres from the middle and top section which is 56.3CN/tex and 39.70cN/tex respectively is suitable for use in natural fibre composites this is after looking at properties of other commonly used natural bast fibres such as Jute which has tensile strength of 200-450MPa.
(
cN
/t
ex
)
60
50
40
T
en
ac
it
y
30
Location of fibres
Fig 3.2. Fibre tenacity results for fibres from different sections of the cotton stalkOne way multi variate analysis test was carried out on the data from the mechanical properties of the cotton stalk fibres. Table 3.2 shows the test results obtained for the MANOVA multivariate test.
Table 3.2. Showing the test results for the multivariate analysis test.
Error Partial Eta Obser
ved
Effect Val
ue
F Hypoth esis
df Sig Squared Nonc
ent
Power b Interce
pt
Pillai's 0.995 7.892E 3
3 115 0 0.995 23676.7
2 1
Trace a
Wilks' 7.892E 3
` Lambd
a
0.005 3 115 0 0.995 23676.7
2 1 a Hotelli ng's 7.892E 3 Trace 205.8
85
3 115 0 0.995 23676.7
2 1 a
Roy's 7.892E 3 Largest
Root
205.8 85
3 115 0 0.995 23676.7
2 1 a
Locati on
Pillai's 0.701 20.862 6 232 0 0.35 125.172 1 Trace
Wilks' Lambd a
0.357 25.814 a
6 230 0 0.402 154.886 1
Hotelli ng's
Trace 1.638 31.12 6 228 0 0.45 186.719 1
Roy's 1.532 59.232 c
3 116 0 0.605 177.695 1
Largest Root
a. Computed using alpha = .05
Fib re 10 0 Root
section Middle section Top section
b. The statistic is an upper bound on F that yields a lower bound on the significance level
6Design: Intercept + Location
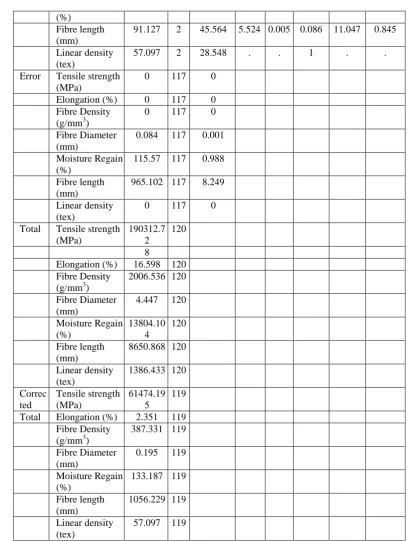
From the multivariate tests Pillai’s Trace shows there is a significant difference between groups as it is less than the computed alpha of 0.05. There was significant difference between fibres from different location when considered jointly on the variables tensile strength, elongation, fibre density, fibre diameter, fibre length, linear density and moisture regain, Wilk’s A= 0.357, F(6, 230) = 25.81, p < 0.0005, partial n2 = .402. We can see from test of between subject effects in Table 3.3 that location has a statistically significant effect on Fibre diameter (F (2,117) = 76.34; p<0.0005; partial n2 = 0.566 and Moisture Regain (F (2,117) = 8.917; p<0.0005; partial n2 = 0.132 and Fibre length (F (2,117) = 5.524; partial n2 = .086. A Bonferroni alpha correction was made to account for multiple ANOVAs being run. As such in this case it acceptable that statistical significance at p <0.025. The significant ANOVAS can be followed up with Tuskey’s HSD post-hoc tests. Table 3.4 shows the ANOVA multiple comparisons.
Table 3.3. Tests of between subjects Effects Sourc
e
Dependent Variable
Type III df Mean Square
F Sig. Partial Noncent .
Observe d
Sum of Eta Parame
t
Powerb
Squares Square
d er Correc ted Tensile strength (MPa) 61474.19 5
2 30737.097 . . 1 . .
Model a
Elongation (%) 2.351a 2 1.176 . . 1 . .
Fibre Density (g/mm3)
387.331a 2 193.665 . . 1 . .
Fibre Diameter (mm)
.110c 2 0.055 76.34 0 0.566 152.68 1
Moisture Regain (%)
17.617d 2 8.808 8.917 0 0.132 17.835 0.97
Fibre length (mm)
91.127e 2 45.564 5.524 0.005 0.086 11.047 0.845
Linear density (tex)
57.097a 2 28.548 . . 1 . .
Interce pt Tensile strength (MPa) 128838.5 3
1 128838.53 3
. . 1 . .
3
Elongation (%) 14.247 1 14.247 . . 1 . .
Fibre Density (g/mm3)
1619.205 1 1619.205 . . 1 . .
Fibre Diameter (mm)
4.253 1 4.253 5.90E +0
0 0.981 5895.32 2 1 3 Moisture Regain (%) 13670.91 8
1 13670.918 1.38E +0
0 0.992 13840.0 9
1
4 6
Fibre length (mm)
7594.639 1 7594.639 920.70 4
0 0.887 920.704 1
Linear density (tex)
1329.336 1 1329.336 . . 1 . .
Locati on Tensile strength (MPa) 61474.19 5
2 30737.097 . . 1 . .
Elongation (%) 2.351 2 1.176 . . 1 . .
Fibre Density (g/mm3)
387.331 2 193.665 . . 1 . .
Fibre Diameter (mm)
0.11 2 0.055 76.34 0 0.566 152.68 1
(%) Fibre length (mm)
91.127 2 45.564 5.524 0.005 0.086 11.047 0.845
Linear density (tex)
57.097 2 28.548 . . 1 . .
Error Tensile strength (MPa)
0 117 0
Elongation (%) 0 117 0
Fibre Density (g/mm3)
0 117 0
Fibre Diameter (mm)
0.084 117 0.001
Moisture Regain (%)
115.57 117 0.988
Fibre length (mm)
965.102 117 8.249
Linear density (tex)
0 117 0
Total Tensile strength (MPa)
190312.7 2
120
8
Elongation (%) 16.598 120 Fibre Density
(g/mm3)
2006.536 120
Fibre Diameter (mm)
4.447 120
Moisture Regain (%)
13804.10 4
120
Fibre length (mm)
8650.868 120
Linear density (tex)
1386.433 120
Correc ted
Tensile strength (MPa)
61474.19 5
119
Total Elongation (%) 2.351 119 Fibre Density
(g/mm3)
387.331 119
Fibre Diameter (mm)
0.195 119
Moisture Regain (%)
133.187 119
Fibre length (mm)
1056.229 119
Linear density (tex)
57.097 119
R Squared = 1.000 (Adjusted R Squared = 1.000) a.Computed using alpha = .05
d.R Squared = .566 (Adjusted R Squared = .559)R Squared = .132 (Adjusted R Squared = .117) e.R Squared = .086 (Adjusted R Squared = .071)
extraction would break easily. Whereas on the top section the fibres were easy to remove with minimum breakages giving long fibres. This parameter can also affect critical length required in fabrication of different types of composites.
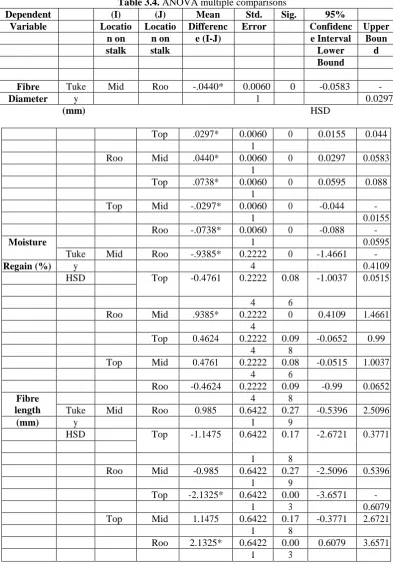
Table 3.4. ANOVA multiple comparisons
Dependent (I) (J) Mean Std. Sig. 95%
Variable Locatio Locatio Differenc Error Confidenc Upper
n on n on e (I-J) e Interval Boun
stalk stalk Lower d
Bound
Fibre Tuke Mid Roo -.0440* 0.0060 0 -0.0583 -
Diameter y 1 0.0297
(mm) HSD
Top .0297* 0.0060 0 0.0155 0.044
1
Roo Mid .0440* 0.0060 0 0.0297 0.0583
1
Top .0738* 0.0060 0 0.0595 0.088
1
Top Mid -.0297* 0.0060 0 -0.044 -
1 0.0155
Roo -.0738* 0.0060 0 -0.088 -
Moisture 1 0.0595
Tuke Mid Roo -.9385* 0.2222 0 -1.4661 -
Regain (%) y 4 0.4109
HSD Top -0.4761 0.2222 0.08 -1.0037 0.0515
4 6
Roo Mid .9385* 0.2222 0 0.4109 1.4661
4
Top 0.4624 0.2222 0.09 -0.0652 0.99
4 8
Top Mid 0.4761 0.2222 0.08 -0.0515 1.0037
4 6
Roo -0.4624 0.2222 0.09 -0.99 0.0652 Fibre
length
4 8
Tuke Mid Roo 0.985 0.6422 0.27 -0.5396 2.5096
(mm) y 1 9
HSD Top -1.1475 0.6422 0.17 -2.6721 0.3771
1 8
Roo Mid -0.985 0.6422 0.27 -2.5096 0.5396
1 9
Top -2.1325* 0.6422 0.00 -3.6571 -
1 3 0.6079
Top Mid 1.1475 0.6422 0.17 -0.3771 2.6721
1 8
Roo 2.1325* 0.6422 0.00 0.6079 3.6571
1 3
Based on observed means. The error term is Mean Square (Error) = .000 *. The mean difference is significant at the .05 level.
* Top – Top section of cotton stalk *id – Middle section of cotton stalk *Roo – Root section of cotton stalk
The cotton stalk fibres exhibited characteristics that made them suitable for use in different composite applications. The fibres from the root section showed overall statistically significant variation in terms of their tensile strength compared to fibres from the middle section and top section. With the root section fibres having tensile strength of 2.21cNtex compared to middle section fibres which had tensile strength of 56.3cNtex and top section fibres of 39.79cN/tex. There was statistical significant variation in fibre diameter of middle and top fibres, middle and root fibres as well as root and top fibres. There was no statistically significant variation in the following properties moisture regain, fibre length between fibres in the top section and middle section but there was statistically significant variation between middle section and root section as well as top section and root section fibres.. The fibres from the middle section showed the best overall mechanical properties followed by fibres from the top section. The fibres from the root section had poor tenacity. Further study needs to be carried out to study the chemical morphology of the fibres to better understand the underlining reason for the statistical variation in the properties of the fibres from different sections of the cotton stalk.
V. ACKNOWLEDGEMENTS
The author would like to appreciate sponsorship supplied by the European Union through the Metega programme that enabled this study to be possible.
REFERENCES
[1] N Reddy and Y Yang, Properties and potential applications of natural cellulose fibers from the bark of cotton stalks, Journal of Bioresource Technology, 100(14), 2009, 3563-3569.
[2] A.J.Shaikh, R.M.Gurjar, P.G Patil, K.M. Paralikar, Particle Boards from cotton stalk. Central Institute for Research on Cotton Technology, Mumbai, India, 2010
[3] M.Vinobaba, M. a, Efficacy of some selected botanical extracts against the Cotton mealybug Phenacocuccus solenopsis (Tinsley) (Hemiptera: Pseudococcidae). International Journal of Scientific and Researrch Publications, 1(3), 2014, 42250-3153.
[4] C.A. Silva, Occurrence of new species of mealybug on cotton fields in the States of Bahia and Paraiba, Brazil. Bragantia Campinas, 71(4), 2012, 467-470.
[5] K Hake, L Carter, L Moore, R Parker, R Summy, T Watson and R Willford, Cotton Stalk Management. Newslatter of the Cotton Physiology Education Program, 2(10), 1991, 1-4.
[6] Y Copur, C Guler, M Akgul and C Tascioglu, Some chemical properties of hazelnut husk and its suitability for particleboard production, Building and Environment, 2006, 2568-2572
[7] A.Yzombard, S. G.Gordon and M.Miao, Morphology and tensile properties of bast fibres extracted from cotton stalks. Textile Research Jounal, 84(3) 2014, 303-311
[8] G Cao, X Zhang, Y Wang, F Zheng, Estimation of emissions from field burning of crop straw in China, Science Bulletin. 53(5), 2008, 784-790.
[9] M Hughes, Fibres for biocomposites. Aalto University, 2015
[10] M Eriksen and B.E Pallesen, New generation airforming for flax and hemp. Nonwovens World, 2002, 80-84.
[11] S.Kalia and B. Kaith, Cellulose Fibers: Bio- and Nano-Polymer (New York: Springer, 2011).
[12] G.C Mohan Kumar, A study of short areca fiber reinforced PF composites, Proceedings of the world congress on engineering, London, UK 2008, 978-988
[13] J Holbery, D.Houston, Natural fibre reinforced polymer composites in automotive applications, Jounal of the minerals, metals and materials society, 2006, 80-86
[14] Miao, A Yzombaer and S Grdon, Bast fibres extracted from cotton stalks as reinforcement for polymer composites. Composites Australia Confrence, Gold Coast, Australia,, 1-25, 2015
[15] N.Z.Nkomo, L.C.Nkiwane, D.Njuguna, E.N.Oyondi, Extraction and characterisation of the mechanical properties of cotton stalk bast fibres, Proceedings of the 2016 Annual Conference on Sustainable Research and Innovation, Nairobi, Kenya, 2016, 10-16
[16] ASTM-D5103-07, Standard test method for length and length distribution of manufactured staple fibres (Single fiber test) Pennsylvania: ASTM International, 2012, Retrieved from www.astm.org
[17] ASTM-D3822, Standard test method for tensile properties of single textile fibers. Pennsylvania: ASTM International, 2014, Retrieved from www.astm.org
[18] ASTM D629-15, Standard test method for quantitative analysis of textiles. Pennsylvania: ASTM International, 2015 Retrieved from www.astm.org
[19] ASTM-D1577-07, Standard test method for linear density of textile fibers. Pennsylvania: ASTM International, 2012 Retrieved from www.astm.org

![Fig 1.1. Cross section of a bast stem [10] Most of the natural fibres are relatively cheap to extract and prepare for use](https://thumb-us.123doks.com/thumbv2/123dok_us/7818852.1664465/2.595.145.449.295.452/cross-section-natural-fibres-relatively-cheap-extract-prepare.webp)