Vol. 08, Issue 7 (July. 2018), ||V (II) || PP 18-26
Comparative and Analysis Study for Malicious Executable by
Using Various Classification Algorithms
Sefer Kurnaz
1, Mokhalad Eesee Khudhur
2 1(Department of Computer Engineering, Altinbas University, Turkey) 2(M.S. Student, Department of Information Technology, Altinbas University, Turkey) Corresponding Author: Sefer Kurnaz
Abstract : - There are a lot of applications regarding the data mining methods in detecting malwares. One of
the most widely utilized data mining methods is the Classification method. In our research, we are presenting a data mining classification procedure through applying machine learning algorithms to detect malicious executable files, and this study will investigate the approach of classification in some algorithms such as (Support Vector Machine, Random Forest, KNN (k-Nearest Neighbors Classifier), and The Hoeffding Tree). In our classification process, we used some of well-known machine-learning algorithms by WEKA libraries, and then we train our dataset to detect malware. We made a comparative analysis between algorithms used and how they deal with the selected features based on the size of the data, to illustrate the performance efficiency. Where we got a high accuracy up to 98% with Random Forest. Moreover, this study is considered as a base for future studies regarding malware analysis through machine learning algorithms.Keywords:
- Machine Learning Algorithms, Computer Malicious Executable Files, Decision Tree, Classification, Active Learning.--- Date of Submission: 22-06-2018 Date of acceptance: 07-07-2018
---I.
INTRODUCTION
In this section will discuss a short background and previous studies related to the process of detecting malware in data extraction techniques. They present study to detect malware software by using data mining algorithms. And performance of them proposed are worked a comparison between these classification algorithms to choosing the best classifier depended on size of the dataset based on Different ranker methods are applied to select most worth features. Neural Network achieves the highest accuracy based on "Information Gain IG" ranker. When Gain Ratio is used as a selection attribute ranker, KNN gains the highest accuracy [2]. They worked focused on analysis of malwares detection, where deal with one million files, both malicious and benign and thousands of features were extracted, by using (Random Forest and Naive Bayes) machine learning algorithms. And then train dataset to detection malicious programs. Where showed results accuracy up to 96% and false positive rate (FPR) of 2.1% [5]. They presented a methodology for classification malware family, base on three different approach that include (bytecode features), (assembler code features) and Portable Executables (PE) features, where make many of experiments to test the features and then compared between classifiers, that used it such as support vector machine, decision tree and random forest. Where showed the results a good accuracy up to 93.56% with Random Forest technique [6]. The authors deal with four different approach of filter-based FSTs like "Distinguishing Feature Selector (DFS)", "Mutual Information (MI)", "Categorical Proportional Difference (CPD)", and "Darmstadt Indexing Approach (DIA)", and to find out their effect on the classifier decision, when dealing with different data sets, to evaluation of the efficiency of classifier and measures [7]. They presented a systematic regarding malware detection by utilizing data mining. The papers were examined and categorized into two major parts: behavior-based and signature-based techniques. Most of the suggested studies were discussing android smartphones, the results demonstrated that SVM technique has the best percentage for malware detection technique with 29%, Best-Fit has 5%, Naive Bayes has 10%, Decision tree has 14%, j48 has 17%, and the other techniques have less than 3% in data mining results. We found that SVM technique is the most accurate technique in the signature-based malware detection techniques utilizing data mining [8]. Focused that paper on classifying of malicious web pages by using three supervised machine learning techniques and two unsupervised machine learning techniques, and dealt with different features such as content, URL and screenshot of web pages extracted by a concurrent crawler taking advantage of event. They proposed demonstrated the ability of machine learning algorithms to deal with a wide range of data with high accuracy of up to 97% for the supervised techniques and 0.96 for the unsupervised techniques [9]. Multiple Instance Learning for Malware Classification. the authors suggested a model regarding the behavior of malware detected through the interactions with the network resources and the OS (actions on OS error messages, network servers, registry keys, mutexes, and files). This technique is proved to be effective in reducing the randomization impact of deployed generally by malware to avoid being detected. The results showed an increase in malware detection accuracy with Random Forest (95.4% correctly detected malware, 93.4% and 79.5%) with lower number of false alarms (6.7% of false alarms, 8.1% and 10.8%) [10]. In other studies authors worked on the malware sampling and handling it via utilizing machine learning algorithms for the purpose of classifying based on 17,900 samples taken from 51 families. Results reached 94% and 92.5% for testing and training accuracy. Results of the research showed that runtime behavior modelling is an important technique for malware classification [11]. In [12] Authors tried to identify the behavior of harmful data based on global features by utilizing (Gabor) wavelet transform and (GIST). After that they did an experiments on Mahenhur dataset that include 3131 binaries sample and 24 malware families, depending on Artificial Neural Networks (ANN) algorithm to efficiently classify and detect malwares. The results showed and accuracy up to 96.35%. In [13] they gathered header entries from executables in dataset and utilized SVM classification algorithm, also handling feature selection was done in simultaneous way and executed with classifier training for the purpose of reducing the number of attributes. And evaluated the model by 7,863 harmful files (backdoors, trojans, email worms and viruses) and 1,908 benign programs. The results stated a high performance in detecting e-mail worms and viruses. In [14] they performed experiment for detection of 'Trojans'. And used instruction sequence as their feature. Their data set contains (4,722) files. (3,000) files were Trojans and the (1,722) were benign programs. And used Random Forest, Bagging and Decision Tree with this data. The best results for false positive rate and 94.0% accuracy with Random Forest classifier on all the variables.
This study provides several contributions in malware detection, Where the main goal of our work is to increase speed and accuracy in detecting malware for windows 32-bit by using machine learning algorithms, we took a data set and trained it, to determining the data type if it is malicious or normal. This work contributes to the detection of malware in the case of anyone adding new data, also we have contributed to reducing the data set to get the best features that help increase detection accuracy, we obtained high results based on the comparison conducted between the algorithms SVM, KNN, Hoeffding Tree and Random Forest. comparison with previous study we obtained the highest accuracy and less time.
II.
METHODOLOGY
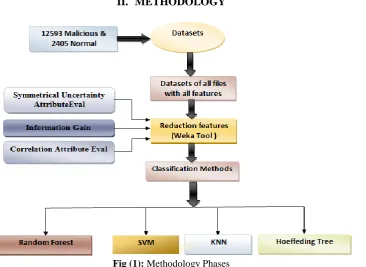
Fig (1): Methodology Phases
The purpose of this work is to overcome the problem of choosing the best feature selection method and a fit classifier to detect malware, so we made a preprocess and test for this data for the purpose of selecting subset of features useful and relevant, to get the highest accuracy. In our methodology has three phases. The first stage we are taking malware dataset and deal with it by WEKA Tool. In the second stage, feature selection, which is reduction the dataset features to get the effective features, where this selection has been done by some classification algorithms such as SVM, KNN, Hoeffding Tree and Random Forest method, then we got three sets of features are (Symmetrical Uncertainty AttributeEval, Information Gain (IG) and Correlation Attribute Eval). The final stage, we made a compared performance of classification methods to select the better algorithm. The above Fig :1 shows our methodology. For specifying the performance of classification methods in WEKA, will describe some effective measures supported in my work:
- Receiver Operating Characteristically(ROC) graph it is a method for selecting, organizing and visualizing classifiers based on performance.
- The True Positive Rate (TPR) measure it is the rate regarding malwares samples (i.e., positive instances) classified accurately through the classification model.
- The False Positive Rate (FPR) it is defined as the rate of normal files (i.e., negative instances) that are classified in a wrong way.
- Accuracy It does measure the rate of accurately classified file instances, including negative and positive
instances. Accuracy =
- Recall is defined as the proportion of the positive cases which were identified in an accurate way.
Recall =
- precision (P) is defined as the proportion of predicted positive cases that were correct.
Precision =
Recall and Precision are the mainly utilized measures for determining the accuracy of classification [15]. WhereTP, TN, FP, FN are described as follows:
4-False Negative (FN): The number of file samples which classified as benign wrongly.
2.1. DATASET COLLECTION
There are few resources to collect malwares and they are dangerous to deal with. We collect our samples from different websites such as http://vxheaven.org,
http://leetupload.com/dbindex2, http://dasmalwerk.eu, and http://www.malwareblacklist.com, http://thezoo.morirt.com.
Our data set consists of (14998) executable files divided into (12593) malicious executable files and (2405) normal executable files. In this study, the dataset represents the malware of win32, which invades the system as executable file and uses the system calls and DLL files from windows system for specific unwanted reasons.
2.2 FEATURES SELECTION
To increase the accuracy of prediction, irrelevant and redundant features are removed by feature selection technique. However, in our study, the feature set is very large, thus, it is impossible to utilize all these sets for training because of a number of reasons. The first reason is that the training could be slow. The second reason is that the classifier could be disorganized with massive number of features, thus it can't get good accuracy, as most of them will become irrelevant, redundant or noisy. So, the data must be pre-processed to select a subset of the features relevant and useful. So, we choose in this work three different sets of features "Symmetrical Uncertainty AttributeEval", "Information Gain (IG)", and " Correlation Attribute Eval " as the selection criterion, as the best criterion utilized to select best features. As explained below [16].
1. Symmetric Uncertainty Attribute Eval
In this technique, the worth of the feature is being evaluated based on the symmetrical uncertainty of each attribute. The nominal attributes are on value basis via handling each value as indicator. An overall correlation for a nominal attribute is arrived at via a weighted average.
2. Information Gain (IG)
Information Gain (IG) approach is most utilized in machine learning field. It is utilized to decide what variables to apply first in the classification process. Higher the information gain, higher are the chances of getting pure classes in a target class if split on the variable with the highest gain, Information gain is calculated by how much of a term can be used for classification of information, so have been using this feature to evaluate the ability of the proposed approach to correctly detect malicious samples.
3. Correlation Attribute Eval
Correlation Attribute Eval is a calculate the correlation between each attribute and the output variable and select only those attributes that have a moderate positive or negative correlation and drop those attributes with a low correlation (value close to zero). Correlation is a popular technique for selecting the most relevant features in dataset.
2.3. Weka
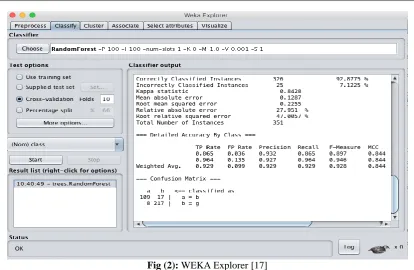
Fig (2): WEKA Explorer[17]
In the Figure 2 above, 'classify' window comes up. Where show the start analyzing the data by using Random Forest algorithm, which includes a ratio of the Correctly Classified Instances and Incorrectly Classified Instances. Also explained Kappa Statistics which is mean compare the accuracy of the system to the accuracy of the random system and Root Mean Squared Error is mean the difference between predicted value and observed value. And other hand, appear the most important measures the first column is True Positive Rate (TPR) measure is the rate regarding malwares samples classified accurately through the classification model, False Positive Rate (FPR) it is defined as the rate of normal files that are classified in a wrong way, precision is the proportion of predicted positive cases that were correct, Recall is the proportion of the positive cases which were identified in an accurate way, F-Measure are the majorly used measures in order to determine the classification accuracy and the final column is Receiver Operating Characteristically(ROC) graph it is a method for selecting, organizing and visualizing classifiers based on performance.
III.
EXPERIMENT
RESULTS
The following results were obtained from WEKA with Ten-fold cross validation, as it proved to be statistically efficient in performance evaluation regarding the classifier. With 75% of the whole dataset for training and 25% of the data for testing. Where Random forest, SVM, and KNN demonstrated the highest accuracy. while Hoffeding tree gave a low accuracy. The Random Forest classifier gave the highest accuracy for all types of feature selection. When this accuracy was put to comparison with number of features selected by the feature selection techniques.
3.1. Classification of The Symmetrical Uncertainty AttributeEval
The Table (1) indicates the result of the four classifiers that were used. The first column represents the name of classifier, the second column represents true positive rate, which can be abbreviated to (TPR), third column Indicates (FPR), which is an abbreviation for false positive rate, that is the rate of normal files, the fourth column represents precision and recall are used to determine the classification accuracy and finally accuracy (ACC).
TIME ACC
RECALL PRECISIO
N FPR TPR
CLASSIFIER
25.04 96.1
96.1 96.1
16.3 96.1
SVM
5.2 97.8
97.9 97.9
07.2 97.9
KNN
6.4 94.5
94.5 94.4
17.7 94.5
Hoeffding Tree
21.7 98.1
98.2 98.2
07.0 98.2
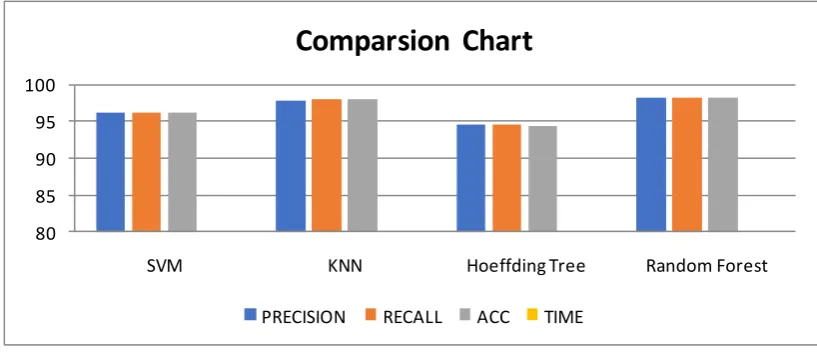
We present in Fig: 3 the accuracy of each classifier, that have been applied with "Symmetrical Uncertainty AttributeEval" feature which are considered the best technique for feature selection and most feature selection system based on mutual information utilize this measure. The accuracy of each classifier based on the top of 100 attributes, Random Forest give the highest accuracy with 21.7 seconds, KNN has close accuracy to Random Forest but there is a clear difference in time it takes short time 5.2 seconds, SVM achieves a good accuracy and a long time to build model comparing with other classifiers based on 25.04 seconds.
80 85 90 95 100
SVM KNN Hoeffding Tree Random Forest
Comparsion Chart
PRECISION RECALL ACC TIME
Fig (3): Accuracy of classifiers based on Symmetrical Uncertainty AttributeEval algorithm
3.2. Classification of The Information Gain (IG)
IG is a measurement function to determine the best features in the classification process. The higher the information that is collected, the higher are chances of having pure classes in a target class if split on the variable with the highest gain. Shows Table (2) the results for each classifier, which deal with on the top of 50 attributes.
TIME ACC
RECALL PRECISIO
N FPR TPR
CLASSIFIER
12.88 95.3
95.4 95.3
17.9 95.4
SVM
5.5 97.0
97.0 97.0
10.4 97.0
KNN
5 93.5 93.5
93.8 14.4
93.5 Hoeffding Tree
15.8 97.4
97.4 97.4
9.5 97.4
Random Forest
Table 2: Applying Classifiers Based on Information Gain Algorithm
The Classification algorithms have proved high accuracy between 95.3, 97, 93.5 and 97.04 in this approach, which takes a sometime to build model. As the figure shows. Also, if we want to appreciate, which model is the best depending on the Fig: 4, where Random Forest has good accuracy comparing with other classifiers and it takes 15.8 seconds. Also, we can get high accuracy with the least time, KNN is the best to build and test the model, where take 5.5 seconds.
3.3. Classification of The Correlation Attribute Eval
The Correlation Attribute Eval the worth of a subset of attributes through considering individual predictive capability via classifying each feature with the degree of redundancy between them. Table.3 shows the results of the four classifiers that applying with the best features.
TIME ACC
RECALL PRECISION
FPR TPR
CLASSIFIER
11.8 95.3
95.3 95.2
18.5 95.3
SVM
52 96.8
96.8 96.8
11.7 96.8
KNN
2.1 93.1
93.2 93.4
16.1 93.2
Hoeffding Tree
14.6 97.1
97.2 97.1
10.4 97.2
Random Forest
TABLE 3: Applying Classifiers Based on Correlation Attribute Eval Algorithm
The results in this approach gave good accuracy is between 93.1, 95.3, 96.8 and 97.1 which take a long time to build the model, the classifier SVM showed a high accuracy comparing with other classifiers and it takes time 15.8 seconds to build and test the model. According to Fig: 5, Random Forest achieves a good accuracy comparing with other classifiers and it takes 14.6 seconds. On the one hand, if we want to get high accuracy and less time, KNN is considered one of the best classifiers in feature.
80 85 90 95 100
SVM KNN Hoeffding Tree Random Forest
Comparsion Chart
PRECISION RECALL ACC TIME
Fig (5): Accuracy of classifiers based on Correlation Attribute Eval algorithm
Finally, we made a compared based on performance of classification algorithm to select the best. Table (4) shows the accuracy of each classifier in the three sets of features (Symmetrical Uncertainty AttributeEval, Information Gain and Correlation Attribute Eval), where Random Forest and KNN are achieve the best accuracy in (Symmetrical Uncertainty AttributeEval) of features. Generally, SVM, KNN and Random Forest are achieved the highest rate. However, SVM is takes a long time to build the model while KNN takes a less time in all totals.
Classifier Symmetrical Uncertainty
AttributeEval
Information Gain Correlation Attribute Eval
SVM 96.1 95.3 95.3
KNN 97.8 97.0 96.8
Hoeffeding Tree 94.5 93.5 93.1
Random Forest 98.1 97.4 97.1
Table 4: Comparison of Accuracy of Three Features Selected
IV.
COMPARISON
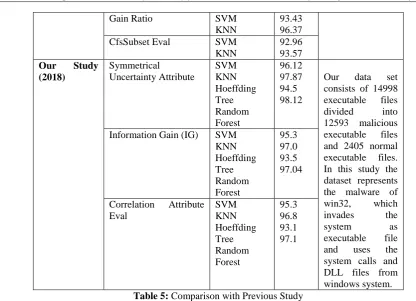
In order to validate well-chosen, the best method for the classification of Malicious Executable, we compare our results with previous work, as we shown in the Table (5) below.
Gain Ratio SVM KNN
93.43 96.37
CfsSubset Eval SVM
KNN
92.96 93.57 Our Study
(2018) Symmetrical Uncertainty Attribute SVM KNN Hoeffding Tree Random Forest 96.12 97.87 94.5 98.12
Our data set consists of 14998 executable files divided into 12593 malicious executable files and 2405 normal executable files. In this study the dataset represents the malware of win32, which invades the
system as
executable file and uses the system calls and DLL files from windows system. Information Gain (IG) SVM
KNN Hoeffding Tree Random Forest 95.3 97.0 93.5 97.04
Correlation Attribute Eval SVM KNN Hoeffding Tree Random Forest 95.3 96.8 93.1 97.1
Table 5: Comparison with Previous Study
As according to Table (5) above for Previous Study in [2] They presented study to detect malware software, then they chose a set of features such as (Gain Ratio, IG, and CfsSubsetEval) by using classifier algorithms. Where the results showed accuracy up to 96% with taken a long time to build model. While in our study we used some classifier algorithms to deal with dataset and then we got the best three features are (Symmetrical Uncertainty AttributeEval, Information Gain and Correlation Attribute Eva). Where our results gave a higher accuracy of up to 98% and taking less time compared with previous study.
V.
CONCLUSION
As regards this study, the complexity of detecting unknown and new malwares, our method for malware detection along with some modern-day technologies were all addressed and discussed. Also, the aims for this study were all achieved. Algorithms regarding machine learning, some representation techniques, and desired features selection were evaluated and applied. And we provide a comparison between these classification algorithms (SVM, KNN, Random Forest, Hoeffiding Tree) In terms of the highest speed and accuracy for detecting malicious files. Depending on the set of features obtained (Symmetrical Uncertainty AttributeEval, Information Gain (IG), Correlation Attribute Eval) by using Weka. Where our study showed different outcomes, Hoeffiding Tree had achieved the lowest accuracy (93.1%), followed by k-Nearest-Neighbors, SVM and Random Forest (95.3%, 96.8% and 97.1%) based on the top of 50 features of the Correlation AttributeEval. On the other hand, Random Forest and KNN had achieved the highest accuracy (98.1% and 97.8%) based on the top of 100 features were selected of Symmetrical Uncertainty AttributeEval. Based on the comparison made in our work for the classification algorithms in the Table 4 above, where we concluded that Random Forest technique is the best to detect malware. Finally, in this work we made a comparison between our study and previous study. Where our results gave a higher accuracy of up to 98% and taking less time compared with previous work. As shown in the Table (5) above.
REFERENCES
[1]. Zhuojun Ren and Guang Chen, "EntropyVis: Malware Classification," Image and Signal Processing, BioMedical Engineering and Informatics (CISP-BMEI), 2017 10th International Congress on,IEEE, pp. 1-6, 2017.
[3]. Mozammel Chowdhury , Azizur Rahman and Rafiqul Islam, "Protecting Data from Malware Threats using Machine Learning Technique," Industrial Electronics and Applications (ICIEA), 2017 12th IEEE, pp. 1691 - 1694, 2017.
[4]. Muazzam Siddiqui, Morgan C. Wang and Joohan Lee, "A Survey of Data Mining Techniques for Malware Detection using File Features," Proceedings of the 46th Annual Southeast Regional, pp. 509-510 , 2008.
[5]. Moustafa Saleh, Tao Li and Shouhuai Xu, "Multi-context features for detecting malicious programs," Journal of Computer Virology and Hacking Techniques, Springer, vol. 14, no. 2, p. 181–193, 2015. [6]. Bowen Sun , Qi Li , Yanhui Guo , Qiaokun Wen , Xiaoxi Lin and Wenhan Liu, "Malware family
classification method based on static feature extraction," Computer and Communications (ICCC), 2017 3rd IEEE International , pp. 507 - 513, 2017.
[7]. C.D.Jaidhar, S.L.Shiva Darshan and, "Performance Evaluation of Filter-based Feature Selection Techniques in Classifying Portable Executable Files," Procedia Computer Science, sciencedirect, vol. 125, pp. 346-356, 2017.
[8]. Alireza Souri and Rahil Hosseini, "A state-of-the-art survey of malware detection approaches using data mining techniques," Human-centric Computing and Information Sciences, pp. 2-22, 2018.
[9]. H. B. Kazemian, S. Ahmed, "Comparisons of machine learning techniques for detecting malicious webpages," Expert Systems with Applications, ScienceDirect, vol. 42, no. 3, pp. 1166-1177, 2015. [10]. JanStiborek, Tomás̆Pevný and MartinRehákab , "Multiple Instance Learning for Malware Classification,"
Expert Systems with Applications, sciencedirect, no. 93, pp. 346-357, 2017.
[11]. Abdurrahman Pektas and Tankut Acarman, "Classification of malware families based on runtime behaviors," Journal of Information Security and Applications, sciencedirect, vol. 37, pp. 91-100, 2017. [12]. Aziz Makandar and Anita Patrot , "Malware analysis and classification using Artificial Neural Network,"
Trends in Automation, Communications and Computing Technology (I-TACT-15), 2015 International,IEEE, pp. 1-6, 2015.
[13]. Tzu-Yen Wang, Chin-Hsiung Wu and Chu-Cheng Hsieh, "Detecting Unknown Malicious Executables Using Portable Executable Headers," INC, IMS and IDC, 2009. NCM '09. Fifth International Joint Conference on, pp. 278 - 284, 2009.
[14]. M. Siddiqui, M. C. Wang and J. Lee, "Detecting Trojans Using Data Mining Techniques," Wireless Networks, Information Processing and Systems,SpringerLink, vol. 20, pp. 400-411, 2008.
[15]. Nikola Milosevic a , Ali Dehghantanha b and Kim-Kwang Raymond Choo, "Machine learning aided Android malware classification," Computers & Electrical Engineering, vol. 61, pp. 266-274, 2017. [16]. [Online]. Available:
https://machinelearningmastery.com/perform-feature-selection-machine-learning-data-weka/. [Accessed 20 4 2018].
[17]. [Online]. Available: http://www.cs.waikato.ac.nz/ml/weka/; last access:. [Accessed 22 4 2018].