Vibration Control of Smart Structure Using
Sliding Mode Control with Observer
Junfeng Hu
School of Mechanical & Electrical Engineering, Jiangxi University of Science and Technology, Ganzhou, 341000, China
Email: [email protected]
Dachang Zhu
School of Mechanical & Electrical Engineering, Jiangxi University of Science and Technology, Ganzhou, 341000, China
Email: [email protected]
Abstract—This paper studies the application of the sliding mode control method to reduce the vibration of flexible structure with piezoelectric actuators and strain gage transducer in practical complex environment. The state-space dynamic model of the system was derived by using finite element method and experimental modal test. The structure is subjected to arbitrary, unmeasurable disturbance forces. Taking into account the uncertain random disturbance and measurement noise, Kalman filter is chosen as the state estimator to obtain the modal coordinates and modal velocities for the modal space control. A sliding mode controller is adopted due to its distinguished robustness property of insensitiveness to parameter uncertainties and external disturbances. The sliding surface is determined by using optimization method, and the sliding controller is designed by applying Lyapunov direct method. That is, along the switching surface, the cost function of the states is minimized. A real-time control system was built using dSPACE DS1103 platform, and vibration control tests were performed to experimentally verify the performances of the proposed controller. The results of experiment show the controller can effectively attenuate elastic vibration of the structure.
Index Terms—active vibration control, smart structure, sliding mode control, experimental modal test, Lyapunov direct method
I. INTRODUCTION
In precision and aerospace industry, many researches on lightweight and miniaturized structures have been carried out to improve structural performances. Among the researches, passive structures using composite material are typically known as one of the effective methods. However, the traditional passive structures are very sensitive to change of internal load condition and external environment condition which can even cause sudden destruction of structures. Therefore, in order to satisfy stringent requirements for precision control and
lightweight miniaturization, smart materials such as shape memory alloys, piezoceramics, electroorheological fluids and magnetorheological fluids are frequently adopted for smart structures. The performance requirements of future space structures, jet fighters and concept automobiles have brought much interest to the area of smart structures. A smart structure can be defined as a structure with bonded or embedded sensors and actuators as well as an associated control system, which enable the structure to respond simultaneously to external stimuli exerted on it and then suppresses undesired effects or enhance desired effects. Among various smart structures, those with piezoelectric patches have received much attention in recent years, due to the fact that piezoelectric materials have simple mechanical properties, small volume, light weight, large useful bandwidth, efficient conversion between electrical and mechanical energy, good ability to perform vibration control and ease of integration into metallic and composite structures [1-3].
Different control techniques have been investigated in the control of smart structure. Abreu conducted experimental work for the vibration control of flexible beam by using piezoelectric sensors and actuators with Linear Quadratic Gaussian (LQG) controller [4]. There are many classical strategies that can be used when the mathematical model is available, for instance pole allocation and optimal control. However, if the model has uncertainties these methods are not indicated. There are many robust techniques in structural control literature. Li investigated two control strategies for robust vibration control of parameter uncertain systems [5]. Mayhan combined intelligent control and smart materials to produced an adaptive and robust controller to dampen the fundamental vibration mode of the system in the presence of modeling uncertainties [6]. Zhang et al. studied the active vibration control problem for the high-speed flexible mechanisms all of whose members were considered as flexible by using complex mode method and robust H∞ control scheme [7-8]. Kawabe utilized
neural networks (NN) theory for active control in a longitudinal cantilevered-beam system by simulation and experiment. It is found that fairly satisfactory active Manuscript received Nov. 1, 2010; revised Jan. 5, 2011; accepted
damping effect using the NN controller is obtained [9]. But the random disturbance and measurement noise of the actual system were not considered by these currently proposed vibration control strategies. The issue of robustness against external disturbances was not addressed, and therefore the proposed vibration controllers cannot be effectively applied to the smart structure under the random uncertain disturbances. Because sliding mode control has inherent robustness to system parameter variation and external disturbances, it is meaningful to investigate its application in vibration control of smart structure.
We aim here to deal with the active vibration reduction problem in flexible structure with uncertainties through designing reasonable sliding mode controller. The developed control strategy integrates the sliding mode control strategy and Kalman filter technique. In this paper, the vibration control of a flexible beam is investigated by using sliding mode control with observer and experimental modal test method, and taking into account the random disturbance uncertainty, modal parameter uncertainty and measurement noise. The paper is organized as follows. In section 2, a dynamic model of a flexible beam with piezoelectric actuators and strain gauge sensors is constructed by using finite element method. In section 3, the sliding mode controller with observer is proposed, and sliding surface is determined by using optimization method, and the sliding controller is designed by applying Lyapunov direct method. In section 4, experimental identification of the flexible cantilever beam is performed to obtain its modal parameters. And the experimental validation test is performed based on the dSPACE DS1103 platform. The conclusions are given in section 6.
II.DYNAMIC MODELING OF SMART STRUCTUE The modeling of smart structure with piezoelectric actuators and sensors has been a subject of intense research for a long time and is only briefly described here.
x y
1 u 3
u u5
6 u
8 u 2
u
4 u
7 u e
L
A B
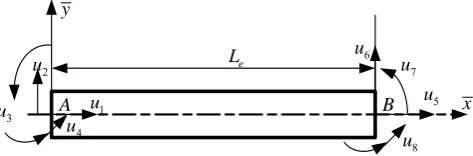
Figure 1. Planar beam element showing nodal degrees of freedom and coordinate systems
The flexible structure is modeled by using a two-node beam element. The beam element is shown in Fig. 1, which has two nodes with four degrees of freedom at each node; namelyu1,u5, the longitudinal displacement,
and u2,u6,the transverse displacement, and u3,u7, the
slope, and u4 ,u8, the curvature. Le is the length of
element. The nodal displacement vector u with respect to reference frame A−x yis expressed as
[
]
T1 2 3 4 5 6 7 8
u u u u u u u u
=
u
The transverse and longitudinal displacement fields of two-node beam element are constructed using the quintic hermite and linear interpolation polynomials, respectively.V , W denotes longitudinal and transverse
elastic displacement of arbitrary point, respectively. Subscript T denotes matrix transpose. They can be written by the following form
( )
( )
( )
( )
1 2
, ,
V x t x
W x t x
⎡ ⎤ ⎡ ⎤
=
⎢ ⎥ ⎢ ⎥
⎢ ⎥ ⎢ ⎥
⎣ ⎦ ⎣ ⎦
N u N
where N
( )
x =⎣⎡N1( )
x N2( )
x ⎤⎦Tis shape function, uisthe nodal displacement vector.
The system dynamic equations can be obtained by using finite element method
+ + =
MU CU KU P (1)
where M ,C , K are the systematic mass, damping, stiffness, respectively. U ,U ,U are the generalized displacement, velocity, and acceleration vectors of the system, respectively. P is the systematic generalized disturbance force vector corresponding to vector U.
The piezoelectric patches work as actuators are perfectly bonded on the upper and lower surfaces of the beam at the same location. For the modeling of PZT actuators, literature [10, 11] provides a detailed derivation of coupling of PZT actuators and a host beam. These bending moments induced by the actuators is given by
(
)
31 p p p a in A B
T =T = −d E b t +t V (2)
whered31 , Ep ,bp ,tp is piezoelectric constant, elastic
module, width, and thickness of PZT patch, respectively.
a
t is the thickness of the beam element, Vin is the vector of input voltage to the piezoelectric actuators. The moments are assembled as a part of the external moments exerted on node.
Strain is the amount of deformation of a structure due to an applied force. Strain gauge is the most common sensor for measuring strain. A strain gauge’s electrical resistance varies in proportion to the amount of strain placed on it. The deformations mainly include compression or tension and bending deformation for the flexible beam. The strain
ε
in x direction is given byL B
ε ε= +ε (3)
where εL is compression or tension strain and εB are
longitudinal strain due to bending deformation, respectively. They can be given by
L 1 1
B 2 2
,
h h
ε ε
′′ ′′
= =
′′ ′′
= − = −
N u N BU
N u N BU (4)
where h is the distance between the neutral axis of the beam and the outer surface of the beam, N1′′, N2′′ are
the first-order and the second-order differential of the shape function N1 and N2, respectively,B denotes the
There are a piezoelectric actuators and s strain gage sensors on the flexible structure. Combining Eq. (1) ~ Eq. (4), the dynamic equations of the structure equipped with piezoelectric actuators and strain gauge transducer can be expressed as in a s + + = + =
MU CU KU P D V y D U
(5)
where Da is the systematic control matrix related to
configuration of actuators, Ds is the systematic output
matrices determined by configuration of sensors, a a -by-1 vector, and yis the strain from the sensors, a s-by-1 vector.
It was shown that the dynamic response of the flexible structure is composed mainly of the lower modes. In order to control the lower modes, the physical-coordinate equations must be first transformed into modal coordinates. Here, we choose the first c order modes as control modes. Applying the modal theory, the normalized modal transformation is introduced by
c c
=
U ψ η (6)
where ψcis the controlled normalized modal matrix, ηc
is controlled modal coordinate vectors. Substituting Eq. (6) into Eq. (5), the system dynamic equations are rewritten as
c c c c c c ac in sc c
+ + = +
=
η C η Kη N D V
y D η
(7)
where T T T
c = c , ac = c a, sc= c s
N ψ P D ψ D D ψ D Cc, Kc is
c c× diagram matrix, which is determined by system
natural frequency and damping ratio.
For control synthesis, the system must be written as a system of first-order ordinary differential equations (ODEs). We can define the controlled state variables by the following form
[
]
T1 1
c = η η ηc ηc
X " "
Due to the controlled mode number c, the number of controlled state variables is 2c . Taking into account measurement noise ν , the state-space model for the system can be written as
c c c c in c c c
= + + = +
X A X B V N
y C X ν
(8)
where c c
c c c ⎡ ⎤ =⎢− − ⎥ ⎣ ⎦ I A K C 0 , ac c ac ⎡ ⎤ =⎢ ⎥ ⎣ ⎦ B D 0
[
]
c sc sc
,C = D 0 ,
c
I is c c× unit matrix,0ac,0scare c a s c× , × zero matrix,
respectively.
III. CONTROL SYSTEM DESIGN
Sliding mode controller (SMC) is a function of more than two structures and gives some desirable closed-loop properties. The desirable features include invariance, order reduction, and robustness against parameter variations and disturbances. The stability and robustness of SMC is guaranteed using the concept of switching
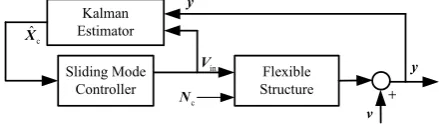
function and Lyapunov stability theory. Sliding mode control is to design a controller such that the motion of the system tends to sliding mode surface. Therefore, the design of SMC includes the determination of sliding surface and controller design. The block diagram of the control system is shown in Fig. 2. In the figure, Xˆc is the
estimated value of state vectorXc by using Kalman filter.
And the measurement noise ν is considered during the controller design. Flexible Structure Kalman Estimator Sliding Mode Controller in V y ν c ˆ X + y c N
Figure 2. Block diagram of the control system
A. Sliding Mode Surface Design
The problem now is to determine a sliding surface which guarantees stable sliding mode motion on the surface itself.
The sliding surface Scan be expressed as
c
= =
S HX 0 (9)
where T
1 2
[S S Sa]
=
S " , Siis the sliding variable, H is a a×2cmatrix. In order to determine the matrix
H, the state of the system is to make the following linear transformation.
c = c
Z ΓX (10)
where Γ is the transformation matrix, it can be given by
1
1 1 1 2
c 2 2 , − ⎡ − ⎤ ⎡ ⎤ =⎢ ⎥ =⎢ ⎥ ⎣ ⎦ ⎣ ⎦ B I B B
Γ B
B I
0
where I1 and I2are (2c− ×a) a and a a× unit matrix, 1
B and B2are (2c− ×a) a and a a× matrix, respectively,
and B2is nonsingular matrix.
Substituting Eq. (10) into Eq. (8), the state equation and sliding surface can be rewritten as the following form expressed by Zc.
1
c c c c in c in
c −
= + = +
= =
Z ΓAΓ Z ΓB V AZ BV S HZ
0 (11)
where 1
c −
=
A ΓAΓ , T T 2
⎡ ⎤
=⎣ ⎦
B 0 B , H =HΓ−1. The Eq.
(11) can be partitioned to yield
c1 11 12
c 1 2
c2 21 22
, ⎡ ⎤,
⎡ ⎤ ⎡ ⎤
=⎢⎣ ⎥⎦ =⎢ ⎥ =⎣ ⎦
⎣ ⎦
Z A A
Z A H H H
Z A A
(12)
where Zc1and Zc2are 2c−aand adimensional vector,
respectively, the dimension of other matrix are decided by the dimension of Zc1and Zc2. Thus, combining Eq.
c1 11 c1 12 c2 1 c1 2 c2
= +
= + =
Z A Z A Z
S H Z H Z
0 (13)
In order to simplify the design of sliding surface, we can assume
2=
H I (14)
where Iis unit matrix. Therefore, combining Eq. (13) and Eq. (14), the following equations can be obtained whereZc1 is considered as state variables, Zc2 is output
variables.
(
)
c1 11 12 1 c1 c2 1 c1
= − = −
Z A A H Z
Z H Z
(15)
Using the optimal method, the matrix His determined
by minimizing the following performance indexJ.
0 T c c t
J=
∫
∞X RX dt (16)where R is positive define weighting matrix.
Considering the physical meaning of state variableXc,
the weighting matrix can be selected by the following expression.
c c
c c
−
⎡ ⎤
=⎢− ⎥
⎣ ⎦
K M
R M M
where Mc ,Kcis the mass matrix and stiffness matrix
corresponding to the first ccontrol modes, respectively. Substituting Eq. (10) into Eq. (16), the performance index function can be written by the form of state variable Zc
0
T T c1
c1 c2 c2 t
J= ∞⎡⎣ ⎤⎦ ⎢⎡ ⎤⎥dt
⎣ ⎦
∫
Z Z T ZZ (17)where
1 T 1 11 12 21 22
( − ) − ⎡ ⎤
= =⎢ ⎥
⎣ ⎦
T T
T Γ RΓ T T
Combing Eq. (15) and Eq. (17), the solution of the performance function is a linear quadratic optimization problem. Using the Linear Quadratic (LQ) algorithm, the optimization problem can be solved and the following expression can be obtained
c2= − o c1
Z K Z (18)
Comparing Eq. (18) and Eq. (15) , we can obtain
[
]
1 = = o
H K, H K I Γ (19)
Substituting Eq. (19) into Eq. (9), the sliding surface can be obtained.
B. Sliding Mode Controller
Lyapunov direct method is applied to design the sliding mode controller such that the response of the system can tend to the sliding surface expressed in Eq. (9) by determining the control input. Suppose the Lyapunov function is defined as
T T T
c c
1 1
2 2
v= S S= X H HX (20)
According to Lyapunov asymptotic stability condition and Eq. (20), we can obtain
T 0
v=S S≤ (21)
where S=HXc. Substituting Eq. (8) into Eq. (21), the
above equation can be rewritten as
(
)
(
)
T T
c c c c in c
in
v= = + +
= −
S HX S H A X B V N
χ V G
where T 1
c ( c) (− c c c)
= = − +
χ S HB , G HB HA X HN . In order to satisfy the Lyapunov stable condition
0
v≤ , the control voltages can be selected as T
in = −
V G δχ (22)
where δ is diagonal matrix whose diagonal elements
0
i
δ ≥ . Thus, the expression v=χδχT ≤0 can be
satisfied. Meanwhile, taking account into the bound of control voltage, thus, the control inputs are set as
m
msgn( ) m
i i
i
i i
V V V
V
V V V V
∗ ∗
∗ ∗
⎧ ≤
⎪
=⎨
>
⎪⎩ (23)
where subscript
i
denotes the ith control input voltage,i
V∗is the ith voltage computed by the controller, Viis the
actual voltage applied to the actuator, Vmis the bound of
the control voltage, sgn( )⋅ represents sign function. C. Kalman state estimator
Since the modal positions and velocities of the system are not directly measurable, a state observer may be employed to obtain the estimated states. The Kalman filter can provide an efficient way to estimate the state of a system, in a way that minimizes the mean of the squared error. Considering external disturbance and measurement noise, we can design a state estimator given the state-space model of the system shown in Eq. (8) by using Kalman technology.
Here, suppose the exogenous disturbance and measurement noise satisfy the following conditions
( )
( )
(
c T)
( )
Tc c d, n
E E
E E
= =
= =
N ν 0
N N Q νν R (24)
where E( )⋅ denotes the expected value of a variable, Qd,
n
R are covariance of the external disturbance and measurement noise, respectively. We can construct a state estimate Xˆc that minimizes the steady-state error
covariance
{
}{
}
(
ˆ ˆ T)
lim c c c c
t
P E
→∞
= X −X X −X
The optimal solution is the Kalman filter with the following state equations
(
)
c c c c in c c
c c
ˆ ˆ ˆ
ˆ ˆ
= + + − =
X A X B V L y C X
y C X
where the filter gain matrix L is determined by solving corresponding algebraic Riccati equation, yˆ are estimated value of y. The estimator uses the known inputs Vin and the measurements y to generate the
VI. EXPERIMENTAL INVESTIGATEION
In this section, we shall experimentally evaluate the effectiveness of the proposed control method in the vibration control of a flexible beam.
A. Experimental setup
1
A A2 A3
1
S S2
1
N N2 N3 N4 N5 N6 N7 N8
1
E
2
E E3 E4 E5 E6 7
E
Figure 3. Configuration of the elements and nodes, actuator and sensor,
N,E, A,S denote node, actuator, sensor, respectively
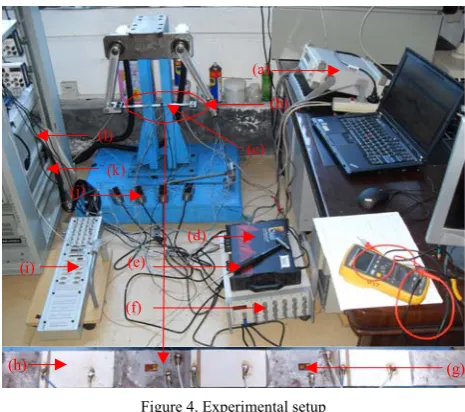
Figure 4. Experimental setup
(a) signal generator (b) cantilever beam (c) accelerometer (d) dynamic signal acquisition (e) hammer (f) dynamic strain gauge (g) strain gauge (h) piezoelectric patch (i) DS1103 connector panel (j) electric bridge
box (k) voltage amplifier (l) industrial computer
The length of the cantilever beam is 300 mm, its width and thickness are 20 mm, 1.5 mm, respectively. Its material is steel with elastic module, density and Poisson’s ratio 2100 GPa, 7800kg/m3, 0.3, respectively.
The beam is divided into 7 beam elements and 28 generalized coordinates shown as in the Fig. 3. The lengths of the elements are 50 mm, 40 mm, 40 mm, 40 mm, 40 mm, 40 mm, 50 mm, respectively. The symbolsN ,E , A ,S denote node, actuator, sensor,
respectively, in the Fig. 3. The actuators are made of PZT-5H piezoelectric ceramic, which its thickness is 0.5 mm, length is 40 mm and width is 20 mm, piezoelectric constantd31, elastic module and density is 200 10⋅ −12m/V,
1200 GPa, 7650 kg/m3, respectively. The sensors are
resistance strain gage. The configuration of the actuators and sensors are shown in Fig.3. The three pairs actuator bonded on the link are located at elementsE2, E4 andE6.
Two sensors S1 , S2 are located at the midpoint of
elements E3andE5. Three actuatorsA A A1, ,2 3 are located
at elementsE2, E4 and E6, respectively.
Fig. 4 illustrates the experimental setup that consists of a flexible beam bonded on PZT and strain gauge. By the way, the experimental device is also used to study the vibration control of high-speed 5-bar mechanism. As the bolt is tighten, the rotational pair becomes a fixed pair, that is, the flexible link can be considered as a cantilever beam. The high-speed analog input and output ports are provided with dSPACE DS1103. The electric amplifier made in Harbin core tomorrow science and technology Co., Ltd is used to drive piezoelectric patch. Resistance strain gauges are made in ZEMIC Co., Ltd, its type is BE120-3AA (11), the resistance is 120 Ω , and the sensitivity coefficient is 2.17. The strain gauge is connected to dynamic strain gauge through 1/4 electric bridge which is used to transform the strain signal to voltage.
B. Experimental modal test
Experimental modal analysis is a case of system identification where a priori model form consisting of modal parameters is assumed. Because it is hard to obtain damping ratio of structure by finite element method (FEM), the experimental modal test is a good method to get accurate natural frequency and damping ratio, which provide a basis for adjustment of the control model of the flexible structure. The setup of the experimental modal test is shown as Fig.4. Kistler 8690C50-type piezoelectric accelerometer is used as acceleration sensor. The ZonicBook/618E is the dynamic signal acquisition system. The eZ-Analyst software is real-time vibration analysis software equipped with a dynamic signal acquisition system which provides a real-time analysis capability in the frequency domain and time domain. ME’scopeVES software is used to be a post-processing test which is capable of analyzing mechanical and structural static and dynamic characteristics to obtain modal parameters.
Impulse hammer method is applied to perform experimental modal test. To excite the bending vibration, the cantilever beam was hit with a hammer at the specified excitation points. Using a hammer to produce a wide band of excitation, it can excite each mode in a wider frequency range. The locations of hammer and accelerometers are located at midpoints of element E3
and elements E1 ~E7 , respectively. A miniaturized
accelerometer PCB is sequentially placed at different locations. The tap position of the hammer is fixed, and the measurement points are 7 different positions. In order to eliminate measurement noise, the multiple measurements value of measurement point is averaged, the times of measurement is set to 5. The eZ-Analyst software is used to collect data of excitation point and all measurement points, to obtain the frequency response function of the measuring point, and then export the data format which ME’scopeVES can support. The ME’scopeVES software is used to identify the modal parameters of the flexible beam. The synthesis of the
(h) (g)
(f)
(b) (a)
(k)
(i) (j)
(c)
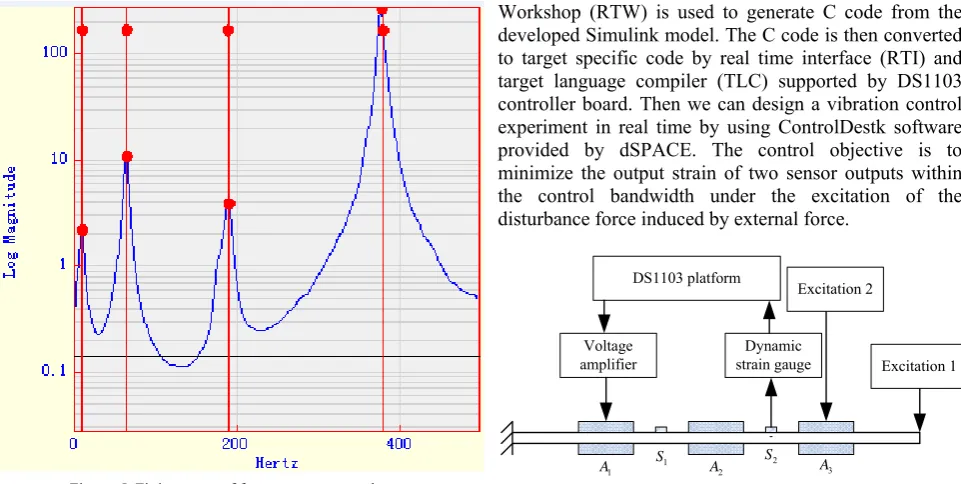
controller is based on a nominal model constructed by low-frequency modes. In the present case, the first four-order mode of the link is identified. The first four-four-order nature frequencies by using experimental identification and FEM are shown in Table 1, respectively, and the corresponding damping ratios are identified and tabulated in Table 1. As can be seen from the table, relative error of calculated and experimental values of natural frequency is close to 2-6 %, which indicates that the finite element model is not fully consistent in the actual system. That is to say, the model used to design controller is uncertain.
Figure 5. Fitting curve of frequency response data
TABLE I. THE FIRST FOUR-ORDER NATURAL FREQUENCY AND DAMPING RATIO
Mode order
Natural frequency (Hz) Relative
error Damping ratio (%) Calculation
value Experimental value
1 2 3 4
10.5 73.8 180.9 366.7
10.8 72.6 189.6
387.5
1.52 2.37 4.56 5.37
1.52 2.37 1.24 0.96
C. Experimental results
Schematic diagram of vibration control experiment is shown as Fig. 6. The principal of the vibration control is described as follows. When the exogenous disturbances are exerted on the beam, the vibration response will be generated. The output of the strain gage is given as input to the dynamic strain gauge which filters out the noise contents. The conditioned sensor signal is given as analog input card through the electric bridge connector box. The vibration signal measured by a sensor is transformed into a voltage signal by a dynamic strain transducer, and through a low-pass filter and an A/D converter, the analog voltage signal is converted into a digital signal to the dSPACE controller board. And the control voltage applied to actuator can be obtained through the designed
controller. As the control voltage from D/A port is relatively low, the voltage exerted on the piezoelectric patch must be amplified by the voltage amplifier to implement the vibration control. The control signal calculated by the dSPACE is converted into an analog signal by a D/A converter, and then is magnified 15 times by a voltage amplifier. Signals are then amplified and fed to a digital control system. The control algorithms are implemented using dSPACE DS1103 system with necessary Matlab/Simulink software installed in an industrial computer. The control algorithm is implemented using Simulink software and Real Time Workshop (RTW) is used to generate C code from the developed Simulink model. The C code is then converted to target specific code by real time interface (RTI) and target language compiler (TLC) supported by DS1103 controller board. Then we can design a vibration control experiment in real time by using ControlDestk software provided by dSPACE. The control objective is to minimize the output strain of two sensor outputs within the control bandwidth under the excitation of the disturbance force induced by external force.
1
A 1 A2 A3
S S2
Voltage
amplifier strain gaugeDynamic DS1103 platform
Excitation 1 Excitation 2
Figure 6. Schematic diagram of vibration control experiment
The objective in the experimental studies is to control the first three vibration modes. In order to generate the disturbance force exerted on the beam, we use the actuator A3 as excitation source. The actuators
1, 2
A A are applied to vibration control. The gain of the
dynamic strain gauge is set to 1000, the bridge voltage 6 V, cutoff frequency of filter is set to 100 Hz. The sampling frequency of analog input and output port is set to 1000 Hz. The covariance of measurement noise is estimated as 10−4. The sampling period of the controller
is 1 ms. The real-time control time is set to 1 s. The
diagonal matrix δ in Eq. (22) is
3 3 3
diag(2 10 ,2 10 ,2 10 )
= ⋅ ⋅ ⋅
δ . The schematic diagram of
the feedback control system is depicted in Fig. 6. In order to experimentally investigate the control performance, the two excitation sources are exerted to the cantilever beam, respectively. The first excitation source called excitation 1 is the free-vibration one by taping instantly the free end of the beam. The second excitation source named as excitation 2 is the forced one by applying a voltage to the piezoelectric ceramic patch A3. The excitation voltage is
noise signal, amplified by voltage amplifier. And the covariance of the excitation signal is set to 120 V.
As we design the Kalman state estimator, the parameters are set as Qd=100,Re=
3
1 10× − . In order to
validate that the proposed estimator can effectively estimate the state values, we will carry out the following test. As the actuator A3is applied to a sinusoidal signal,
we compared the measured values and estimated values of output strain from sensor S1 and sensor S2 . The
sinusoidal signal is generated by the signal generator, and is amplified by voltage amplifier, its amplitude 120 V, frequency 75 Hz, which the frequency is close to the second order natural one of the system to make the beam vibrate significantly. Figure 7 and Fig. 8 denote the measured values and estimated values of output strain from sensor S1and sensorS2. From the two figures, we
can observe the measurement values are coincide with estimated values of output strain to illustrate the effectiveness of the estimator.
0 0.2 0.4 0.6 0.8 1
-0.04 -0.02 0 0.02 0.04
Time (s)
St
ra
in
1
measurement value
estimated value
Figure 7. Measuremetn and estimated values of output strain from sensor S1
0 0.2 0.4 0.6 0.8 1
-0.06 -0.04 -0.02 0 0.02 0.04 0.06
Time (s)
St
ra
in
2
measurement value
estimated value
Figure 8. Measuremetn and estimated values of output strain from sensor S2
0 0.2 0.4 0.6 0.8 1
-3 -2 -1 0 1 2 3
x 10-3
Time (s)
St
ra
in
1
w ith controller
w ithout controller
Figure 9. Strain from sensor S1 in two cases of without controller and
with controller under the excitation 1
0 0.2 0.4 0.6 0.8 1
-6 -4 -2 0 2 4
6x 10
-3
Time (s)
St
ra
in
2
w ith controller
w ithout controller
Figure 10. Strain from sensor S2 in two cases of without controller and
with controller under the excitation 1
0 0.2 0.4 0.6 0.8 1
-0.03 -0.02 -0.01 0 0.01 0.02 0.03
Time (s)
St
ra
in
1
w ith controller
w ithout controller
Figure 11. Strain from sensor S1 in two cases of without controller and
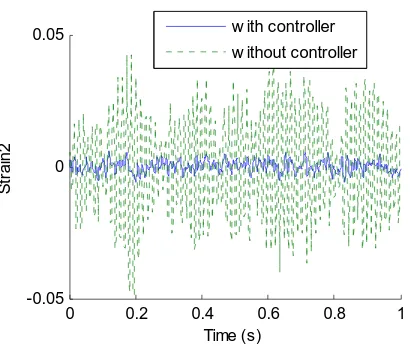
0 0.2 0.4 0.6 0.8 1 -0.05
0 0.05
Time (s)
St
ra
in
2
w ith controller
w ithout controller
Figure 12. Strain from sensor S2 in two cases of without controller and
with controller under the excitation 1
Figure 9 and Fig. 10 show the strains of the flexible link from sensor S1 and S2 in two cases of without
controller and with controller under the excitation 1, respectively. Figure 11 and Fig. 12 show the strains of the flexible link from sensor S1 and S2 in two cases of without
controller and with controller under the excitation 2, respectively. In these figures, solid line represents the strains in case of with controller, and dotted line denotes the strains in case of without controller. By the contrast to the results of Fig. 9 and 10, it can be observed that the strains generated by the first excitation source from sensor S1 and S2 are remarkably reduced under the case
where sliding mode controller is adopted. Comparing the experimental results of Fig. 11 and Fig. 12, it can be seen that the strains caused by the second excitation source from sensor S1 and S2 can also be inhibited greatly in the
case of with controller. Thus, it is concluded that the proposed controller is effective to suppress the vibration response of the flexible beam.
V. CONCLUSION
The vibration control of a smart flexible beam has been investigated by applying sliding mode control. The sliding surface is determined by constructing a linear quadratic optimization problem, and Lyapunov direct method is used to design the sliding controller based on the Lyapunov asymptotic stability condition. The Kalman filter is applied considering uncertain disturbance and measurement noise. And the effectiveness of the proposed estimator was proved by comparing the measured and estimated values of the output strains. The experimental results have been showed that the proposed controller is valid to suppress the vibration response of the flexible beam. And it has been shown that the proposed controller guaranties robust performance.
ACKNOWLEDGMENT
This work was supported by National Natural Science Foundation of China (Grant No. 50965007).
REFERENCES
[1] S.B. Choi, “Active structural acoustic control of a smart plate featuring piezoelectric actuators,” Journal of Sound and Vibration, vol. 294(1-2), pp. 421-429, 2006.
[2] K. Ma, “Adaptive nonlinear control of a clamped rectangular plate with PZT patches,” Journal of Sound and Vibration, vol. 264(4), pp. 835-850, 2003.
[3] K. Ma, M. N. Ghasemi-Nejhad, “Frequency-weighted adaptive control for simultaneous precision positioning and vibration suppression of smart structures,” Smart Materials and Structures, vol. 13(5), pp. 1143–1154, 2004.
[4] G. L. C. M. Abreu, J. F. Ribeiro, and V. Steffen, “Experiments on optimal vibration control of a flexible beam containing piezoelectric sensors and actuators,”
Shock and vibration, vol. 10, pp. 283–300, 2003.
[5] Y. Y. Li, L. H. L. Yam, “Roubust vibration control uncertain systems using variable parameter feedback and model-based fuzzy strategies,” Computers and Structures,
vol. 79, pp. 1109–1119, 2001.
[6] P. Mayhan, G. Washington, “Fuzzy model reference learning control: a new control paradigm for smart structures,” Smart Mater. Struct., vol. 7, pp. 874-884, 1998.
[7] X. M. Zhang, C. J. Shao, and A. G. Erdman, “Active vibration controller design and comparison study of flexible linkage mechanism systems,” Mechanism & Machine Theory, vol. 37, pp. 985-997, 2002.
[8] X. M. Zhang, C. J. Shao, and S. Li, et al., “Robust
H∞ vibration control for flexible linkage mechanism
systems with piezoelectric sensors and actuators,” Journal of Sound and Vibration, vol. 243(1), pp. 145-155, 2001.
[9] H. Kawabe, N. Tsukiyama, and K. Yoshida, “Active vibration damping based on neural network theory,” Materials Science and Engineering A, vol. 442, pp.
547-550, 2006.
[10]C. Y. Liao, C. K. Sung, “An elastodynamic analysis and control of flexible linkages using piezoceramic sensors and actuators,” Transactions of the ASME, vol. 115, pp.
658-665, 1993.
[11]L. Iorga, H. Baruh, and I. Ursu, “A Review of H∞robust
control of piezoelectric smart structures,” Appl. Mech. Rev.,
vol. 61(4), pp. 1-16, 2008.
Junfeng Hu Jiangxi Province, China.
born in 1978. He is Engineering Ph.D., graduated from South China University of Technology. His research interests include mechanical dynamics, smart structure and active vibration control. He is currently a lecturer in School of Mechanical & Electrical Engineering, Jiangxi University of Science and Technology, China.
Dachang Zhu, Jiangxi Province, China,