ISSN (e): 2250-3021, ISSN (p): 2278-8719
Vol. 06, Issue 04 (April. 2016), ||V2|| PP 06-12
Correlation among Salinity Concentration and Intrusion Length -
an Estuary Study
M.M.Prabhakaran
1, G.Resmi
21Research Scholar, CED, Karpagam University, Coimbatore, (India)
2
Professor, CED, NSS College of Engineering, Palakkad, (India)
Abstract: The River Periyar was seriously affected by strong salinity intrusion and the drinking water supply to the area was continuously threatened in recent years. To solve the salinity intrusion problem, the Water Resources Department has released fresh water from upstream several times. The salinity intrusion in recent years is getting more active and the intensity is getting stronger, this paper analyzes to bridge a relationship between the salinity concentration and the salinity intrusion length in the Periyar River Estuaries. Based on the analysis, this paper proposes a model for Periyar River Estuaries to take precautionary measures for preventing the salinity intrusion to ensure the safety of water supply and related development of water resources. The salinity intrusion length was computed based on the measure of freshwater discharge, and topographic effects. An association between's the saltwater intrusion length at the Periyar River, the freshwater discharge rate was imparted using an observational scientific proclamation. Salinity intrusion length was worked out using Brockway model (2006) and Byuing II Yoon model (2013) and found that the intrusion length was inversily proportional to the estuarine river discharge. The two mathematical models utilized were evaluated to opt on the best suitability. A relationship was developed between the concentration of salinity and salinity intrusion length and was ascertained its strength using regression analysis.
Key words: - Correlation, empirical model, estuaries, evaluation, intrusion length, Periyar River, salinity
intrusion
I.
INTRODUCTION
Estuaries, where fresh water from rivers mixes with salt water from the oceans, are among the most productive environments on Earth. The estuary is not a part of the coast but is a coastal feature with a continuous exchange of water between land and the sea [2]. The intrusion of seawater in estuaries is an interesting phenomenon which occurs naturally and affects the quality of the water for different purposes [5]. In addition to morphological characteristics of an estuary, salinity intrusion depends strongly on the salinity difference between sea and river water and the amount of riverine flow [1], [4]. Combinations of above factors determine the mixing mechanism in an estuary and the salinity intrusion length [5]. Salinity intrusion may decrease the estuarine water quality so that its water becomes unsuitable for some uses such as drinking and agricultural purposes. Therefore determination of the salinity distribution along an estuary is a main interest for water engineers in coastal regions. Since the physical modelling of seawater intrusion in an estuary is time-consuming and expensive, it is preferred to use tools like emperical models [5]. This paper deals with such an attempt of Periyar estuaries in Kerala. The Periyar estuaries have free connections with the Arabian Sea is the most important water resource for Kochi City, the commercial capital of Kerala. Along this estuary some intake stations have been made to supply various water needs and it is important to keep the water salinity below a certain level at these intake stations. Here for Kochi City, the intake point situates at Aluva.
The initial studies for this work have been carried out using both Numerical Analysis and Harleman Emperical Model [9]. This was explained in our earlier papers [6], [7], [8]. The aims of this paper are:
(1) Determination of riverine flow discharge for different salinity concentrations, to keep the salinity under a certain level at the intake station that is located about 20 km from the estuaries.
(2) Determination of relationship between salinity concentration and the salinity intrusion length; and formulation of an emperical model in regard to Periyar River Estuaries.
positive result by correlating the Salinity concentration at Aluva and the salinity intrusion length. The study was conducted during summer and lean flow period. The bridging has been successfully carried out and the relationship between the variables was found as linear.
II.
STUDY AREA
Periyar River estuaries, located in the central-west of Kerala are one of the main inland waterways in Kerala. The back water of this portion is known as Venbanad Kayal. It has a length of 96.5Km and 14Km width with an average area of 2033 Sq.Km. The first upstream dam of the estuary is Bhoothathankettu. The averaged cross-sectional area, width and depth of Periyar estuary are about 3980 m2, 920 m and 4.2 m respectively. The annual average discharge through the estuaries is noted as 206 m3/sec. During dry season, usually in summer, when the Periyar discharge is very low, the salinity intrusion influences the drinking water production, even though the intake is more than 20 km upstream of the estuary. However, under different riverine flow, depth of water and salinity concentrations, water surface elevation and water quality of Periyar River along its entire course are strongly affected. As the salinity in Periyar River estuaries is high in its initial portions, it is not suitable for agricultural use and also affecting the intake of drinking water source at 20 km upstream. The salinity of the Periyar estuaries varies between 2000 and 4500 mg/l, with maximum salinity of 4500mg/l [4].
III.
METHOD OF STUDY
Mr.Savaniji, a famous researcher in the field of estuaries discharges, from DELFT, Netherlands have carried out practical studies and established Models. In 2005, Mr.Savaniji has studied about 43 rivers all over the world and established an emperical relationship. Based on these studies, another researcher named Mr. Brockway from Washington University in 2006, has developed an emperical Model [3] which is easier and giving axial mixing which is more suitable for the analysis of drinking water sources.
Table 1 Flow and Salinity Intrusion length
Mon
2008 2009 2010
Fresh Water Discharge, Q
Salt Water Intrusion Length, XL in Km
Fresh Water Discharge, Q
Salt Water Intrusion Length, XL in Km
Fresh Water Discharge, Q
Salt Water Intrusion Length, XL in Km
Jan 13.24 50.56 3.48 50.93 18.66 50.56
Feb 6.76 52.23 6.00 53.76 20.93 53.77
Mar 13.42 48.11 3.70 48.10 26.38 48.11
Apr 31.91 46.87 20.57 49.95 23.17 50.78
May 68.84 43.58 36.05 43.62 35.78 42.56
Jun 212.96 24.17 402.44 24.39 353.18 24.17
Jul 475.88 22.55 1660.86 22.53 511.99 22.60
Aug 489.34 21.10 994.38 23.71 422.89 23.48
Sep 1069.91 22.24 1879.00 22.53 329.60 13.77
Oct 303.12 26.07 308.85 32.20 597.44 32.23
Nov 256.17 29.17 214.07 34.53 375.39 34.92
Dec 15.61 43.40 46.00 40.80 149.32 40.67
Table 2 Computation of Salinity Intrusion Length for Periyar Estuaries using the Emperical Relationship - on the basis of Byung-II
2008 2009 2010
Discharge , Q in m3/sec
Intru.Len gth, L in Km
Discharge , Q in m3/sec
Intru.Len gth, L in Km
Discharge , Q in m3/sec
Intru.Len gth, L in Km
13.24 51.57 3.48 64.72 18.66 48.64
6.76 57.81 6.00 58.99 20.93 47.70
13.42 51.45 3.70 64.05 26.38 45.86
31.91 44.40 20.57 47.85 23.17 46.89
68.84 38.96 36.05 43.49 35.78 43.55
212.96 25.32 402.44 22.73 353.18 23.24
475.88 22.09 1660.86 17.86 511.99 21.82
489.34 21.98 994.38 19.49 422.89 22.54
1069.91 19.25 1879.00 17.49 329.60 23.51
303.12 23.85 308.85 23.77 597.44 21.25
256.17 24.54 214.07 25.30 375.39 23.00
15.61 50.15 46.00 41.73 149.32 34.16
By 2013 another researcher, named Mr.Byung II has developed a relationship between the salinity intrusion length and river discharges through the estuaries. The Discharge verses Salinity intrusion length for the year 2008, 2009 and 2010 are computed [10] and tabulated below vide TABLE 2.
The salinity intrusion length was worked out using Byung II Model vide TABLE 2 for the years 2008, 2009 and 2010 and found that the results obtained are matching with the values obtained through Brock way Model. It is also revealed that the salinity intrusion length is inversely proportional to the fresh water discharges through the estuaries. Strength between the variables were worked out and found a good relationship between the variables. The coefficient of correlation found as more than 0.9 in all cases except during monsoon, which is not considered in this study on practical point of view.
As both the methods, Brockway Model and the Model formulated based on the Byung II Model are seen able to provide good results for the Periyar estuaries, it is now decided to compare the results of both and to ascertain its strength. The linear regression analysis is used as the tool for correlating between the values of intrusion lengths obtained for same discharges for both methods. The emperical relationship formulated shows a good relationship among its variables. The coefficient of correlation is obtained as 0.9 in all cases except during monsoon.
IV.
BRIDGING OF SALINITY CONCENTRATION AND SALINITY INTRUSION
LENGTH
Fig. 1 Comparison of Intrusion Length and Salinity at Aluva -2009
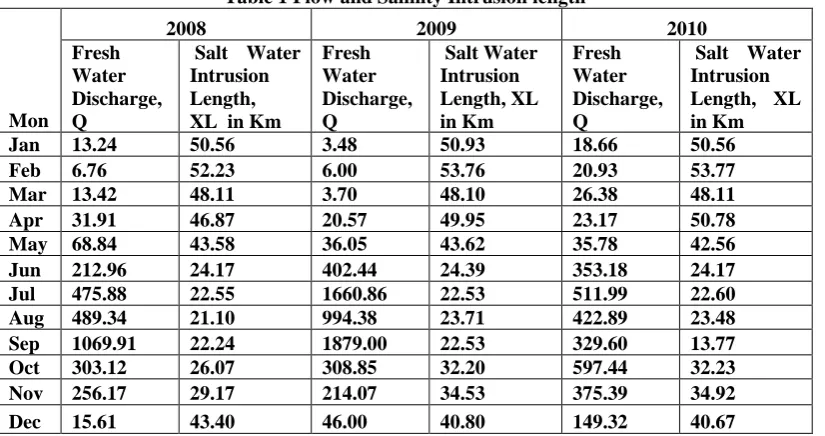
During December month the salinity concentration was 67mg/lit in 2009 and 72mg/lit in 2010 whereas the salinity intrusion lengths were 41km and 36 km respectively. In both years during January month, the salinity concentration was increased to 95 mg/lit and 99 mg/lit respectively. The intrusion length recorded for the year 2009 as 65km and for 2010, it was 49km. During 2009 the maximum salinity recorded in the month of March when the lean flow was occurred, whereas the maximum salinity concentration measured during 2010 was in February, when the lean flow was noticed during the year. In both years the salinity concentration was receeded from April month and the minimum recorded during the monsoon period for further increasing the concentration of salinity after monsoon. The salinity was seen increased gradually from September when the summer season starts. In other words, the salinity rate was seen a gradual increase from the reduction in fresh water discharges. The values and type of graph clearly indicates that the salinity intrusion length is directly proportional to the salinity concentration, which is inversely proportional to the fresh water discharges. The Fig. 1 and Fig. 2 depicts the relation between salinity concentration, the intrusion length and also the period of flow.
Fig. 2 Comparison of Intrusion Length and Salinity at Aluva -2010
The obtained values have been compared with the salinity measured at a particular distance near the intake for Kochi Water Supply Scheme. A relationship has been formulated for this and is tested the results in other years. The work was based on Byung II, Model.
4.1 Analysis of Test Results
The works for establishing the relationship of salinity concentration at Aluva and the salinity intrusion length was computed and the results were evaluated for the generalisation purpose using linear regression analysis.
0 20 40 60 80 100 120
Dec Jan Feb Mar Apr May Jun Jul Aug Sep Oct Nov
S
a
li
n
ity
a
n
d
In
tr
u
sio
n
Le
n
g
th
in
K
m
Bridging Intrusion Length with Salinity - 2009
Salinity at Aluva in mg/l
Intrusion Length, L
0 20 40 60 80 100 120
Dec Jan Feb Mar Apr May Jun Jul Aug Sep Oct Nov
Sa
lin
it
y
a
nd
I
ntr
us
io
n
leng
th
in K
m
Bridging Intrusion Length and Salinity - 2010
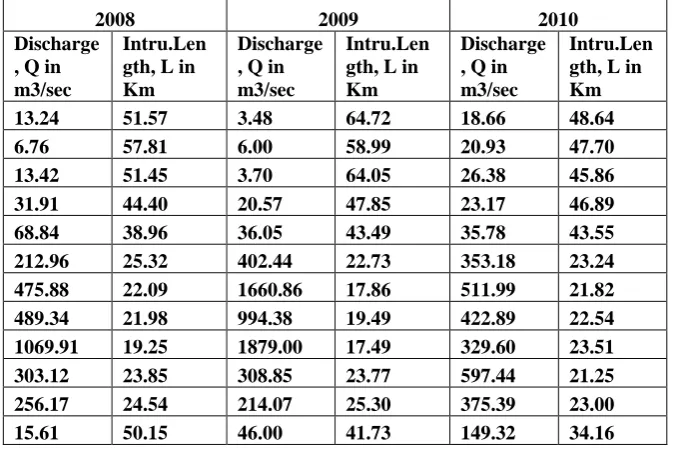
Linear Fit: y=a+bx. In the linear fit, the flollowing values were obtained as coefficients and constants for further use.
Coefficient Data: a = -3.003229, b = 0.3985609; Standard Error, S= 5.9930778 Correlation Coefficient = 0.9027434; Coefficient of Determination = 0.81495
Fig. 3 Relation between Salinity and Salinity Intrusion Length Test for 2009 at Aluva
Fig. 4 Relation between Salinity and Salinity Intrusion Length Test for 2010 at Aluva
Accordingly, the generalised relationship noted as Y = -3.003229 + 0.3985609 X. It is decided to test the emphirical relationship for further uses.
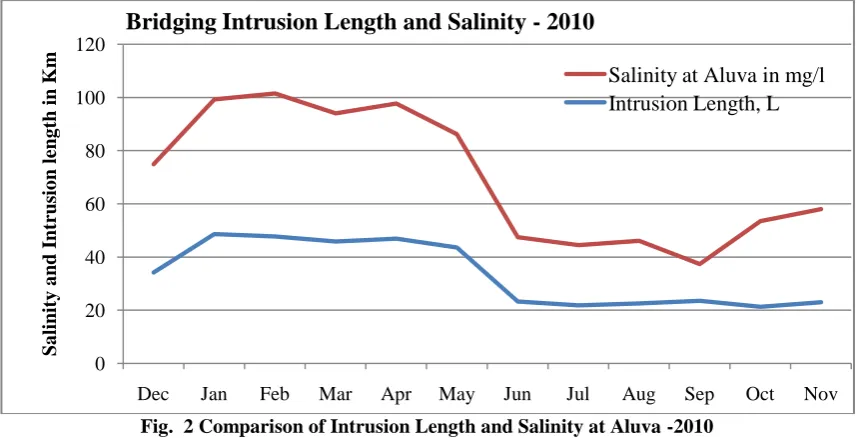
The obtained relationship has been analysed and examined for another two years, before placing it for a general test work to obtain its strength and validity through the values obtained using Brockway Model. The relationship between the Intrusion length obtained using the Brockway Model and the relationship developed between the intrusion length and Salinity Concentration depicts through Fig. 3and Fig. 4 for the year 2009 and 2010
4.2 Testing the Emperical Relationship
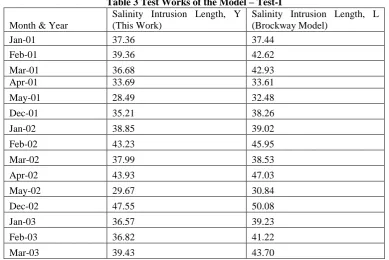
The developed Relationship has been tested for 120 cases spreaded over ten years to verify its validity and its further use for general purposes. Comparison of Intrusion Length obtained using the Model derived for this work and the Intrusion length obtained based on the Brockway Model has been worked out and tabulated in TABLE 3.
0.00 20.00 40.00 60.00 80.00 100.00 120.00
1 2 3 4 5 6 7 8 9 10 11 12
S
a
li
n
ity
in
m
g
/l
a
n
d
in
tr
u
.len
g
th
in
K
m
Period
Test -1 Salinity and Intrusion Length- 2009
Salinity at Aluva in mg/l
Intrusion Length, L
0.00 20.00 40.00 60.00 80.00 100.00 120.00
Dec Jan Feb Mar Apr May Jun Jul Aug Sep Oct Nov
Sa
lin
it
y
m
g
/l
a
nd
intr
u.leng
th
in k
m
Test-2 Salinity and Intrusion length -2010
Salinity at Aluva in mg/l
Table 3 Test Works of the Model – Test-I
Month & Year
Salinity Intrusion Length, Y (This Work)
Salinity Intrusion Length, L (Brockway Model)
Jan-01 37.36 37.44
Feb-01 39.36 42.62
Mar-01 36.68 42.93
Apr-01 33.69 33.61
May-01 28.49 32.48
Dec-01 35.21 38.26
Jan-02 38.85 39.02
Feb-02 43.23 45.95
Mar-02 37.99 38.53
Apr-02 43.93 47.03
May-02 29.67 30.84
Dec-02 47.55 50.08
Jan-03 36.57 39.23
Feb-03 36.82 41.22
Mar-03 39.43 43.70
The salinity intrusion length obtained through the Emperical Model derived for this work was compared with the intrusion length obtained through the Brockway Model, which described in Table 3. The relationship was again validated through regression analysis and its validity was checked. A strong relationship among the results for the same flow and concentration of salinity with a strong Coefficient of Correlation, r as 0.940 and a Coefficient of Determination r2 = 0.884.
The second series of test was conducted with fifteen sets of results. The second set of test also shows a very good relation between the values obtained through the derived relationship and the Brockway Model. It is noticed that a strong relationship between the results for the same flow and concentration of salinity with a strong Coefficient of Correlation, r as 0.936 and a Coefficient of Determination r2 as 0.876.
Further, a third series of test was conducted from the data between January 2006 and March 2008. The derived emperical relationship was compared with the Brockway model to check its compatibility. The tests were carried out using regression analysis method, in which the Coefficient of Correlation, r is 0.963 and the Coefficient of Determination r2 is 0.927 shows a good relationship.
Again, a fourth series of tests were carried out using the data from April 2008 to December 2010 in the same manner as it was conducted for 1st, 2nd and 3rd series. The developed model has responded positively when it was compared with Brockway Model. The validity and veracity was tested using regression analysis, which has given good results. The Coefficient of Correlation, r found to be as 0.719 and the Coefficient of Determination r2 computed as 0.517reveals a good relationship between the variables.
V.
CONCLUSION
1. The Salinity Intrusion length was computed using Brockway Model and Byung II Model and compared the results, found good relationship among them.
2. The Brockway Model was tested using the measured Salinity to obtain the Salinity Intrusion Length and the results were compared with the intrusion length computed using the Emperical relationship formulated based on the Byung II Model.
3. The intrusion lengths obtained by the developed Emperical relationship and the Brockway model are correlated and found the correlation coefficient as 0.935 and Coefficient of Determination as 0.874
4. The Emperical relationship developed between salinity concentration and the salinity intrusion length provides good strength in regard to Periyar River Estuaries.
REFERENCES
Journal[1] Prabhakaran.M.M. and G Resmi. 2013 Significance of Estuary Discharges in Controlling Salinity - A Case Study on Kochi Water Supply Scheme, International Journal of Advance Research in Science &
Engineering - ISSN - 2319-8354 IJARSE, Vol. No.2, Issue No. 9, September 2013
[2] Wen-Cheng Lia, 2007. Modeling the influence of river discharge on salt intrusion and residual circulation in Danshuei River estuary, Taiwan. Elsevier, Science Direct, Continental Shelf Research 27 (2007) 900 921.
[3] Brockway, et al., 2006. A note on salt intrusion in funnel-shaped estuaries: application to the Incomati estuary, Mozambique. Estuarine, Coastal and Shelf Science, 66, 1-5.
[4] Prabhakaran.M.M. and G Resmi, 2013, Periyar River Flow and Kochi Water Supply Scheme- A Comparison of Mass Balance and Measured Values, International Journal of Geology, Earth and
Environmental Sciences - ISSN - 2277-2081, Vol. 3 (2) May – August 2013, pp 153-161/Prabhakaran and
Resmi
[5] Byung Il Yoon and Seung-Buhm Woo, 2013. Correlation between freshwater discharge and salinity intrusion in the Han River Estuary, South Korea. Journal of Coastal Tesearch, Special Issue No.65, 2013 pp 1247-1252.
[6] Prabhakaran.M.M. and G Resmi. 2015 Assessment of Salinity Intrusion Through Periyar River Estuaries, International Journal of Advance Research in Science & Engineering - ISSN - 2319-8354 IJARSE, Vol.
No.4, Issue No. 10, October 2015
[7] Prabhakaran.M.M. and G Resmi. 2015 Study of Salinity Intrusion through Estuaries of Periyar River using an Emperical Model, International Journal of Engineering and Technology (IJERT) - ISSN -
2278-0181, Vol. No.4, Issue No. 12, December 2015
[8] Prabhakaran.M.M. and G Resmi. 2016 Evaluation of Salinity Intrusion through Periyar River Estuaries using Mathematical Models, International Journal of Engineering and Technology (IJERT) - ISSN -
2278-0181, Vol. No.01, Issue No. 01, January 2016
Books
[9] Metcalf and Eddy, 1990. Waste Water Engineering Treatment Disposal Reuse, Revised by George Techobanoglous, TATA McGraw-Hill by, second edition.(VOL II) ,1990.
Proceedings