ISSN (e): 2250-3021, ISSN (p): 2278-8719 Vol. 04, Issue 06 (June. 2014), ||V3|| PP 05-10
An algorithm to separate touching grains based on Fourier series
Approximation
S. B. Ghadge, A. R. Sarkar
Abstract: - An algorithm based on Fourier series approximation is proposed for separating touching grain kernels. The algorithm starts with image acquisition of wheat grain samples in group of two, three, and four as a first step. Then pre-processing techniques are applied to threshold the required region and make the image smoother, and also to find the boundary points. Pre-processing is followed by chain coding where freeman coding is used to get the connected components and given to Fourier approximation for getting boundary contours. Curvature analysis is done to get the corner points. Then possible potential node pairs are found by using radical critical distance. Nearest neighbors among corner point is calculated by finding pair-wise distance among all possible nodal points. From potential pairs, true pairs are selected based on nearest neighbor distance criteria. Finally Bresenham’s line drawing algorithm is used to draw segmentation line. The algorithm is successful in separating most of touching grain kernels.
Index terms: - Fourier series, Grain separation, Curvature analysis, nearest neighbor
I. INTRODUCTION
Since long time grains are part of human diet which are the rich sources of carbohydrate package fiber, healthy fats, vitamins, minerals, plant enzymes, hormones.
So determining grain type and quality is of paramount importance. Despite technological advances in the transportation and handling of grain, the analysis of quality attributes and grading of grain is still performed manually by skilled personnel (Lou, Jayas, & Symons, 1999). Manual analysis of grains is prone to many problems: (i) it is highly immanent and is affected by human factors and working conditions (Zhang, Jayas, & White, 2005); (ii) the rate of cleaning and recovery of salvages is limited; and (iii) human sense can easily be influenced by external factors (Francis, 1980) resulting in grading inconsistencies.
So, there is need of machine vision system (MVS) which will evaluate quality, without any grading inconsistencies, and for monitoring and handling grain operations. It implies that a system is needed to automatically cleaning and separation of grains which will be able to apply evaluation criteria consistently and objectively and without any tiredness. MVS is defined as the use of devices for optical, non-contact sensing to automatically receive and interpret an image of a real scene in order to obtain information and/or control machines or processes.
Machine Vision Systems are gaining popularity in many areas for applications like classification of rice grains (Chathurika Sewwandi Silva, and Upul Sonnadara, 2013), handling grains (Neeraj Singh Visen, 2002), classification of cereal grains (J. Paliwal, M.S. Borhan and D.S. Jayas, 2004), also for automatic quality and grading of fruits (J. Blasco, N. Aleixos, and E. Molto, 2003), for automatic grading machine for oil palm fresh fruits bunches (Muhammad Makky, Peeyush Soni, 2013), date fruit grading system (Yousef Al Ohali, 2011), inspection and grading of agricultural and food products (Tadhg Brosnan, Da-Wen Sun, 2002). Also by classification based on measurements of morphological, optical and textural features of various grain types (Samir Majumdar, 1997), (A. Douik, M. Abdellaoui, 2010), and for particular grains types such as wheat (Neuman, Sapirstein, Shwedyk, & Bushuk, 1987; Paliwal, Shashidhar, & Jayas, 1999, 2003), rice (Yao, Chen, & Guan, 2009,274e279 p.), corn (Paulsen, Wigger, Litchfied, & Sinclair, 1989), lentils (Shahin & Symons, 2003), and paddy ( S. F. Lilhare, N G Bawane, 2012) has been reported. A number of studies have been conducted to classify grains based on their physical attributes (Paliwal et al., 2003, 1999).
Meesters, J.A.M. Kenter, W. Schlager (2000). The new algorithm for separation detects the characteristic sharp wedges when grain sections touch and evaluates them for possible starting points of separation lines. These include the use of morphological operations (Shatadal, Jayas, & Bulley, 1995), an ellipse-fitting algorithm (Zhang et al., 2005), a concavities based algorithm (Visen, Shashidhar, Paliwal, & Jayas, 2001), watershed segmentation (Wang & Paliwal, 2006) and a combined watershed and concavity algorithm (Zhong et al., 2009). However, these algorithms had certain drawbacks: (i) the morphological operations failed to correctly segment when groups of touching kernels formed relatively longer chains; (ii) the concavity algorithm was prone to oscillations and was only successful to separate a maximum of three touching kernels (Visen et al., 2001); (iii) the ellipse-fitting algorithm proposed by Zhang et al. (2005) was restricted to two touching kernel scenarios and its search for fitting ellipses was time consuming; (iv) the watershed algorithm was prone to over segmentation and failed to segment elongated grains despite significant improvements by reconstructing internal markers through a series of morphological operations (Wang & Paliwal, 2006); and (v) the procedure which combined watershed and concavities algorithms was very lengthy. Hence, all-round and robust touching grain segmentation algorithms are still needed. In this respect, an efficient separation algorithm based on the Fourier series approximation and the calculation of curvature values is proposed. The Fourier approximation ensures perfect smoothness such that all derivatives exist and are continuous. The abrupt changes in the curve are detected as corner points. In an ideal situation, when the touching objects have smooth boundaries, all negative curvature values define corner points. However, if the kernels are broken or have rough boundaries, pseudo corner points may be detected. To avoid such pseudo corner points, a threshold curvature value has to be defined. In this study, a threshold value (.28, .3) avoided the surface roughness effects. The objective of this research, therefore, is to develop an algorithm that separates multiple touching grains kernels.
II. RESEARCH ELABORATION
2.1. Image Acquisition
Images are taken from Rapid-I machine under fluorescent light of 36 watts, of dimensions 800×600, width 800 pixels, height 600 pixels, horizontal resolution 96 dpi, vertical resolution 96 dpi, at bit depth of 24.
2.2. Grain samples:
The grain samples were taken of wheat available in the market. Available sample is of type Gujarati No. 1. The wheat grains were manually placed in clusters of two, and three, grains. The images are taken after manually placing them in touching fashion.
2.3. Image pre-processing:
The image is converted to binary image and threshold to make image and open area smoother. Boundary point is found. Boundaries are cleared. The image processing and boundary clearing is done in Matlab R2009b.
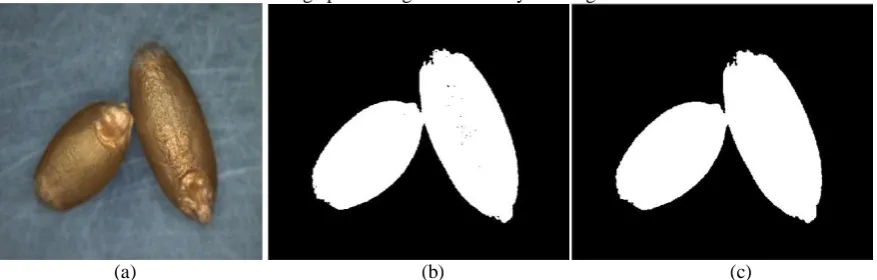
(a) (b) (c)
Fig 1. (a) Input image with two wheat grains touching each other (b) Binary image of input image (c) Pre-processed image from binary image.
2.3 Chain coding
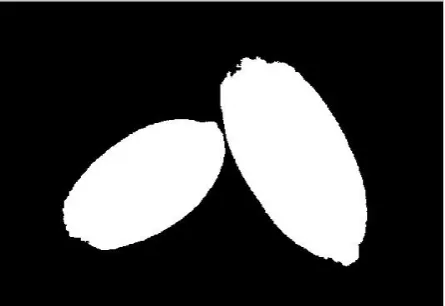
Fig 2: Grains with boundary traced chain coded (red color).
2.4 Fourier series approximation:
The Fourier approximation ensures perfect smoothness such that all derivatives exist and are continuous. Fourier descriptors refers to the utilization of Fourier analysis, primarily the Fourier series as a curve fitting technique, that can numerically describe the shape of irregular structures such as are commonly found in living organisms. The quantitative characterization of irregular forms is often the first step toward elucidation of the underlying biological processes, whether they are genetic, evolutionary, or functional. The elliptical Fourier method is primarily an analytical means to represent a curve as a function, and it makes use of geometry of a form only indirectly via approximation of the overall shape as an ellipse used to orient the representation, which then allows for a rotation, translocation, and redefinition of the initial point to remove coordinate-system dependency. Fourier approximation is represented as equation in of (x, y) point in the form of third variable (t). Based on discrete Fourier series approximation Fourier coefficients are calculated for chain-coded boundary contours. Chain code of is started from a pixel as a reference point and chain code completes when the reference point is reached (Mebatsion and Paliwal, 2011). The elliptic Fourier series approximation of closed contour projected on the x and y-axis can be defined as follows (Hiraoka & Kuramoto, 2004; Neto, Meyer, Jones, & Samal, 2006):
𝑥𝑁 𝑡 = 𝐴0+ 𝑎𝑛𝑐𝑜𝑠 2𝑛𝜋𝑡
𝑇 𝑁
𝑛=1 +𝑏𝑛𝑠𝑖𝑛 2𝑛𝜋𝑡
𝑇
(1)
𝑦𝑁 𝑡 = 𝐶0+ 𝑎𝑛𝑐𝑜𝑠 2𝑛𝜋𝑡
𝑇 𝑁
𝑛=1 +𝑑𝑛𝑠𝑖𝑛 2𝑛𝜋𝑡
𝑇
where t is the step required to move a unit pixel along the closed contour, such that tp_1 < t < tp for values of p within the range of 1≤ p ≤ K. N is the number of Fourier harmonics and K is the total number of chain-coded points. A0 and C0 are coefficients corresponding to the frequency 0. If the contour between the (i-1) th and the ith chain-coded points is linearly interpolated and the length of the contour from the starting point to the pth point and the perimeter of the contour are denoted tp and T, respectively, then
𝑡𝑝= ∆𝑡𝑖 𝑝
𝑖=1 (2)
T is the basic period of the chain code, which is the overall step to traverse the entire contour, T= tk, where Δti is the distance between the (i-1) th and the ith points. The Kth point is equivalent to the starting point. If the x-coordinate of the pth point is denoted by xp, then,
𝑥𝑝= ∆𝑥𝑖 𝑝
𝑖=1 , and
𝑦𝑝 = 𝑦 𝑝
𝑖=1 , (3)
where Δxi and Δyi are the distances along the x and y axes between (i-1) th and the ith point. Assuming linear interpolation between the neighbouring points, the elliptic Fourier coefficients in Eq. (1) of the nth harmonic (an; bn; cn and dn) can be calculated using the following equations (Hiraoka & Kuramoto, 2004; Iwata, Niikura, Matsuura, Takano, & Ukai, 1998; Neto et al., 2006):
𝑎𝑛 = 𝑇 2𝑛2𝜋2
∆𝑥𝑝 ∆𝑡𝑝 𝑐𝑜𝑠
2𝑛𝜋 𝑡𝑝
𝑇 − 𝑐𝑜𝑠 2𝑛𝜋 𝑡𝑝 −1
𝑇
𝐾
𝑝=1
𝑏𝑛= 𝑇 2𝑛2𝜋2
∆𝑥𝑝 ∆𝑡𝑝 𝑠𝑖𝑛
2𝑛𝜋 𝑡𝑝
𝑇 − 𝑠𝑖𝑛 2𝑛𝜋 𝑡𝑝 −1
𝑇
𝐾
𝑝=1 (4a)
𝑐𝑛= 𝑇 2𝑛2𝜋2
∆𝑦𝑝 ∆𝑡𝑝 𝑐𝑜𝑠
2𝑛𝜋 𝑡𝑝
𝑇 − 𝑐𝑜𝑠 2𝑛𝜋 𝑡𝑝 −1
𝑇
𝐾
𝑑𝑛 = 𝑇 2𝑛2𝜋2
∆𝑦𝑝 ∆𝑡𝑝 𝑠𝑖𝑛
2𝑛𝜋 𝑡𝑝
𝑇 − 𝑠𝑖𝑛 2𝑛𝜋 𝑡𝑝 −1
𝑇
𝐾
𝑝=1 (4b)
The number of harmonics required is estimated from average Fourier power spectrum. The Fourier power of a harmonic is proportional to the amplitude and provides a measure of the amount of shape information described by that harmonic. For the nth harmonic, the Fourier power is computed by the following equation (Costa et al., 2009):
𝐹𝑜𝑢𝑟𝑖𝑒𝑟 𝑝𝑜𝑤𝑒𝑟 = 𝑁𝑛 =1 𝑎𝑛2+𝑏𝑛2+𝑐𝑛2+𝑑𝑛2
2 (5)
In this case, the Fourier harmonics were truncated at the value N, at which the average cumulative power was 99.99% or more of the total average power, calculated with Nmax, equal to half the number of boundary points.
2.5. Corner detection by analyzing the curvature:
Corner points have been defined in many ways by different researchers such as, local maxima (Abe et al., 1993), the point with largest "cornerity index" (Guru, Dinesh, & Nagabhushan, 2004), the point with k-cosine value (Rosenfeld & Johnston, 1973; Sun, 2008), and the point with maximum change of curvature (Freeman & Davis, 1977). However, corner points are not simply local maxima, high curvature or dominant points. They are points which change the features of shape.
Detecting corner points for straight line segments of polygonal shapes is easy as endpoints are corner points. But when dealing with non-parametric curves as well as outlines of natural objects determining corner points is difficult and complicated. In order to compute the corners, it is important to give them some mathematical representation (Muhammad Sarfraz, Interactive Curve Modelling).
The detection of a corner is a function of the magnitude of the discontinuity, its abruptness, and the curved regions either side of it over where the mean curvature can be considered to be uniform and free of discontinuities (Masood & Sarfraz, 2007). The absolute value of the curvature is a measure of how sharply the curve bends. Curves that bend slowly, which are almost straight, will have small absolute curvature. The curvature function k(t) is the derivative of the orientation functionØ(t), expressed as (Frette, zirnovsky, & Silin, 2009; Walton & Meek, 2001):
∅ 𝑡 = 𝑡𝑎𝑛 𝑑𝑦 (𝑡)
𝑑𝑥(𝑡) , 𝑘 𝑡 =
𝑑𝑥 𝑡 𝑑2𝑦 𝑡 −𝑑2𝑥 𝑡 𝑑𝑦 (𝑡)
𝑑𝑥 (𝑡)2+𝑑𝑦 (𝑡)232
(6)
where k(t) is the curvature, 𝑑𝑥(𝑡), 𝑑𝑦(𝑡)and 𝑑2𝑥 𝑡 , 𝑑2𝑦 𝑡 are the first and the second derivatives of x and y with respect to t, respectively. Most healthy grains are generally convex and when convex objects are in contact, they form concave contour regions where the local curvature values are negative. Nodal points for multiple touching objects are determined from curvature values that fall below a certain threshold value (Freeman & Davis, 1977; Mebatsion and Paliwal, 2011).Corner points are calculated and angle of bending is found with tangent. By using radical critical distance potential node pairs are found. Nearest neighbors among the pairs are calculated by finding pair-wise distance among them using Euclidean distance formula. Then true pairs are selected from potential pairs, based on nearest-neighbor distance criteria.
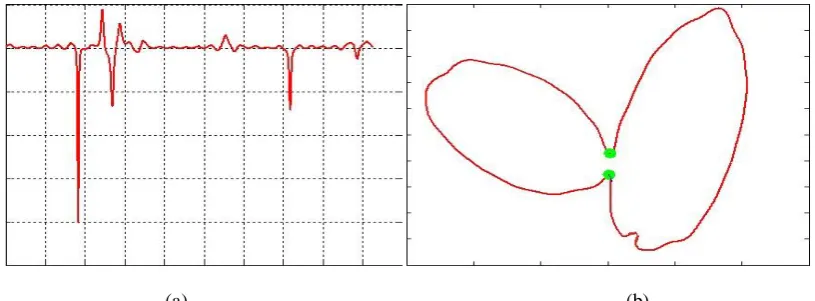
(a) (b)
the rest of the boundary points of the touching grain kernels. The critical curvature value is -20. (b) The nodal points (marked with green spot) used for separating multiple touching grains. The corresponding curvature value of the nodal point is presented in Fig. 2 (a).
Based on the curvature values, the nodal points can accurately be defined on the elliptic Fourier series approximation curve depicted in Fig. 3 (b)
2.6. Determination of segmentation lines:
For determining segmentation lines Euclidian distance between each pair of points is calculated and arranged in ascending order. For joining pair nearest-neighbour algorithm is used. The first pair was taken to define the first segmentation line. The list of pairs was then automatically edited to remove any other pair containing any of the pixels forming the first pair. Subsequent segmentation lines were determined by repeating the procedure until all the node pairs were exhausted (Mebatsion and Paliwal, 2011; Visen et al., 2001). Nearest-neighbour criterion fails to separate touching grains where grains are slender in shape and have roughness (Mebatsion and Paliwal, 2011). This calls for the need to set additional requirements for the segmentation algorithm to be executed prior to the nearest-neighbour criterion. In this respect, an algorithm that combines the nearest-neighbour algorithm and a radian critical distance difference is proposed by Paliwal (2010). The radial critical distance, Ls, is defined as the ratio of the radian measure of the perimeter of an elliptic Fourier approximation of a curve (the boundary of touching objects in this case) (=2π) and the total number of potential nodes, n, defined as, Ls= (2π/n)2/3. A one-pixel thick flexible moving window (Wm) of length (Ls) is traced over a sub-segment from a “reference” node to the others. At each step the presence of a node point inside the moving window is examined. (H.K. Mebatsion*, J. Paliwal ; 2010). A list of "potential" node pairs is constructed from the reference node point and node points outside Wm; i.e., a node point inside Wm is ignored from being a potential node pair. The procedure is repeated for all node points. From the list of potential node pairs, the "true" node pairs are determined using nearest-neighbour criterion.
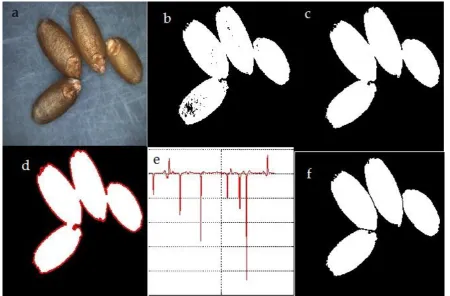
Fig. 4 A typical multiple kernel separation procedure for three grains: (a) original image showing multiple touching kernels; (b) Binary image (c) Pre-processed image (d) the curvature value as a function of cumulative radial distance where the nodal points are clearly identified; (e) inverted image of touching grains, nodal points marked with green spot; (f) separated kernels.
Fig. 5 A typical multiple kernel separation procedure for four grains: (a) original image showing multiple touching kernels; (b) Binary image (c) Pre-processed image (d) Fourier series approximation (red contours) of the boundary contours of touching kernels; (e) the curvature value as a function of cumulative radial distance where the nodal points are clearly identified; (f) separated kernels.
III. RESULTS
The proposed algorithm is able to separate most of the instances of multiple touching wheat grains irrespective of their orientation. The Figs. 4 and 5 show the steps of separating multiple touching grain kernels. Because of rough shape of grains separation algorithms fail to separate the grain properly may detect pseudo corners. But Fourier series approximation overcomes this limitation and algorithm able to separate kernels properly.
CONCLUSION