R E S E A R C H
Open Access
Association between dietary patterns and
cognitive function among 70-year-old
Japanese elderly: a cross-sectional analysis
of the SONIC study
Hitomi Okubo
1*, Hiroki Inagaki
2, Yasuyuki Gondo
3, Kei Kamide
4, Kazunori Ikebe
5, Yukie Masui
2, Yasumichi Arai
6,
Tatsuro Ishizaki
2, Satoshi Sasaki
7, Takeshi Nakagawa
8, Mai Kabayama
4, Ken Sugimoto
9, Hiromi Rakugi
9,
Yoshinobu Maeda
5and SONIC Study Group
Abstract
Background:An increasing number of studies in Western countries have shown that healthy dietary patterns may have a protective effect against cognitive decline and dementia. However, information on this relationship among non-Western populations with different cultural settings is extremely limited. We aim to examine the relationship between dietary patterns and cognitive function among older Japanese people.
Methods:This cross-sectional study included 635 community-dwelling people aged 69–71 years who participated in the prospective cohort study titled Septuagenarians, Octogenarians, Nonagenarians Investigation with Centenarians (SONIC). Diet was assessed over a one-month period with a validated, brief-type, self-administered diet history questionnaire. Dietary patterns from thirty-three predefined food groups [energy-adjusted food (g/d)] were extracted by factor analysis. Cognitive function was assessed using the Japanese version of the Montreal Cognitive Assessment (MoCA-J). Multivariate regression analysis was performed to examine the relationship between dietary patterns and cognitive function.
Results: Three dietary patterns were identified: the ‘Plant foods and fish’, ‘Rice and miso soup’, and ‘Animal food’ patterns. The ‘Plant foods and fish’ pattern, characterized by high intakes of green and other vegetables, soy products, seaweeds, mushrooms, potatoes, fruit, fish, and green tea, was significantly associated with a higher MoCA-J score [MoCA-J score per one-quartile increase in dietary pattern: β = 0.56 (95% CI: 0.33, 0.79), Pfor trend <0.001]. This association was still evident after adjustment for potential confounding factors [β= 0.41 (95% CI: 0.17, 0.65),Pfor trend <0.001]. In contrast, neither the‘Rice and miso soup’nor the‘Animal food’pattern was related to cognitive function. To confirm the possibility of reverse causation we also conducted a sensitivity analysis excluding 186 subjects who reported substantial changes in their diet for any reason, but the results did not change materially.
Conclusion:This preliminary cross-sectional study suggests that a diet with high intakes of vegetables, soy products, fruit, and fish may have a beneficial effect on cognitive function in older Japanese people. Further prospective studies are needed to confirm this finding.
Keywords:Cognitive function, Dietary pattern, Factor analysis, Japanese, Elderly
* Correspondence:[email protected]
1Department of Health Promotion, National Institute of Public Health, 2-3-6
Minami, Wako-shi, Saitama 351-0197, Japan
Full list of author information is available at the end of the article
Background
With a global aging population, the prevalence of age-related cognitive decline leading to dementia is rising dramatically, and is now one of the most ser-ious public health challenges worldwide [1]. As there is still no effective cure or treatment to modify the course of dementia, successful preventive strategies will rely on accurate understanding of the role of modifiable factors and their influence on cognitive function and the risk of dementia.
There is considerable interest in the role of diet as an important modifiable risk factor for early preven-tion and delayed onset of age-related cognitive decline and dementia [2–6]. Much of the attention regarding the relation of diet to cognition or dementia among the elderly has shifted from the roles of single nutri-ents or foods to the roles of dietary patterns, reflect-ing the complexity of diet and our daily eatreflect-ing behavior. Recent systematic reviews and meta-analyses have summarized the available studies on the roles of dietary patterns in cognitive function and the risk of dementia [2–7]. Although several approaches to the identification of dietary patterns have been explored, the results in general suggest that dietary patterns with a higher intake of fruits, vegetables, fish, nuts, and legumes and a lower intake of meat and high-fat dairy products seem to be associated with better cognitive function or reduced risk of dementia [2–7]. In particular, the Mediterranean dietary pattern has shown, with considerable consistency, that it may protect against or slow the rate of cognitive decline with aging [3–5, 7]. Almost all of these studies, however, have been conducted in Western populations, while research in non-Western populations, including the Japanese population, is ex-tremely limited [8–12]. The Japanese diet has characteris-tics seldom observed in those of Western populations, including high intakes of rice, soybean products, fish, seaweeds, and green tea, in addition to low total and satu-rated fat intakes [13]. Given the differences in dietary habits and social characteristics between the Japanese and Western cultures, further studies are warranted to examine the relationships between dietary patterns and cognitive function in the Japanese population.
The objective of the present cross-sectional study was to examine the association between dietary patterns and cognitive function among 635 older Japanese people who participated in a prospective cohort study called Septuagenarians, Octogenarians, Nonagenarians Inves-tigation with Centenarians (SONIC) [14]. We consid-ered the effects of a wide range of potential confounding factors, including sociodemographic characteristics, lifestyle, medical conditions, and genetic polymor-phisms that have been suggested to influence cogni-tive function.
Methods
Study population and procedure
The present cross-sectional analysis was based on the baseline survey of the SONIC Study, an ongoing prospect-ive cohort study of older people as part of the Centenarian Study that was initiated in June 2010 [14]. The principal objectives of the SONIC Study are to assess the character-istics of a general population sample of older people con-sisting of three control groups of different ages (70s, 80s, and 90s) for a centenarian cohort, and to clarify the factors for health, longevity, and psychological well-being. We used a narrow age-range cohort design [14], and each cohort includes individuals whose ages fall within a 3-year range (i.e., 69–71, 79–81, and 89–91 years old for the 70s, 80s, and 90s cohorts, respectively). The data collection for each age cohort was conducted in different years. The first-wave survey began in 2010 for the 70s cohort, 2011 for the 80s cohort, and 2012 for the 90s cohort. We have also conducted a follow-up assessment on each cohort every 3 years after the baseline survey. Each cohort con-sisted of a total of 1000 participants living independently who had been randomly selected through the local resi-dent registry from four areas in Japan: Itami City, Hyogo (Western-urban); Asago City, Hyogo (Western-rural); Itabashi Ward, Tokyo (Eastern-urban); and Nishitama County, Tokyo (Eastern-rural). A detailed description of the rationale, study design, and protocol has been pub-lished elsewhere [14–16].
The present analysis includes only participants in the baseline survey of the 70s cohort. The baseline assess-ment of the SONIC Study was primarily conducted by means of a questionnaire booklet containing questions on socioeconomic status, psychosocial variables, medical conditions of self and family, dental conditions, diet, and lifestyle; medical and physical examinations were also performed. Research technicians confirmed missing or illogical data through interview at the survey venue. All measurements at each survey venue were conducted according to the survey protocol. A total of 1000 sub-jects (479 men and 521 women) aged 69–71 years com-pleted the baseline survey for the 70s cohort between June and November 2010. After we excluded subjects who were currently receiving dietary counselling from a doctor or dietician (n= 123) or were missing informa-tion on the variables used (n = 242), data on 635 sub-jects (292 men and 343 women) were used for the present analysis.
Dietary assessment
consumed in Japan, general dietary behavior and usual cooking methods. Daily intake of foods (58 food items in total), energy, and selected nutrients was calculated using an ad hoc computer algorithm for the BDHQ, which was based on the Standard Tables of Food Com-position in Japan [19]. Information on portion size was not collected in the BDHQ; rather, a sex-specific fixed portion size was used in calculations for all subjects. The relative validity of the estimates of intake from the BDHQ was established in comparison with intakes assessed using 16-day semi-weighed dietary records (DR) in a validation study of 92 Japanese men aged 32–76 years and 92 Japanese women aged 31–69 years. Median Spearman correlation coefficients with the DR for the 58 foods were 0.48 (range: 0.22–0.83) in men and 0.44 (range: 0.14–0.82) in women [17]. Median Pearson correlation coefficients with the DR for energy-adjusted intakes of the 42 nutrients were 0.56 (range: 0.41–0.63) in men and 0.54 (range: 0.45–061) in women [18]. A more detailed de-scription of the methods used to calculate dietary intakes and the validity of the BDHQ has been published previ-ously [15, 16].
Identification of dietary pattern
Dietary patterns can be assessed with different techniques: 1) hypothesis-driven (a priori) techniques using score-based approaches such as the Mediterranean diet score or healthy eating index, 2) data-driven (a posteriori) tech-niques using statistical methods such as factor analysis/ principal component analysis (PCA) and cluster analysis, and more recently 3) reduced rank regression (RRR), which combines characteristics of the former two ap-proaches [20]. In contrast to a priori apap-proaches and RRR, a posteriori approaches are data-driven, and thus, do not require a prior knowledge or theory of the diet-disease re-lationship and biological pathways [2]. Factor analysis is especially useful for exploring underlying patterns that ex-plain variation in how subjects eat, and generates ranked scores, which have excellent characteristics for use in linear regression analysis, with good power for detecting associations with outcome variables [20]. We therefore chose factor analysis to identify dietary patterns in the SONIC Study. Before the analysis, individual food items calculated from the BDHQ (58 foods) were classified into one of the 33 predefined food groups (see Additional file 1: Table S1). The food-grouping scheme was generally based on the principles of similarity of nutrient profiles or culin-ary usage of the foods, mainly according to the food com-position tables of Japanese foods [19], the classification of food groups used by the National Nutrition Survey [13], and that used in previous studies [21, 22]. Intakes of these food groups (g food/d) were adjusted for total energy in-take by the density methods (g/1000 kcal). Factor analysis was conducted using the FACTOR procedure in SAS
statistical software package version 9.4 (SAS Institute, Inc., Cary, NC, USA). The factors were rotated by orthogonal transformation (Varimax rotation function in SAS) to achieve a simpler structure with greater interpretability. The number of factors that best represent the data is chosen on the basis of eigenvalues, scree plots, and the interpretability of food combinations on each factor. We repeated the same analysis with a varied numbers of factors and randomly divided the subjects into two groups to examine whether these choices affected the reliability of our findings. The results showed closely similar dietary pat-terns (data not shown). The proportion of variance ex-plained by each factor was calculated by dividing the sum of the squares of the respective factor loadings by the number of variables. The factor scores for each pat-tern and for each individual were determined by sum-ming the intake of each food group weighted by the factor loading [23]. We used these scores to rank the subjects according to the degree to which they con-formed to the dietary pattern.
Assessment of cognitive function
Cognitive and functional status was assessed using the Japanese version of the Montreal Cognitive Assessment (MoCA-J) by trained geriatricians and psychologists [24]. The MoCA is a brief cognitive screening tool for detecting mild cognitive impairment in older people, and assesses nine domains of cognition: 1) attention, 2) concentration, 3) executive functions, 4) memory, 5) language, 6) visuo-constructional skills, 7) conceptual thinking, 8) calcula-tions, and 9) orientation [24, 25]. The total MoCA score ranges from 0 to 30, with higher scores reflecting higher cognitive function. The test has been broadly used in other large-scale studies on cognitive function, and the re-liability and validity of the MoCA for predicting early cog-nitive decline in comparison with a conventional cogcog-nitive test has been well established in the Japanese population [24]. We therefore used the MoCA-J total score as an indicator of cognitive function.
Assessment of confounding factors
We collected information on sex, date of birth, residen-tial area (Itami, Asago, Itabashi, or Nishitama), education [<10 (junior high school or less), 10–12 (high school), or
shoes. BMI (kg/m2) was calculated as weight (kg) divided by height squared (m2). Blood pressure in the left and right arm was measured twice by a physician or trained nurse using a standard mercury sphygmomanometer or elec-tronic monitor, and the mean value of the two measure-ments in each of the two arms was used. Hypertension was defined as systolic blood pressure≥140 mmHg or diastolic blood pressure≥90 mmHg, or as having received antihy-pertensive treatment [26]. Venous blood samples for meas-urement of plasma glucose, plasma lipids, and other biochemistry indicators were collected in the fasting status. Diabetes was defined as a fasting plasma glucose concen-tration≥7.0 mmol/L (126 mg/dL), a casual plasma glucose concentration≥11.1 mmol/L (200 mg/dL), HbA1c≥6.5%, or current use of medication for diabetes [27]. ApoE gene polymorphic alleles are the main genetic determinants of Alzheimer’s disease (AD) risk: theε4 allele is most highly associated with AD at a large range of ages and in all eth-nic groups [28]. We therefore analyzed the ApoE gene polymorphisms, and individual carriers of at least one ε4 allele (sum of ε4/ε4, ε4/ε3 andε4/ε2) were considered to have a positive genotype. Genomic DNA was extracted from white blood cells and polymerase chain reaction methods were performed for genotyping of ApoE-ε4 allele. Depressive symptoms were assessed according to the five-item short form of the Geriatric Depression Scale (GDS-5: score range from 0 to 5) [29].
Statistical analysis
Descriptive data are presented as means (standard devi-ation or 95% confidence interval) for continuous variables and percentages of subjects for categorical variables. To avoid biased grouping due to variation in body size and energy requirement, values of nutrient and food intake were energy-adjusted using the density method (i.e., per-centage of energy for energy-providing nutrients and amount per 1000 kcal of energy for other nutrients and foods). The factor scores for each dietary pattern were cat-egorized into quartiles which were used for the compari-son of nutrient intakes and other lifestyle factors. Pearcompari-son correlation coefficients were used to describe the relations of nutrient intakes with each dietary pattern.
Univariate and multiple linear regression analyses were performed to explore associations of each dietary pattern with MoCA-J score. We calculated mean (95% CI) values of the MoCA-J score according to the quartile of each dietary pattern with or without adjustment for the follow-ing potential confounders: sex (men or women), area of residence (Western-urban, Western-rural, Eastern-urban, or Eastern-rural), education (<10, 10–12, or ≥13 years), frequency of going outdoors (<1, 1–4, or ≥5 times per week), current smoking status (yes or no), alcohol con-sumption (yes or no), BMI (kg/m2, continuous), GDS-5
depression score (continuous), hypertension (yes or no), diabetes (yes or no), medical history of cerebrovascular disease (yes or no), and ApoE-ε4 allele carrier status (yes or no). We also calculated unstandardized partial regres-sion coefficient (95% CI) that reflects the change in MoCA-J score per one-quartile increase in conformity to a particular dietary pattern. Tests for trend associations were based on assigning ordinal numbers 0–3 to the four categories of each dietary pattern. All statistical analyses were performed using the SAS statistical software package version 9.4 (SAS Institute, Inc., Cary, NC, USA). All reportedPvalues are two-tailed andP< 0.05 was consid-ered to be statistically significant.
Results
Dietary patterns
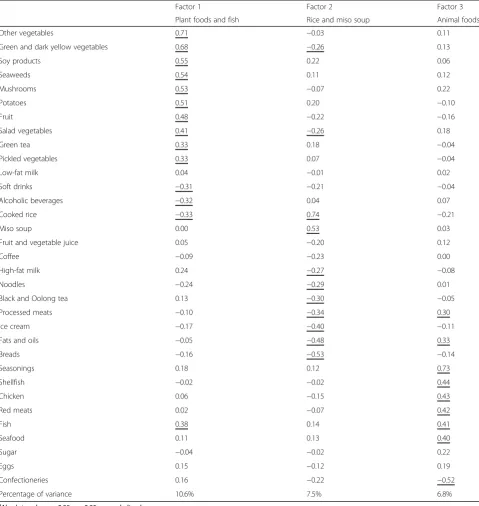
Three dietary patterns were identified (Table 1) and each was labelled according to the food groups with high loadings. Factor 1, which loaded heavily on green and dark yellow vegetables, other vegetables, soy products, seaweeds, mushrooms, potatoes, fruit, salad vegetables, fish, green tea, and pickled vegetables, was labelled the
‘Plant foods and fish’pattern. Factor 2, with high positive loadings for rice and miso soup, and high negative load-ings for bread, fats and oils, and ice cream, was labelled the “Rice and miso soup” pattern. Factor 3, with high loadings for seasonings, shellfish, chicken, red meats, fish, seafood, and processed meats, was labelled the‘ Ani-mal food’ pattern. Overall, the three dietary patterns accounted for 24.9% of the variance in food intake.
Associations of dietary patterns with subject characteristics
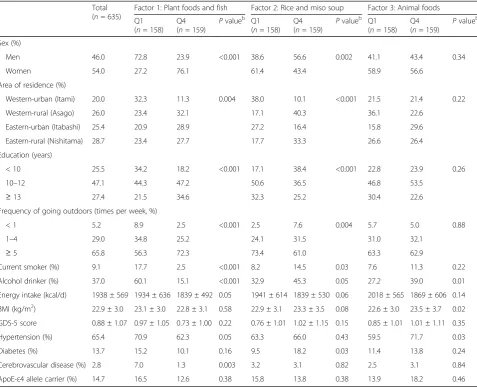
Characteristics of the 635 analytical subjects are shown in Table 2. Compared with other participants in the baseline survey of the 70s SONIC cohort (n = 365), those included in the analysis were more likely to live in a rural area (P < 0.01) but less likely to have diabetes (P < 0.001). There was no difference in sex, education, frequency of going outdoors, smoking, alcohol con-sumption, energy intake, BMI, GDS-5 score, hyperten-sion, diabetes, cerebrovascular disease, or ApoE-ε4 allele carrier status between the subjects analyzed and the remaining participants.
soup’pattern were more likely to be men, to be current smokers, to drink alcohol, to live in the Western-rural area, to have lower educational attainment, to go out-doors less frequently, and to have diabetes (allP< 0.05). The subjects with higher scores for the ‘Animal food’ pattern were more likely to drink alcohol and to have higher BMI and hypertension (allP< 0.05).
Associations of dietary patterns with nutrient intakes
Mean energy-adjusted nutrient intakes for the lowest (Q1) and highest (Q4) quartiles of each dietary pattern and Pearson correlation coefficients are shown in Table 3. Across the distribution of each dietary pattern, there were differences in patterns of nutrient intake. The Pear-son correlation coefficients between each dietary pattern
Table 1Factor-loading matrix for the major three dietary patterns identified among 635 Japanese men and women aged 69–71 years
who participated in the SONIC Study, Japana
Factor 1 Factor 2 Factor 3
Plant foods and fish Rice and miso soup Animal foods
Other vegetables 0.71 −0.03 0.11
Green and dark yellow vegetables 0.68 −0.26 0.13
Soy products 0.55 0.22 0.06
Seaweeds 0.54 0.11 0.12
Mushrooms 0.53 −0.07 0.22
Potatoes 0.51 0.20 −0.10
Fruit 0.48 −0.22 −0.16
Salad vegetables 0.41 −0.26 0.18
Green tea 0.33 0.18 −0.04
Pickled vegetables 0.33 0.07 −0.04
Low-fat milk 0.04 −0.01 0.02
Soft drinks −0.31 −0.21 −0.04
Alcoholic beverages −0.32 0.04 0.07
Cooked rice −0.33 0.74 −0.21
Miso soup 0.00 0.53 0.03
Fruit and vegetable juice 0.05 −0.20 0.12
Coffee −0.09 −0.23 0.00
High-fat milk 0.24 −0.27 −0.08
Noodles −0.24 −0.29 0.01
Black and Oolong tea 0.13 −0.30 −0.05
Processed meats −0.10 −0.34 0.30
Ice cream −0.17 −0.40 −0.11
Fats and oils −0.05 −0.48 0.33
Breads −0.16 −0.53 −0.14
Seasonings 0.18 0.12 0.73
Shellfish −0.02 −0.02 0.44
Chicken 0.06 −0.15 0.43
Red meats 0.02 −0.07 0.42
Fish 0.38 0.14 0.41
Seafood 0.11 0.13 0.40
Sugar −0.04 −0.02 0.22
Eggs 0.15 −0.12 0.19
Confectioneries 0.16 −0.22 −0.52
Percentage of variance 10.6% 7.5% 6.8%
a
and intake of nutrients that may be protective against cognitive impairment, namely, fatty acids, antioxidants (vitamins A, E, and C), and B-vitamins (vitamins B6, B12,
and folate), were examined. The ‘Plant foods and fish’ pattern was positively correlated with intake of protein, fat, polyunsaturated fatty acids (PUFA), eicosapentaenoic acid (20:5 n-3) (EPA) + docosahexaenoic acid (22:6 n-3) (DHA), dietary fiber, and all vitamins and minerals ex-amined. The‘Rice and miso soup’pattern was positively correlated with intake of carbohydrate, but negatively correlated with intake of fat, saturated fatty acids (SFA), monounsaturated fatty acids (MUFA), PUFA, and vita-mins A, E, and C. In contrast, the ‘Animal food’ pattern was positively correlated with intake of protein, fat, MUFA, PUFA, EPA + DHA, vitamins A, E, B6, and B12,
and all minerals examined, but negatively correlated with intake of carbohydrate.
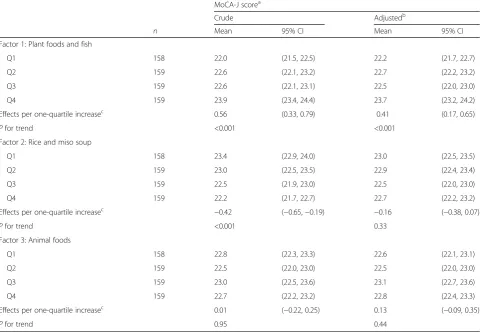
Associations of dietary patterns with cognitive function
The associations of each dietary pattern with MoCA-J score as an indicator of cognitive function are shown in Table 4. There was a strong positive association between the ‘Plant foods and fish’ pattern and MoCA-J score (P < 0.001). This association remained after adjustment for potential confounding effects of sex, area of resi-dence, education, frequency of going outdoors, current smoking status, alcohol consumption, BMI, ApoE-ε4 al-lele carrier status, and medical history of diabetes, hypertension, cerebrovascular disease, and depression (P < 0.001). The ‘Rice and miso soup’ pattern was sig-nificantly associated with a lower MoCA-J score (P < 0.001), but this negative association disappeared after adjustment for confounders (P = 0.33). In con-trast, no associations were observed between the
‘Animal food’pattern and MoCA-J score.
Table 2Characteristics of 635 subjects aged 69–71 years who participated in the SONIC Study, Japana
Total (n= 635)
Factor 1: Plant foods and fish Factor 2: Rice and miso soup Factor 3: Animal foods
Q1 (n= 158)
Q4
(n= 159) P
valueb Q1 (n= 158)
Q4
(n= 159) P
valueb Q1 (n= 158)
Q4
(n= 159) P valueb
Sex (%)
Men 46.0 72.8 23.9 <0.001 38.6 56.6 0.002 41.1 43.4 0.34
Women 54.0 27.2 76.1 61.4 43.4 58.9 56.6
Area of residence (%)
Western-urban (Itami) 20.0 32.3 11.3 0.004 38.0 10.1 <0.001 21.5 21.4 0.22
Western-rural (Asago) 26.0 23.4 32.1 17.1 40.3 36.1 22.6
Eastern-urban (Itabashi) 25.4 20.9 28.9 27.2 16.4 15.8 29.6
Eastern-rural (Nishitama) 28.7 23.4 27.7 17.7 33.3 26.6 26.4
Education (years)
< 10 25.5 34.2 18.2 <0.001 17.1 38.4 <0.001 22.8 23.9 0.26
10–12 47.1 44.3 47.2 50.6 36.5 46.8 53.5
≥13 27.4 21.5 34.6 32.3 25.2 30.4 22.6
Frequency of going outdoors (times per week, %)
< 1 5.2 8.9 2.5 <0.001 2.5 7.6 0.004 5.7 5.0 0.88
1–4 29.0 34.8 25.2 24.1 31.5 31.0 32.1
≥5 65.8 56.3 72.3 73.4 61.0 63.3 62.9
Current smoker (%) 9.1 17.7 2.5 <0.001 8.2 14.5 0.03 7.6 11.3 0.22
Alcohol drinker (%) 37.0 60.1 15.1 <0.001 32.9 45.3 0.05 27.2 39.0 0.01
Energy intake (kcal/d) 1938 ± 569 1934 ± 636 1839 ± 492 0.05 1941 ± 614 1839 ± 530 0.06 2018 ± 565 1869 ± 606 0.14
BMI (kg/m2) 22.9 ± 3.0 23.1 ± 3.0 22.8 ± 3.1 0.58 22.9 ± 3.1 23.3 ± 3.5 0.08 22.6 ± 3.0 23.5 ± 3.7 0.02
GDS-5 score 0.88 ± 1.07 0.97 ± 1.05 0.73 ± 1.00 0.22 0.76 ± 1.01 1.02 ± 1.15 0.15 0.85 ± 1.01 1.01 ± 1.11 0.35
Hypertension (%) 65.4 70.9 62.3 0.05 63.3 66.0 0.43 59.5 71.7 0.03
Diabetes (%) 13.7 15.2 10.1 0.16 9.5 18.2 0.03 11.4 13.8 0.24
Cerebrovascular disease (%) 2.8 7.0 1.3 0.003 3.2 3.1 0.82 2.5 3.1 0.84
ApoE-ε4 allele carrier (%) 14.7 16.5 12.6 0.38 15.8 13.8 0.38 13.9 18.2 0.46
BMIbody mass index,GDSGeriatric Depression Scale
a
Values are means ± SD for continuous variables and percentages of subjects for categorical variables
b
In further analyses, we conducted same analyses by examining dietary patterns for men and women separately because eating behavior may differ according to sex. The three similar dietary patterns were observed in both sexes, and the results indicating a positive association between the ‘Plant foods and fish’ pattern and MoCA-J score did not change materially (data not shown). Because our find-ings came from a cross-sectional study, we could not ex-clude the possibility of reverse causation such that the subjects changed their dietary behavior or food choices because of the worsening of their cognitive function. We therefore checked the robustness of our findings through additional analysis. We ran the models while excluding 186 subjects who reported substantial changes in diet for any reason, but the results (Model 2) did not change materially [MoCA-J score per one-quartile increase in conformity to dietary pattern: β = 0.37 (95% CI: 0.08, 0.65), P for trend = 0.01 for the ‘Plant foods and fish’
pattern,β=−0.07 (−0.34, 0.20),Pfor trend = 0.99 for the
‘Rice and miso soup’pattern, andβ= 0.15 (−0.12, 0.41),P for trend = 0.33 for the‘Animal food’pattern].
Discussion
The principal finding of this cross-sectional study was that the‘Plant foods and fish’dietary pattern was associ-ated with better cognitive function in older Japanese men and women, as indicated by a higher MoCA-J score. These associations persisted after adjustment for potential confounding factors including sociodemo-graphic and lifestyle characteristics, medical conditions, and ApoE-ε4 allele. In contrast, neither the ‘Rice and miso soup’ nor ‘Animal food’ patterns was associated with cognitive function. Although our results require replication, these findings provide further evidence to suggest that a healthy diet with a variety of food groups
Table 4Association between dietary pattern and MoCA-J score among 635 Japanese men and women aged 69–71 years who par-ticipated in SONIC Study, Japan
MoCA-J scorea
Crude Adjustedb
n Mean 95% CI Mean 95% CI
Factor 1: Plant foods and fish
Q1 158 22.0 (21.5, 22.5) 22.2 (21.7, 22.7)
Q2 159 22.6 (22.1, 23.2) 22.7 (22.2, 23.2)
Q3 159 22.6 (22.1, 23.1) 22.5 (22.0, 23.0)
Q4 159 23.9 (23.4, 24.4) 23.7 (23.2, 24.2)
Effects per one-quartile increasec 0.56 (0.33, 0.79) 0.41 (0.17, 0.65)
Pfor trend <0.001 <0.001
Factor 2: Rice and miso soup
Q1 158 23.4 (22.9, 24.0) 23.0 (22.5, 23.5)
Q2 159 23.0 (22.5, 23.5) 22.9 (22.4, 23.4)
Q3 159 22.5 (21.9, 23.0) 22.5 (22.0, 23.0)
Q4 159 22.2 (21.7, 22.7) 22.7 (22.2, 23.2)
Effects per one-quartile increasec
−0.42 (−0.65,−0.19) −0.16 (−0.38, 0.07)
Pfor trend <0.001 0.33
Factor 3: Animal foods
Q1 158 22.8 (22.3, 23.3) 22.6 (22.1, 23.1)
Q2 159 22.5 (22.0, 23.0) 22.5 (22.0, 23.0)
Q3 159 23.0 (22.5, 23.6) 23.1 (22.7, 23.6)
Q4 159 22.7 (22.2, 23.2) 22.8 (22.4, 23.3)
Effects per one-quartile increasec 0.01 (
−0.22, 0.25) 0.13 (−0.09, 0.35)
Pfor trend 0.95 0.44
MoCA-J: Japanese version of the Montreal Cognitive Assessment
a
All values are mean and 95% CIs in parentheses
b
Adjusted for sex (men or women), residential area (Western-urban, Western-rural, Eastern-urban, or Eastern-rural), education (<10, 10–12, or≥13 years), frequency of going outdoors (<1, 1–4, or≥5 times per week), current smoking status (yes or no), alcohol consumption (yes or no), BMI (kg/m2, continuous), GDS-5 score as depression (continuous), hypertension (yes or no), diabetes (yes or no), cerebrovascular disease (yes or no) and ApoE-ε4 allele carrier (yes or no)
c
could play a protective role in slowing age-related cogni-tive decline in older non-Western populations.
There is now a growing body of evidence from Western populations, mostly from the United States and the Medi-terranean countries of Europe, showing that healthy diet-ary patterns could have a protective role against cognitive impairment and the risk of dementia [2–7]. Much atten-tion has been paid to the effect of the Mediterranean diet-ary pattern, characterized by high consumption of fruits, vegetables, legumes, cereals, fish, and olive oil and low consumption of meat and dairy products with moderate consumption of wine, and most studies have found an in-verse association between adherence to the Mediterranean diet and cognitive impairment and dementia [3–5, 7]. In the present study, we identified the ‘Plant foods and fish’ dietary pattern as a healthy diet, which has some similar characteristics with the Mediterranean diet observed in the Western populations. In addition, our finding of better cognitive function among older people who have a higher score in the‘Plant foods and fish’dietary pattern is gener-ally in agreement with those of the previous Western studies [2–7], notwithstanding the differences in study population, history or cultural influence on eating habits, dietary assessment methods used, and approaches to diet-ary pattern identification. The protective effect of healthy dietary patterns on cognitive function was also supported by limited studies of Asian countries [8, 9, 12], but not of others [10, 11]. In a cross-sectional study of Chinese men and women aged >65 years in Hong Kong [8], a‘ vegeta-bles-and-fruits’pattern (rich in vegetables, fruits, soy and soy products, and legumes) identified by factor analysis was associated with a reduced risk of cognitive impair-ment in women, but not in men. In a prospective study of older Japanese people aged 60–79 years in the Hisayama Study [9], a dietary pattern with high intakes of soybean and soy products, green vegetables, other vegetables, algae, and milk and other dairy products and lower intake of rice, which the authors of that study identified by means of RRR, is associated with reduced risks of all-cause dementia, AD, and vascular dementia after 15 years of follow-up. The analysis from a recent study of the Ohsaki Cohort Study has also provided further evidence that a Japanese dietary pattern derived by PCA was associ-ated with a decreased risk of incident dementia after 5.7 years [12]. Our results, together with growing evidence from previous studies, suggest that a dietary pattern with a greater intake of vegetables, soy products, seaweed, fruits, and fish and a low intake of rice, soft drinks, and alcoholic beverages has the significant potential to pro-mote better preservation of cognitive function in older Japanese people.
The mechanisms that underlie the associations between dietary patterns and cognitive function are not fully known, but antioxidants, which are key components of a
healthy dietary pattern, may be involved [30]. Oxidative stress increases with aging; this process, together with the diminishment of the antioxidant defence system, has been indicated in the pathophysiological process of cognitive impairment and dementia [30–32]. Antioxidants such as vitamins A, E, and C in the diet may protect against neu-rodegeneration by scavenging free radicals [33, 34]. The beneficial effect of antioxidants from the diet might there-fore be more important for older people whose antioxi-dant demands are high. Concerning other potential dietary factors, the favorable effects of marine-origin n-3 PUFA including EPA and DHA on cognitive decline and/ or dementia have been well established in several epidemi-ologic studies [35–37]. This effect could be related to the role of fatty acids in maintaining the structural integrity of neuronal membranes and determining the fluidity of syn-aptosomal membranes and thereby regulating neuronal transmission [38, 39]. In addition, the protective effect of PUFA could be related to the anti-inflammatory effects and vascular protection exercised by these fatty acids [38, 39]. There is also growing evidence for the role of several B vitamins, especially folate, vitamins B6
and B12, which are required for proper DNA methylation
and to prevent the accumulation of homocysteine, which potentially induce neurotoxic effects [40–42]. The associ-ation of other potential nutrients and dietary components, including fatty acids [43], vitamin D [44], and minerals (potassium, calcium, and magnesium) [45] have also ex-amined, but results have been inconsistent. The ‘Plant foods and fish’ pattern in the present study was signifi-cantly and strongly correlated with intake of antioxidant vitamins (vitamins A, E, and C), EPA + DHA, B-vitamins (vitamins B6, B12, and folate), and minerals (potassium,
calcium, iron, and magnesium). The positive association detected between the ‘Plant foods and fish’ pattern and MoCA-J score could be explained by the cumulative ef-fects of individual nutrients which appear to correlate with the risk of dementia.
Very recent studies from Western countries have shown that dietary patterns high in red meat and processed meat were associated with poor cognitive function [46] and fas-ter cognitive decline [47]. These findings were inconsistent with the results of the present study showing that the‘ Ani-mal food’ pattern, characterized by high intake of meat, fish, and seasonings, was not related to cognitive function. At the nutrient level, we found that the‘Animal food’ pat-tern was significantly correlated with MUFA, PUFA, EPA + DHA, B-vitamins (B6and B12), and antioxidant
of the ‘Animal food’ pattern (i.e., meat and fish) on cognitive function might have been offset. Further studies are needed to clarify this association.
Several limitations of the present study warrant men-tion. First, the study subjects were not a representative sample of older Japanese men and women in the general population, and the present findings should not necessar-ily be generalized. Second, the study is cross-sectional, which limits our ability to infer a causal relationship be-tween diet and cognitive function. We cannot exclude the possibility of reverse causation (i.e., dietary change be-cause of preceding cognitive decline or other disease). Third, we used a validated dietary questionnaire for Japanese adults [17, 18], but the validity of this method has not been examined among older people. The accuracy of this method in terms of estimating total food and nutrient intake remains a serious concern, and the results should accordingly be interpreted with caution. Furthermore, misreporting of self-reported food intake is a potential source of measurement error. How-ever, such an error would be expected to attenuate any as-sociations, and we do not think that misreporting on the BDHQ could explain the associations we describe. Fourth, the three major dietary patterns identified in the present study explained only 24.9% of the total variance, suggest-ing the existence of other dietary patterns, although the remaining patterns were less interpretable in our analysis. However, the amount of variance explained is highly comparable with other studies of older people in Asian countries that obtained dietary patterns using dietary questionnaires [8–12]. Finally, subjects with healthier food and nutrient intake profiles may be more health conscious in general and may engage in other healthy behaviours which could potentially found associations with cognitive function. While we con-trolled for a large number of potential confounders, including sociodemographic and lifestyle characteristics, medical conditions, and ApoE-ε4 allele status, we cannot rule out unmeasured or residual confounding in an obser-vational study of this kind.
In conclusion, the present cross-sectional study of a sample of older Japanese people showed that the
‘Plant foods and fish’ pattern was positively associated with cognitive function. A diet with high intake of green and other vegetables, soy products, seaweeds, mushrooms, potatoes, fruit, fish, and green tea and low intake of rice, soft drinks, and alcoholic beverages may contribute to the prevention of age-related cog-nitive decline. Further cross-sectional and longitudinal studies in various populations following different diet-ary patterns are needed to confirm these findings and to determine the importance of diet composition in slowing cognitive decline and preventing dementia in older age.
Additional file
Additional file 1:The 33 food groupings used in dietary pattern analysis in SONIC Study, Japan. (DOC 113 kb)
Abbreviations
AD:Alzheimer’s disease; BDHQ: Brief-type dietary history questionnaire;
BMI: Body mass index; DHA: Dcosahexaenoic acid; EPA: Eicosapentaenoic acid; GDS: Geriatric Depression Scale; MoCA-J: Japanese version of the Montreal Cognitive Assessment; MUFA: Monounsaturated fatty acids; PCA: Principal component analysis; PUFA: Polyunsaturated fatty acids; RRR: Reduced rank regression; SFA: Saturated fatty acids; SONIC: Septuagenarians, Octogenarians, Nonagenarians Investigation with Centenarians
Acknowledgments
The members of the SONIC Study Group (in addition to the authors) are as
follows: Madoka Ogawa2, Yoshiko Lily Ishioka10, Chisato Inomata5, Hirochika
Ryuno4, Ryosuke Oguro9, Koichi Yamamoto9, Yasushi Takeya9, Yoichi Takami9,
Norihisa Ito9.
Madoka Ogawa (Tokyo Metropolitan Geriatric Hospital and Institute of Gerontology); Yoshiko Lily Ishioka (School of Science and Technology, Keio University); Chisato Inomata (Department of Prosthodontics, Gerontology and Oral Rehabilitation, Osaka University Graduate School of Dentistry); Hirochika Ryuno (Department of Health Science, Osaka University Graduate School of Medicine); Ryosuke Oguro, Koichi Yamamoto, Yasushi Takeya, Yoichi Takami, and Norihisa Ito (Department of Geriatric and General Medicine, Osaka University Graduate School of Medicine).
We are grateful to all of the SONIC participants who volunteered their time to take part in these studies. We sincerely appreciate all staff involved in the SONIC Study, especially Michiyo Takayama, Yusuke Mihara, Kohdai Hatta, Motoyoshi Fukutake, Hajime Takeshita, Kaori Enoki, Taiji Ogawa, Ken-ichi Matsuda.
Funding
This work was supported by MEXT KAKENHI Grant Numbers 16H05523 and 15H05025, JSPS KAKENHI Grant Number 21330152, 24,653,194, Health Labour Sciences Research Grant for Research on Cardiovascular and Life-Style Related Diseases, and Human science project of the Osaka University Graduate School of Human Sciences.
Availability of data and materials
The datasets used and/or analyzed during the current study available from the corresponding author on reasonable request.
Authors’contributions
HO was responsible for the collection of dietary data, and conducted the statistical analysis, interpreted the data, and wrote the manuscript; HI, YG, and YM were responsible for the collection of cognitive function data; YG, KK, KI, YM, YA, TI, HR, and YM were responsible for designing the SONIC Study and for data collection; KK, YA, MK, KS, and HR were responsible for collecting medical and biological data; SS was responsible for the analysis of dietary data and assisted in data interpretation and manuscript preparation; TN was responsible for field management, data collection, and data management. All authors provided suggestions during preparation of the manuscript and approved the final version submitted for publication.
Ethics approval and consent to participate
This study was conducted according to the guidelines laid down in the Declaration of Helsinki and approved by the Institutional Review Board of Osaka University Graduate School of Medicine, Dentistry and Human Sciences and the Tokyo Metropolitan Institute of Gerontology (approval numbers 266, H22-E9, 22,018, and 38, respectively). Written informed consent was obtained from all participants.
Consent for publication
Not applicable.
Competing interests
Publisher’s Note
Springer Nature remains neutral with regard to jurisdictional claims in published maps and institutional affiliations.
Author details
1Department of Health Promotion, National Institute of Public Health, 2-3-6
Minami, Wako-shi, Saitama 351-0197, Japan.2Tokyo Metropolitan Geriatric Hospital and Institute of Gerontology, Tokyo, Japan.3Department of Clinical Thanatology and Geriatric Behavioral Science, Osaka University Graduate School of Human Sciences, Osaka, Japan.4Department of Health Science, Osaka University Graduate School of Medicine, Osaka, Japan.5Department of Prosthodontics, Gerontology and Oral Rehabilitation, Osaka University Graduate School of Dentistry, Osaka, Japan.6Center for Supercentenarian Medical Research, Keio University, School of Medicine, Tokyo, Japan. 7Department of Social and Preventive Epidemiology, School of Public Health,
The University of Tokyo, Tokyo, Japan.8University Research Priority Program
“Dynamics in Healthy Aging”, The University of Zurich, Zurich, Switzerland and Japan Society for the Promotion of Science, Tokyo, Japan.9Department of Geriatric and General Medicine, Osaka University Graduate School of Medicine, Osaka, Japan.
Received: 10 May 2017 Accepted: 16 August 2017
References
1. Alzheimer’s Disease International. The world Alzheimer report 2015, the
global impact of dementia: an analysis of prevalence, incidence, cost and trends. London: Alzheimer's Disease International; 2015.
2. Allès B, Samieri C, Féart C, Jutand MA, Laurin D, Barberger-Gateau P. Dietary
patterns: a novel approach to examine the link between nutrition and
cognitive function in older individuals. Nutr Res Rev. 2015;25:207–22.
3. Lourida I, Soni M, Thompson-Coon J, Purandare N, Lang IA, Ukoumunne
OC, et al. Mediterranean diet, cognitive function, and dementia: a
systematic review. Epidemiology. 2013;24:479–89.
4. Psaltopoulou T, Sergentanis TN, Panagiotakos DB, Sergentanis IN, Kosti R,
Scarmeas N. Mediterranean diet, stroke, cognitive impairment, and
depression: a meta-analysis. Ann Neurol. 2013;74:580–91.
5. Singh B, Parsaik AK, Mielke MM, Erwin PJ, Knopman DS, Petersen RC, et al.
Association of Mediterranean diet with mild cognitive impairment and Alzheimer's disease: a systematic review and meta-analysis. J Alzheimers Dis.
2014;39:271–82.
6. van de Rest O, Berendsen AA, Haveman-Nies A, de Groot LC. Dietary
patterns, cognitive decline, and dementia: a systematic review. Adv Nutr.
2015;6:154–68.
7. Petersson SD, Philippou E. Mediterranean diet, cognitive function, and
dementia: a systematic review of the evidence. Adv Nutr. 2016;7:889–904.
8. Chan R, Chan D, Woo J. A cross sectional study to examine the association
between dietary patterns and cognitive impairment in older Chinese
people in Hong Kong. J Nutr Health Aging. 2013;17:757–65.
9. Ozawa M, Ninomiya T, Ohara T, Doi Y, Uchida K, Shirota T, et al. Dietary
patterns and risk of dementia in an elderly Japanese population: the
Hisayama study. Am J Clin Nutr. 2013;97:1076–82.
10. Kim J, Yu A, Choi BY, Nam JH, Kim MK, Oh DH, Kim K, Yang YJ. Dietary
patterns and cognitive function in Korean older adults. Eur J Nutr. 2015;54:
309–18.
11. Sugawara N, Yasui-Furukori N, Umeda T, Tsuchimine S, Kaneda A, Tsuruga K,
Iwane K, Okubo N, Takahashi I, Kaneko S. Relationship between dietary patterns and cognitive function in a community-dwelling population in
Japan. Asia Pac J Public Health. 2015;27:NP2651–60.
12. Tomata Y, Sugiyama K, Kaiho Y, Honkura K, Watanabe T, Zhang S, Sugawara
Y, Tsuji I. Dietary patterns and incident dementia in elderly Japanese: the
Ohsaki cohort 2006 study. J Gerontol A Biol Sci Med Sci. 2016;71:1322–8.
13. Ministry of Health, Labour, and Welfare of Japan. The National Health and
Nutrition Survey in Japan, 2014 [in Japanese]. http://www.mhlw.go.jp/ bunya/kenkou/eiyou/dl/h26-houkoku.pdf. Accessed Nov 2016.
14. Gondo Y, Masui Y, Kamide K, Ikebe K, Arai Y, Ishizaki T. SONIC Study: A
longitudinal cohort study of the older people as part of a centenarian study. In: NA Pachana, editor. Encyclopedia of Geropsychology, Springer
Science+Business Media Singapore. 2016. https://doi.org/10.1007/978–981–
287-080-3_182–181.
15. Inomata C, Ikebe K, Kagawa R, Okubo H, Sasaki S, Okada T, et al. Significance
of occlusal force for dietary fibre and vitamin intakes in independently
living 70-year-old Japanese: from SONIC study. J Dent. 2014;42:556–64.
16. Ryuno H, Kamide K, Gondo Y, Nakama C, Oguro R, Kabayama M, et al.
Differences in the association between high blood pressure and cognitive functioning among the general Japanese population aged 70 and 80 years:
the SONIC study. Hypertens Res. 2016;39:557–63.
17. Kobayashi S, Murakami K, Sasaki S, Okubo H, Hirota N, Notsu A, et al.
Comparison of relative validity of food group intakes estimated by comprehensive and brief-type self-administered diet history questionnaires against 16 d dietary records in Japanese adults. Public Health Nutr. 2011;14:
1200–11.
18. Kobayashi S, Honda S, Murakami K, Sasaki S, Okubo H, Hirota N, et al. Both
comprehensive and brief self-administered diet history questionnaires
satisfactorily rank nutrient intakes in Japanese adults. J Epidemiol. 2012;22:151–9.
19. Science and Technology Agency. Standard Tables of Food Composition in
Japan, 2010. Tokyo: Official Gazette Co-operation of Japan; 2010. In Japanese.
20. Tucker KL. Dietary patterns, approaches, and multicultural perspective. Appl
Physiol Nutr Metab. 2010;35:211–8.
21. Okubo H, Murakami K, Sasaki S, Kim MK, Hirota N, Notsu A, et al. Relative
validity of dietary patterns derived from a self-administered diet history questionnaire using factor analysis among Japanese adults. Public Health
Nutr. 2010;13:1080–9.
22. Okubo H, Miyake Y, Sasaki S, Tanaka K, Murakami K. Hirota Y; Osaka maternal
and child health study group. Dietary patterns during pregnancy and the risk of postpartum depression in Japan: the Osaka maternal and child health
study. Br J Nutr. 2011;105:1251–7.
23. Kim J-O, Mueller CW. Factor analysis: statistical methods and practical issues.
Thousand Oaks: Sage Publications Inc.
24. Fujiwara Y, Suzuki H, Yasunaga M, Sugiyama M, Ijuin M, Sakuma N, et al.
Brief screening tool for mild cognitive impairment in older Japanese: validation of the Japanese version of the Montreal cognitive assessment.
Geriatr Gerontol Int. 2010;10:225–32.
25. Nasreddine ZS, Phillips NA, Bédirian V, Charbonneau S, Whitehead V, Collin I,
et al. The Montreal cognitive assessment, MoCA: a brief screening tool for
mild cognitive impairment. J Am Geriatr Soc. 2005;53:695–9.
26. Shimamoto K, Ando K, Fujita T, Hasebe N, Higaki J, Horiuchi M, et al. The
Japanese Society of Hypertension Guidelines for the Management of
Hypertension (JSH 2014). Hypertens Res. 2014;37:253–390.
27. World Health Organization. Definition and Diagnosis of Diabetes Mellitus
and Intermediate Hyperglycemia. Report of a WHO/IDF Consultation. Geneva: WHO Document Production Services; 2006.
28. Hauser PS, Ryan RO. Impact of apolipoprotein E on Alzheimer's disease.
Curr Alzheimer Res. 2013;10:809–17.
29. Hoyl MT, Alessi CA, Harker JO, Josephson KR, Pietruszka FM, Koelfgen M, et
al. Development and testing of a five-item version of the geriatric
depression scale. J Am Geriatr Soc. 1999;47:873–8.
30. Berr C. Oxidative stress and cognitive impairment in the elderly. J Nutr
Health Aging. 2002;6:261–6.
31. Dröge W. Oxidative stress and aging. Adv Exp Med Biol. 2003;543:191e200.
32. Praticò D, Clark CM, Liun F, Rokach J, Lee VY, Trojanowski JQ. Increase of
brain oxidative stress in mild cognitive impairment: a possible predictor of
Alzheimer disease. Arch Neurol. 2002;59:972–6.
33. Morris MC, Evans DA, Bienias JL, Tangney CC, Wilson RS. Vitamin E and
cognitive decline in older persons. Arch Neurol. 2002;59:1125–32.
34. Mangialasche F, Solomon A, Kåreholt I, Hooshmand B, Cecchetti R, Fratiglioni L.
Serum levels of vitamin E forms and risk of cognitive impairment in a Finnish
cohort of older adults. Exp Gerontol. 2013;48:1428–35.
35. Morris MC, Evans DA, Bienias JL, Tangney CC, Bennett DA, Wilson RS.
Consumption of fish and n-3 fatty acids and risk of incident Alzheimer
disease. Arch Neurol. 2003;60:940–6.
36. Féart C, Peuchant E, Letenneur L, Samieri C, Montagnier D, Fourrier-Reglat
A, et al. Plasma eicosapentaenoic acid is inversely associated with severity of depressive symptomatology in the elderly: data from the Bordeaux
sample of the Three-City study. Am J Clin Nutr. 2008;87:1156–62.
37. Fotuhi M, Mohassel P, Yaffe K. Fish consumption, long-chain omega-3 fatty
acids and risk of cognitive decline or Alzheimer disease: a complex
association. Nat Clin Pract Neurol. 2009;5:140–52.
38. Solfrizzi V, Panza F, Capurso A. The role of diet in cognitive decline. J Neural
39. Solfrizzi V, D'Introno A, Colacicco AM, Capurso C, Del Parigi A, Capurso S, et al. Dietary fatty acids intake: possible role in cognitive decline and
dementia. Exp Gerontol. 2005;40:257–70. Review
40. Tucker KL, Qiao N, Scott T, Rosenberg I, Spiro A 3rd. High homocysteine and
low B vitamins predict cognitive decline in aging men: the veterans affairs
normative aging study. Am J Clin Nutr. 2005;82:627–35.
41. Morris MS, Jacques PF, Rosenberg IH, Selhub J. Folate and vitamin B-12
status in relation to anemia, macrocytosis, and cognitive impairment in older Americans in the age of folic acid fortification. Am J Clin Nutr. 2007;
85:193–200.
42. Agnew-Blais JC, Wassertheil-Smoller S, Kang JH, Hogan PE, Coker LH,
Snetselaar LG, et al. Folate, vitamin B-6, and vitamin B-12 intake and mild cognitive impairment and probable dementia in the Women's Health
Initiative memory study. J Acad Nutr Diet. 2015;115:231–41.
43. Kalmijn S. Fatty acid intake and the risk of dementia and cognitive decline:
a review of clinical and epidemiological studies. J Nutr Health Aging. 2000;4:
202–7. Review
44. van der Schaft J, Koek HL, Dijkstra E, Verhaar HJ, van der Schouw YT,
Emmelot-Vonk MH. The association between vitamin D and cognition: a
systematic review. Ageing Res Rev. 2013;12:1013–23.
45. Ozawa M, Ninomiya T, Ohara T, Hirakawa Y, Doi Y, Hata J, et al. Self-reported
dietary intake of potassium, calcium, and magnesium and risk of dementia
in the Japanese: the Hisayama study. J Am Geriatr Soc. 2012;60:1515–20.
46. Granic A, Davies K, Adamson A, Kirkwood T, Hill TR, Siervo M, et al. Dietary
patterns high in red meat, potato, gravy, and butter are associated with poor cognitive functioning but not with rate of cognitive decline in very
old adults. J Nutr. 2016;146:265–74.
47. Ozawa M, Shipley M, Kivimaki M, Singh-Manoux A, Brunner EJ. Dietary
pattern, inflammation and cognitive decline: the Whitehall II prospective
cohort study. Clin Nutr. 2016;36:506–12.
• We accept pre-submission inquiries
• Our selector tool helps you to find the most relevant journal • We provide round the clock customer support
• Convenient online submission • Thorough peer review
• Inclusion in PubMed and all major indexing services • Maximum visibility for your research
Submit your manuscript at www.biomedcentral.com/submit