R E S E A R C H
Open Access
Association of kidney function-related
dietary pattern, weight status, and
cardiovascular risk factors with severity of
impaired kidney function in middle-aged
and older adults with chronic kidney
disease: a cross-sectional population study
Adi Lukas Kurniawan
1, Chien-Yeh Hsu
2,3, Hsiao-Hsien Rau
4, Li-Yin Lin
1and Jane C.-J. Chao
1,3,5*Abstract
Background:Chronic Kidney Disease (CKD), characterized by impaired kidney function, affects over 1.5 million individuals in Taiwan. Cardiovascular disease (CVD) is commonly found in patients with CKD, and the increased prevalence of obesity can have some implications for the risk of both CKD and CVD. Since diet plays an important role in the development of obesity, CVD and CKD, our study was designed to investigate the association of kidney function-related dietary pattern with weight status, cardiovascular risk factors, and the severity of impaired kidney function in middle-aged and older adults in Taiwan.
Methods:A total of 41,128 participants aged 40 to 95 years old with an estimated glomerular filtration rate (eGFR) less than 90 mL/min/1.73 m2and proteinuria were recruited from Mei Jau Health Institute between 2008 and 2010. The kidney function-related dietary pattern was identified using reduced rank regression (RRR) and was known as high consumption of preserved or processed food, meat, organ meats, rice/flour products, and, low consumption of fruit, dark-colored vegetables, bread, and beans. A multivariable logistic regression analysis was used to identify the association of weight status and cardiovascular risk factors with moderately/severely impaired kidney function (eGFR < 60 mL/min/1.73 m2) and the association of dietary pattern with the outcomes aforementioned.
Results:Moderately/severely impaired kidney function participants were heavier and had higher abnormality of cardiovascular risk factors compared with those with mildly impaired kidney function. Weight status (OR = 1.28, 95% CI 1.12–1.45,P< 0.001 for obesity) and cardiovascular risk factors (OR = 1.52, 95% CI 1.31–1.77,P< 0.001 for high total cholesterol/HDL-C ratio and OR = 1.56, 95% CI 1.41–1.72,P< 0.001 for hypercalcemia) were positively associated with increased risk of moderately/severely impaired kidney function. The kidney function-related dietary pattern was correlated with overweight or obese (OR = 2.07, 95% CI 1.89–2.27,P< 0.01) weight status, increased cardiovascular risk by 10–31%, and the risk of moderately/severely impaired kidney function (OR = 1.15, 95% CI 1.02–1.29,P< 0.05).
(Continued on next page)
© The Author(s). 2019Open AccessThis article is distributed under the terms of the Creative Commons Attribution 4.0 International License (http://creativecommons.org/licenses/by/4.0/), which permits unrestricted use, distribution, and reproduction in any medium, provided you give appropriate credit to the original author(s) and the source, provide a link to the Creative Commons license, and indicate if changes were made. The Creative Commons Public Domain Dedication waiver (http://creativecommons.org/publicdomain/zero/1.0/) applies to the data made available in this article, unless otherwise stated. * Correspondence:[email protected]
1
School of Nutrition and Health Sciences, College of Nutrition, Taipei Medical University, 250 Wu-Hsing Street, Taipei 110, Taiwan
3Master Program in Global Health and Development, College of Public
(Continued from previous page)
Conclusions:The RRR-derived kidney function-related dietary pattern, characterized by high intake of processed and animal foods and low intake of plant foods, predicts the risks for developing cardiovascular disease and moderately/ severely impaired kidney function among middle-aged and older adults.
Keywords:Dietary pattern, Reduced rank regression, Weight status, Cardiovascular risk factors, Kidney function
Introduction
Chronic kidney disease (CKD), characterized by impaired kidney function, has surfaced as a global health problem. In Taiwan, the prevalence of CKD stage 1–5 in 2007 was 9.8–11.9%, meaning more than 1.5 million individuals suf-fered from CKD [1]. Cardiovascular disease (CVD) is an adverse outcome of kidney disease and is associated with increased major causes of mortality and morbidity [2]. A population-based prospective cohort study in Iceland re-ported that adjusted hazard ratio (HR) for CVD was 1.55 to 4.29 in CKD stage 1 to 4 [3], and thus CKD was associ-ated with increased risk for CVD mortality by 100% (HR = 2.00, 95% CI 1.78–2.25) [4]. The traditional risk factors for CVD including hypertension, diabetes, lipid abnormal-ities, and obesity have been known as important determi-nants for the risk of developing CVD in patients with CKD [5,6]. Moreover, abnormal calcium and phosphorus metabolism represented as non-traditional CVD risk fac-tors. Both high calcium and phosphorus levels can directly increase vascular calcification [7]. This alteration in min-eral metabolism characterized by hypercalcemia and ele-vated serum phosphate levels are common in patients with CKD and may lead to calcification and other cardio-vascular events [8]. However, few studies in Taiwan have investigated whether abnormal weight status and both traditional as well as non-traditional CVD risk factors are associated with the severity of impaired kidney function.
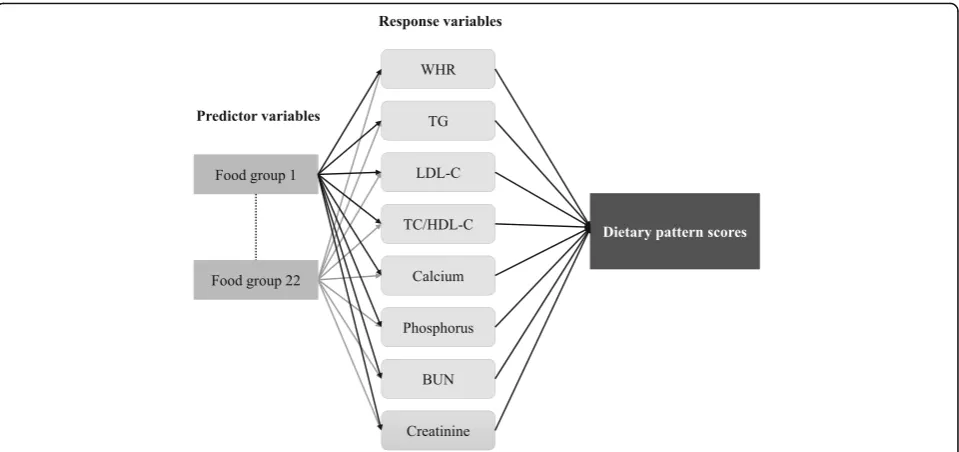
In addition, diet also have been associated with cardiovas-cular risk factors and other health-related outcomes. A healthy dietary pattern, characterized by high consumption of whole grains, fruit, vegetables, and unsaturated oil, was correlated with reduced cardiovascular risk factors and increased kidney function [9, 10]. In contrast, a western dietary pattern with high consumption of deep-fried foods, processed foods, meat, and organ meats was positively associated with increased cardiovascular risk factors and progression of CKD [11,12]. In this study, we used reduced rank regression (RRR) [13] to derive kidney function-related dietary pattern. The RRR method is a multivariable linear functions where it combines a priori and a posteriori approaches to derive dietary patterns [14]. Recently, RRR has been widely used to assess dietary patterns in several studies [15–17]. By using this method, researchers are able to identify a linear combination of predictor variables, select response variables based on prior
knowledge, and find dietary patterns related to the disease of interest [13,14]. Food items or food groups derived from food frequency questionnaire (FFQ) have been used as pre-dictor variables, while response variables refer to nutrients or blood biomarkers as early predictors of a disease [13,
14]. Additionally, compared with other method for deriving dietary patterns such as principal component analysis (PCA), the RRR method is more likely to be associated with health-related outcomes [13, 18, 19]. To our knowledge, there is no study using RRR to derive dietary patterns that are associated with kidney function. Therefore, the aims of this study were to (1) investigate the association of abnor-mal weight status and cardiovascular risk factors with the severity of impaired kidney function and (2) identify whether RRR-derived kidney function-related dietary pat-tern is associated with abnormal weight status, cardiovascu-lar risk factors, and the severity of impaired kidney function among middle-aged and older participants with CKD.
Methods
Study participants
This study was conducted using health-screening data from Mei Jau (MJ) Health Institute, Taiwan. The MJ Health Insti-tute is a private instiInsti-tute with four health-screening centers (Taipei, Taoyuan, Taichung, and Kaohsiung) in Taiwan, and it provides periodic health check-up (on average one exam-ination per year per person) to its members. All participants had a series of health check-up including anthropometric assessment, blood tests, stool and urine tests, physical examination, and completed a self-reported questionnaire to collect information about sociodemographic, lifestyle, medical history as well as dietary habits. In addition, every participant had signed the consent form authorized by the MJ Health Institute for research purpose only and no personal identification information would be released. The Joint Institutional Review Board of Taipei Medical Univer-sity (TMU-JIRB N201802006) approved this study.
Data collection
autoimmune disease, or virus infection (n= 48,169), (3) with history of kidney surgery (n= 1765), (4) with error re-sults in blood analysis (n= 1128), (5) failed to complete the questionnaire (n= 212), (6) with missing data in diet-ary habit (n= 11,184), or (7) with multiple entries in the database (n= 8554), a total of 41,128 participants were in-cluded in this study.
Clinical and biochemical data and definition of the disease
Body weight, height, waist or hip circumference, body fat mass, and blood pressure were measured by an auto-anthropometers during health check-up. Fasting blood glucose (FBG), triglycerides (TG), total cholesterol (TC), high density lipoprotein-cholesterol (HDL-C), low density lipoprotein-cholesterol (LDL-C), C-reactive protein (CRP), blood urea nitrogen (BUN), creatinine, albumin, calcium, and phosphorus were analyzed at the MJ Health Institute’s central laboratory. Body Mass Index (BMI) status was de-fined as follows: normal (18.5 kg/m2≤BMI < 24 kg/m2), overweight (24 kg/m2≤BMI < 27 kg/m2), and obese (BMI
≥27 kg/m2) [20]. High waist circumference was defined as waist circumference≥80 cm for female and≥90 cm for male [21]. High waist-to-hip ratio (WHR) was defined as
≥0.85 for female and≥0.90 for male [21]. High body fat mass was defined as body fat mass≥35% for female and≥ 24% for male [22]. Hypertension was defined as having at least one of the followings: (1) systolic blood pressure (SBP)≥140 mmHg, (2) diastolic blood pressure (DBP)≥90 mmHg, (3) use of antihypertensive medication, or (4) self-reported hypertension [23]. Diabetes was defined as at least one of the followings: (1) FBG≥7.0 mmol/L (≥ 126 mg/dL), (2) use of hypoglycemic medication, or (3) self-reported diabetes [24]. The definition of abnormal blood lipids were TG≥2.3 mmol/L (≥200 mg/dL) for high TG, TC≥6.2 mmol/L (≥ 240 mg/dL) and/or use of lipid-lowering drugs for high TC, HDL-C < 1.0 mmol/L (< 40 mg/dL) for low HDL-C, LDL-C≥4.1 mmol/L (≥ 160 mg/dL) and/or use of lipid-lowering drugs for high LDL-C [25], and TC-to-HDL-C ratio (TC/HDL-C ratio)≥5.0 for high TC/HDL-C ratio [26].
Proteinuria was reported as one or more pluses (+). We used the Modification of Diet in Renal Disease Study (MDRD) equation to calculate eGFR as an indicator of kidney function [27]:
eGFR¼186:3ðserum creatinine in mg=dLÞ‐1:154 ðageÞ‐0:203ð0:742 if femaleÞ
Moreover, based on eGFR levels, we further classified paired kidney function into two categories: (1) mildly im-paired (stage 2) defined as eGFR at 60–89 mL/min/1.73 m2 and (2) moderately/severely impaired (stage 3–5) defined as eGFR < 60 mL/min/1.73 m2[28]. Hypercalcemia was defined
as serum calcium levels ≥2.37 mmol/L based on National Kidney Foundation guidelines [29], while serum phosphorus levels were categorized into high (≥median) or low (< me-dian) level.
Dietary assessment and other covariates
Dietary assessment was evaluated using a standardized and validated self-administered semi-quantitative food fre-quency questionnaire (SQ-FFQ) [11, 30]. The frequency and servings of dietary intake were investigated according to the consumption of twenty-two food groups at per day or per week in the past month and categorized into five response options as previously described [11]. The other covariates collected using a self-reported questionnaire were age, smoking status (none, former, and current), drinking status (no: < 1 time/week or yes: ≥ 1–2 times/ week), physical activity status (no: < 1 h/week or yes:≥1–2 h/week), medical history of CVD, hypertension, or diabetes, and use of cardiovascular, hypertension, or diabetes medica-tion. High cardiovascular risk profile was defined as having a history of CVD and/or use of cardiovascular medication. However, participants who had been previously diagnosed with CVD might have changed their lifestyle, and thus we decided to adjust for CVD risk profile in the analysis.
Statistical analysis
Statistical analysis was performed by using SAS 9.4 (SAS Institute Inc., Cary, NC, USA) and IBM SPSS 20 (IBM Corp., Armonk, NY, USA). Continuous and categorical var-iables are presented as a mean ± standard deviation (SD) and a number (percentage), respectively. A Mann-Whitney Utest and a chi-square test were used for comparing the baseline characteristics between two continuous and cat-egorical groups, respectively. A multivariable logistic regres-sion analysis, expressed as odds ratios (OR) and 95% confidence intervals (CIs), was performed to identify: (1) the association between weight status and cardiovascular risk factors with moderately/severely impaired kidney function and (2) the association between dietary pattern scores across tertiles with weight status, cardiovascular risk factors, and the severity of impaired kidney function. A P-value < 0.05 was considered statistically significant.
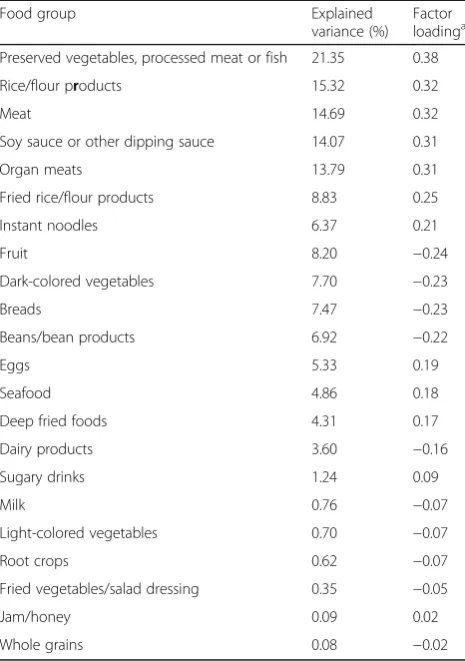
and CRP (Additional file1: Table S1). The absolute value of factor loading≥0.20 were selected to derive dietary pattern associated with kidney function. When eight response vari-ables identified by Spearman’s correlation were included in the RRR, eight dietary factors were derived. Finally, we retained only the first dietary factor for the analysis as it ex-plained the largest amount of variation in response vari-ables. Moreover, RRR allows researchers to identify the percentage of explained variation in each food group corre-sponding to the response variables. This explained variation would contribute to the factor loading in each food group, meaning that food groups with the greater explained vari-ation will produce greater factor loading.
Results
Characteristics of the participants
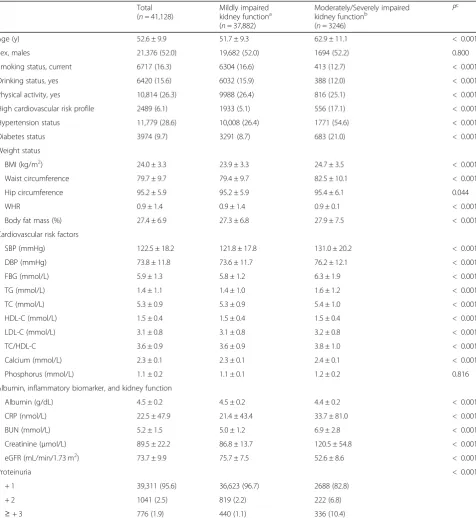
In our study, 37,882 (92.1%) middle-aged and older partici-pants had mildly impaired kidney function and 3246 (7.9%) participants had moderately to severely impaired kidney function. The mean age and eGFR levels were 52.6 ± 9.9 y and 73.7 ± 9.9 mL/min/1.73 m2, respectively. The prevalence rate of overweight, obesity, high waist circumference, high WHR, and high body fat mass were 30.2, 16.7, 24.8, 38.1, and 37.0% respectively (data not shown). The prevalence rate of hypertension, diabetes, high TG, high TC, low HDL-C, high LDL-C, high TC/HDL-C ratio, and hypercalcemia was 28.6, 9.7, 13.7, 18.3, 5.8, 14.2, 8.8, and 36.8%, respectively (data not shown). Moreover, participants with moderately/ severely impaired kidney function were older, heavier, had higher blood pressure, blood glucose, blood lipids, and CRP levels, but lower albumin levels compared with those who had mildly impaired kidney function (Table1).
Weight status and cardiovascular risk factors in relation to the severity of impaired kidney function
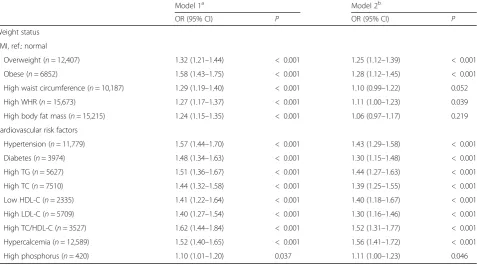
We next investigated the association of weight status and cardiovascular risk factors with the severity of impaired kidney function (Table 2). A fully-adjusted multivariable logistic regression analysis (model 2) showed that partici-pants who were overweight, obese, or had high WHR were significantly associated with a higher risk of moder-ately/severely impaired kidney function (overweight: OR = 1.25, 95% CI 1.12–1.39, P< 0.001, obesity: OR = 1.28, 95% CI 1.12–1.45,P< 0.001, and high WHR: OR = 1.11, 95% CI 1.00–1.23,P= 0.039, respectively) compared with normal weight participants. Meanwhile, high waist cir-cumference only showed the tendency to be associated with the severity of impaired kidney function (P= 0.052). Cardiovascular risk factors were positively associated with moderately/severely impaired kidney function (P< 0.001), and high TC/HDL-C ratio and hypercalcemia had the highest odds ratio among all the risk factors (high TC/ HDL-C: OR = 1.52, 95% CI 1.31–1.77, P< 0.001 and hy-percalcemia: OR = 1.56, 95% CI 1.41–1.72,P< 0.001).
Dietary pattern in relation to weight status,
cardiovascular risk factors, and the severity of impaired kidney function
The RRR-derived kidney function-related dietary pattern showed that food groups such as preserved vegetables, processed meat or fish, rice or flour products, meat, soy sauce, organ meats, fried rice or flour products, and instant noodles were positively correlated with dietary pattern scores (factor loading ≥0.20). In contrast, food groups like fruits, dark-colored vegetables, bread, and beans or bean Fig. 1The dietary pattern derived from the reduced rank regression model. WHR waist-to-hip ratio, TG triglycerides, LDL-C low density
Table 1Characteristics of the participants aged≥40 years old by kidney function status obtained from MJ Health Institute between 2008 and 2010
Total (n= 41,128)
Mildly impaired kidney functiona (n= 37,882)
Moderately/Severely impaired kidney functionb
(n= 3246)
Pc
Age (y) 52.6 ± 9.9 51.7 ± 9.3 62.9 ± 11.1 < 0.001
Sex, males 21,376 (52.0) 19,682 (52.0) 1694 (52.2) 0.800
Smoking status, current 6717 (16.3) 6304 (16.6) 413 (12.7) < 0.001
Drinking status, yes 6420 (15.6) 6032 (15.9) 388 (12.0) < 0.001
Physical activity, yes 10,814 (26.3) 9988 (26.4) 816 (25.1) < 0.001
High cardiovascular risk profile 2489 (6.1) 1933 (5.1) 556 (17.1) < 0.001
Hypertension status 11,779 (28.6) 10,008 (26.4) 1771 (54.6) < 0.001
Diabetes status 3974 (9.7) 3291 (8.7) 683 (21.0) < 0.001
Weight status
BMI (kg/m2) 24.0 ± 3.3 23.9 ± 3.3 24.7 ± 3.5 < 0.001
Waist circumference 79.7 ± 9.7 79.4 ± 9.7 82.5 ± 10.1 < 0.001
Hip circumference 95.2 ± 5.9 95.2 ± 5.9 95.4 ± 6.1 0.044
WHR 0.9 ± 1.4 0.9 ± 1.4 0.9 ± 0.1 < 0.001
Body fat mass (%) 27.4 ± 6.9 27.3 ± 6.8 27.9 ± 7.5 < 0.001
Cardiovascular risk factors
SBP (mmHg) 122.5 ± 18.2 121.8 ± 17.8 131.0 ± 20.2 < 0.001
DBP (mmHg) 73.8 ± 11.8 73.6 ± 11.7 76.2 ± 12.1 < 0.001
FBG (mmol/L) 5.9 ± 1.3 5.8 ± 1.2 6.3 ± 1.9 < 0.001
TG (mmol/L) 1.4 ± 1.1 1.4 ± 1.0 1.6 ± 1.2 < 0.001
TC (mmol/L) 5.3 ± 0.9 5.3 ± 0.9 5.4 ± 1.0 < 0.001
HDL-C (mmol/L) 1.5 ± 0.4 1.5 ± 0.4 1.5 ± 0.4 < 0.001
LDL-C (mmol/L) 3.1 ± 0.8 3.1 ± 0.8 3.2 ± 0.8 < 0.001
TC/HDL-C 3.6 ± 0.9 3.6 ± 0.9 3.8 ± 1.0 < 0.001
Calcium (mmol/L) 2.3 ± 0.1 2.3 ± 0.1 2.4 ± 0.1 < 0.001
Phosphorus (mmol/L) 1.1 ± 0.2 1.1 ± 0.1 1.2 ± 0.2 0.816
Albumin, inflammatory biomarker, and kidney function
Albumin (g/dL) 4.5 ± 0.2 4.5 ± 0.2 4.4 ± 0.2 < 0.001
CRP (nmol/L) 22.5 ± 47.9 21.4 ± 43.4 33.7 ± 81.0 < 0.001
BUN (mmol/L) 5.2 ± 1.5 5.0 ± 1.2 6.9 ± 2.8 < 0.001
Creatinine (μmol/L) 89.5 ± 22.2 86.8 ± 13.7 120.5 ± 54.8 < 0.001
eGFR (mL/min/1.73 m2) 73.7 ± 9.9 75.7 ± 7.5 52.6 ± 8.6 < 0.001
Proteinuria < 0.001
+ 1 39,311 (95.6) 36,623 (96.7) 2688 (82.8)
+ 2 1041 (2.5) 819 (2.2) 222 (6.8)
≥+ 3 776 (1.9) 440 (1.1) 336 (10.4)
BMI body mass index, WHR waist-to-hip ratio, SBP systolic blood pressure, DBP diastolic blood pressure, FBG fasting blood glucose, TG triglycerides, TC total cholesterol, HDL-C high density lipoprotein-cholesterol, LDL-C low density lipoprotein-cholesterol, TC/HDL-C total cholesterol-to-HDL-C ratio, CRP C-reactive protein, BUN blood urea nitrogen, eGFR estimated glomerular filtration rate. Continuous data are presented as mean ± SD, and categorical data are presented as numbers (percentage)
a
Mildly impaired kidney function was defined as eGFR 60–89 mL/min/1.73 m2 b
Moderately/severely impaired kidney function was defined as eGFR < 60 mL/min/1.73 m2 c
products were negatively correlated with dietary pattern scores (factor loading ≥ −0.20) (Table3). The cumulative percentage of variation explained by RRR-derived kidney function-related dietary pattern was 6.67%. The eight re-sponse variables were explained 2.7% for the total variation and largely driven by the explained variation in WHR (6.7%), TC/HDL-C ratio (2.6%), and TG (2.2%). The base-line characteristics of the participants across tertiles of diet-ary pattern scores are shown in Additional file2: Table S2. Participants with higher adherence to the dietary pattern were likely to be males, younger, current smokers and drinkers, inactive, heavier, hypertensive or diabetic, and with abnormal blood lipid levels.
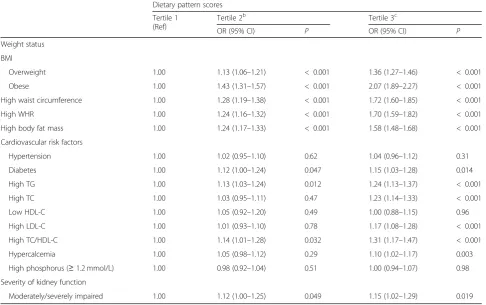
The kidney function-related dietary pattern scores across tertiles in relation to weight status, cardiovascular risk fac-tors, and the severity of impaired kidney function are dem-onstrated in Table 4. A multivariable logistic regression analysis demonstrated that participants who showed higher adherence to the dietary pattern (tertile 2 and tertile 3 of dietary pattern scores) were strongly associated with in-creased overweight (tertile 2: OR = 1.13, 95% CI 1.06–1.21, tertile 3: OR = 1.36, 95% CI 1.27–1.46, P all < 0.001) and obesity (tertile 2: OR = 1.43, 95% CI 1.31–1.57, tertile 3: OR = 2.07, 95% CI 1.89–2.27,Pall < 0.001) risk by 13–36% and 43–107%, respectively. Participants in tertile 3 of dietary
pattern scores were also positively associated with all the car-diovascular risk factors except for hypertension (OR = 1.04, 95% CI 0.96–1.12,P= 0.31), low HDL-C (OR = 1.00, 95% CI 0.88–1.15, P= 0.96) and high serum phosphorus levels (≥ 1.2 mmol/L) (OR = 1.00, 95% CI 0.94–1.07, P= 0.98). Furthermore, the dietary pattern scores of tertile 2 and tertile 3 were significantly associated with a higher risks of moder-ately/severely impaired kidney function (tertile 2: OR = 1.12, 95% CI 1.00–1.25, P< 0.05, tertile 3: OR = 1.15, 95% CI 1.02–1.29,P< 0.05) and having BUN≥7.14 mmol/L (tertile 2: OR = 1.31, 95% CI 1.16–1.47, P< 0.001, tertile 3: OR = 1.32, 95% CI 1.18–1.49,P< 0.001) (data not shown).
Discussion
To our knowledge, the present study is the first study that identify kidney function-related dietary pattern by using RRR. Overall, we found that kidney function-related diet-ary pattern was correlated with increased obesity risk and exacerbation of cardiovascular risk factors. In this dietary pattern, the food groups containing preserved or proc-essed foods, meat, organ meats, and sauces contributed to 64% explained variation. Adding soy sauce or other sauces to preserve or process foods and meat is common in Tai-wanese’s culture. Consistent with our study, a diet rich in meat and processed foods was associated with increased
Table 2Multivariable logistic regression of weight status and cardiovascular risk factors for moderately/severely impaired kidney function
Model 1a Model 2b
OR (95% CI) P OR (95% CI) P
Weight status
BMI, ref.: normal
Overweight (n= 12,407) 1.32 (1.21–1.44) < 0.001 1.25 (1.12–1.39) < 0.001
Obese (n= 6852) 1.58 (1.43–1.75) < 0.001 1.28 (1.12–1.45) < 0.001
High waist circumference (n= 10,187) 1.29 (1.19–1.40) < 0.001 1.10 (0.99–1.22) 0.052
High WHR (n= 15,673) 1.27 (1.17–1.37) < 0.001 1.11 (1.00–1.23) 0.039
High body fat mass (n= 15,215) 1.24 (1.15–1.35) < 0.001 1.06 (0.97–1.17) 0.219
Cardiovascular risk factors
Hypertension (n= 11,779) 1.57 (1.44–1.70) < 0.001 1.43 (1.29–1.58) < 0.001
Diabetes (n= 3974) 1.48 (1.34–1.63) < 0.001 1.30 (1.15–1.48) < 0.001
High TG (n= 5627) 1.51 (1.36–1.67) < 0.001 1.44 (1.27–1.63) < 0.001
High TC (n= 7510) 1.44 (1.32–1.58) < 0.001 1.39 (1.25–1.55) < 0.001
Low HDL-C (n= 2335) 1.41 (1.22–1.64) < 0.001 1.40 (1.18–1.67) < 0.001
High LDL-C (n= 5709) 1.40 (1.27–1.54) < 0.001 1.30 (1.16–1.46) < 0.001
High TC/HDL-C (n= 3527) 1.62 (1.44–1.84) < 0.001 1.52 (1.31–1.77) < 0.001
Hypercalcemia (n= 12,589) 1.52 (1.40–1.65) < 0.001 1.56 (1.41–1.72) < 0.001
High phosphorus (n= 420) 1.10 (1.01–1.20) 0.037 1.11 (1.00–1.23) 0.046
BMIbody mass index,WHRwaist-to-hip ratio,TGtriglycerides,TCtotal cholesterol,HDL-Chigh density lipoprotein-cholesterol,LDL-Clow density lipoprotein-cholesterol,TC/HDL-Ctotal cholesterol-to-HDL-C ratio
a
Model 1 was adjusted for age and gender (for weight status category). For cardiovascular risk factors category, model 1 was adjusted for age, gender, and BMI b
body weight in Asian and US adults [31,32]. Meat, proc-essed foods, and organ meats are commonly high in calo-ries, saturated fat, and cholesterol, which may contribute to a surplus of energy intake. We also found that partici-pants who ate preserved or processed foods, meat, organ meats, and sauces were also likely to consume rice or flour products and noodles. Similar studies conducted in Ko-rean and Japanese population reported that diet rich in white rice was correlated with high risk of obesity [33,34]. However, Xu and colleagues found an inverse association between the traditional Chinese dietary pattern, character-ized by high intake of rice and pork, with the risk of obes-ity [35]. The conflicting findings might be due to the different food groups in the dietary pattern, lifestyle, and eating behavior in China. In our study, more than 70% of participants were physically inactive, which may also con-tribute to these different results. In addition, a recent popu-lation study in adults has reported that 1 SD increment of fruits and vegetables intake was inversely associated with BMI by 0.12 kg/m2, waist circumference by 0.40 cm, and percentage fat mass by 0.30% [36]. Fruits and vegetables are
commonly known to have a higher amount of dietary fiber, phytochemicals, vitamins, and minerals, which may en-hance satiety and lead to a lower energy absorption. In addition, fruits and vegetables also have anti-oxidative ef-fects against obesity-induced oxidative stress [36]. However, our RRR derived kidney function-related dietary pattern was characterized by a low fruits and vegetables intake and this may increase the risk of obesity.
Our study reported that kidney function-related dietary pattern was correlated with an increased abnormality of most cardiovascular risk factors, except for hypertension, low HDL-C, and high serum phosphorus levels. The rela-tionship between dietary pattern and hypertension or high serum phosphorus levels was weakened by potential con-founders after adjusting for covariates in model 2; how-ever, it remains positively correlated after adjusting for age, sex, and BMI (tertile 3: OR = 1.07, 95% CI 1.01–1.14, P< 0.05 for hypertension and OR = 1.06, 95% CI 1.01– 1.12, P< 0.05 for high phosphorus levels). Other studies have found that dietary pattern consisting of high con-sumption in animal fat, processed meat, organ meats, or refined carbohydrate was positively associated with cardio-vascular risk factors [11, 37, 38]. An imbalance between saturated and unsaturated fats and low fiber content in the animal food, together with high salt content in proc-essed food, could have an influence over blood lipids, blood pressure, and blood glucose levels [38]. In compari-son, a healthy dietary pattern with high intakes of whole grains, fruits, and vegetables was found to reduce TC by 0.07 mmol/L, LDL-C by 0.05 mmol/L, TG by 0.22 mmol/ L, and increase HDL-C by 0.01 mmol/L in the study of multi-ethnic Asian people [9]. Another study conducted in a Korean adult population reported that an increased dietary fat intake (% of energy) was associated with in-creased TC and LDL-C levels but inversely associated with the risk of having low HDL-C and high TG levels [39]. In contrast, dietary carbohydrate intake (% of energy) was positively correlated with increased TG and low HDL-C levels [37,39], but negatively correlated with increased TC and LDL-C levels [39]. Our RRR-derived kidney function-related dietary pattern was characterized by high intake of both fat and carbohydrate, and this might be the reason that there was no association between this dietary pattern and low HDL-C levels. Taken altogether, our find-ings suggest that kidney function-related dietary pattern may alter blood lipid profile and glucose metabolism, and thus may lead to increase cardiovascular disease risk.
In the present study, RRR-derived kidney function-related dietary pattern increased moderately/se-verely impaired kidney function risk by 12–15%. Similarly, recent studies also stated that red meat, processed meat, saturated fat, and refined carbohydrate were associated with rapid eGFR decline and kidney failure [12, 40, 41]. Meat, processed foods, and refined carbohydrate are foods high in
Table 3Factor loadings and variance of dietary pattern scores identified by the reduced rank regression model
Food group Explained
variance (%) Factor loadinga
Preserved vegetables, processed meat or fish 21.35 0.38
Rice/flour products 15.32 0.32
Meat 14.69 0.32
Soy sauce or other dipping sauce 14.07 0.31
Organ meats 13.79 0.31
Fried rice/flour products 8.83 0.25
Instant noodles 6.37 0.21
Fruit 8.20 −0.24
Dark-colored vegetables 7.70 −0.23
Breads 7.47 −0.23
Beans/bean products 6.92 −0.22
Eggs 5.33 0.19
Seafood 4.86 0.18
Deep fried foods 4.31 0.17
Dairy products 3.60 −0.16
Sugary drinks 1.24 0.09
Milk 0.76 −0.07
Light-colored vegetables 0.70 −0.07
Root crops 0.62 −0.07
Fried vegetables/salad dressing 0.35 −0.05
Jam/honey 0.09 0.02
Whole grains 0.08 −0.02
a
dietary acid load [42]. A high dietary acid load is known to be related to the progression of CKD and end-stage renal disease [43]. On the other hand, a diet high in plant protein, fruits, and vegetables is commonly known as an alkaline diet, and this type of diet was associated with reduce renal acid load and kidney injury [44]. Our RRR-derived kidney function-related dietary pattern was low in fruits, vegeta-bles, and beans consumption, which explained the positive association between dietary pattern and the severity of im-paired kidney function.
Furthermore, overweight or obese weight status and all cardiovascular risk factors were positively correlated with moderately/severely impaired kidney function. Abdominal adiposity has been suggested to play a crucial role in exacer-bating kidney disease by stimulating chronic inflammation or endocrine dysfunction [45]. In contrast, a recent study in Taiwan reported that CKD patients with overweight or obese status was not significantly associated with decline in eGFR [46]. Another study in South Korea found that either obesity or central obesity was associated with increased risk
of stage 3a CKD, but not significantly correlated with in-creased risk of advanced stage 4/5 CKD [45]. Both studies suggested that waist circumference or central obesity might be a better predictor for the risk of obesity-related disease [45,46]. BMI alone is insufficient to indicate central obesity due to the variations in individual’s body composition. How-ever, our study found that BMI (P< 0.001), waist circumfer-ence (P= 0.052), and WHR (P= 0.039) were associated with advanced impaired kidney function. Our results also suggest that cardiovascular risk factors were correlated with in-creased moderately/severely impaired kidney function risk by 11–56%. Consistent with our results, hypertension, dia-betes, and abnormal lipid profile were independent risk fac-tors to develop severe CKD stages [47–49]. Moreover, hypercalcemia is considered as cardiovascular risk factors because elevated serum calcium levels accelerated vascular calcification and were associated with increased mortality in CKD patients [8, 50]. Thus, hypercalcemia explained the highest odds ratio (OR = 1.56) in relation to moderately/se-verely impaired kidney function risk in our study.
Table 4The association of dietary pattern scores with weight status, cardiovascular risk factors, and the severity of impaired kidney function (n= 41,128)a
Dietary pattern scores
Tertile 1 (Ref)
Tertile 2b Tertile 3c
OR (95% CI) P OR (95% CI) P
Weight status
BMI
Overweight 1.00 1.13 (1.06–1.21) < 0.001 1.36 (1.27–1.46) < 0.001
Obese 1.00 1.43 (1.31–1.57) < 0.001 2.07 (1.89–2.27) < 0.001
High waist circumference 1.00 1.28 (1.19–1.38) < 0.001 1.72 (1.60–1.85) < 0.001
High WHR 1.00 1.24 (1.16–1.32) < 0.001 1.70 (1.59–1.82) < 0.001
High body fat mass 1.00 1.24 (1.17–1.33) < 0.001 1.58 (1.48–1.68) < 0.001
Cardiovascular risk factors
Hypertension 1.00 1.02 (0.95–1.10) 0.62 1.04 (0.96–1.12) 0.31
Diabetes 1.00 1.12 (1.00–1.24) 0.047 1.15 (1.03–1.28) 0.014
High TG 1.00 1.13 (1.03–1.24) 0.012 1.24 (1.13–1.37) < 0.001
High TC 1.00 1.03 (0.95–1.11) 0.47 1.23 (1.14–1.33) < 0.001
Low HDL-C 1.00 1.05 (0.92–1.20) 0.49 1.00 (0.88–1.15) 0.96
High LDL-C 1.00 1.01 (0.93–1.10) 0.78 1.17 (1.08–1.28) < 0.001
High TC/HDL-C 1.00 1.14 (1.01–1.28) 0.032 1.31 (1.17–1.47) < 0.001
Hypercalcemia 1.00 1.05 (0.98–1.12) 0.29 1.10 (1.02–1.17) 0.003
High phosphorus (≥1.2 mmol/L) 1.00 0.98 (0.92–1.04) 0.51 1.00 (0.94–1.07) 0.98
Severity of kidney function
Moderately/severely impaired 1.00 1.12 (1.00–1.25) 0.049 1.15 (1.02–1.29) 0.019
BMIbody mass index,WHRwaist-to-hip ratio,TGtriglycerides,TCtotal cholesterol,HDL-Chigh density lipoprotein-cholesterol,LDL-Clow density lipoprotein-cholesterol, TC/HDL-C total cholesterol-to-HDL-C ratio
a
Adjusted for model 2. Weight status category was adjusted for age, gender, smoking status, drinking status, physical activity, high cardiovascular risk profile, hypertension status, diabetes status, albumin, and CRP. Cardiovascular risk factors and the severity of kidney function categories were adjusted for age, gender, BMI, smoking status, drinking status, physical activity, high cardiovascular risk profile, hypertension status (except hypertension variable), diabetes status (except diabetes variable), albumin, and CRP. Tertile 1 (dietary pattern score:−1.34-1.22,n= 13,769) was used for the reference
b
Tertile 2 (dietary pattern scores: 1.23–1.89,n= 13,656) c
The strength of this study is that we used RRR to de-rive kidney function-related dietary pattern. The RRR method, which is an advanced method to identify a diet-and-disease relationship, can generate potential me-diators between dietary pattern and the disease of inter-est. Compared with factor analysis, patterns derived from RRR is more likely to be associated with the dis-ease of interest because the patterns are driven by disease-specific responses [19]. The RRR model may ex-tract dietary pattern scores by maximizing the explained variation in the biomarkers for a specific diet-related dis-ease [51]. In comparison, PCA focuses only to explain the total variation in intake of food groups and does not provide an explanation of the variation in important bio-markers [13]. Additionally, the RRR method allows re-searchers to identify the percentage variation from predictor variables and response variables, which both contributing to the dietary factor. Extracted factor scores can be evaluated by their corresponding response scores and by the explained variation in predictor variables. Thus, the association between food groups and response variables can be used to interpret the beneficial effects of individual food group as components of predictor vari-ables in the dietary pattern [13]. However, this method requires prior knowledge to select intermediate biomarkers-related disease. Selecting response variables can be personally subjective and may not completely re-flect the current state of knowledge. Thus, it may result in different patterns in different studies. Meanwhile, our study has several limitations. First, the cross-sectional study design cannot establish a causal relationship and it only shows a condition of one point-in-time. Hence, the possibility of reversed causation also exists. Future stud-ies using prospective cohort or randomized trial designs are needed to explain and confirm a causal relationship between kidney function-related dietary patterns and cardiovascular risk factors. Second, relatively lower num-ber of the participants with moderately or severely im-paired kidney function compared to those with mildly impaired kidney function. Third, a self-reported FFQ may have some reporting bias, errors, and only provides information on habitual food consumption but cannot provide accurate information on actual nutrient intake for an individual. Fourth, the clinical definition of CKD is either decreased kidney function (eGFR < 60 mL/min/ 1.73 m2
) in the absence of persistent albuminuria or hav-ing kidney damage (albumin-creatinine ratio > 30 mg/g), which presents for 3 months or more. Although, MJ Health Institute provided periodic health check-up (on average one examination per year per person) for its members, but not all participants had the annual exam-ination and the clinical diagnosis of CKD cannot be made based on single measurement only. Therefore, the results found in this study may not truly represent the
clinically diagnosed CKD participants. Finally, we have adjusted our results with some potential confounders. However, there are still some confounders that should be considered in the future study such as energy and protein intake and the use of renal medications, which can influence the findings of the present study.
Conclusion
In conclusion, our findings suggest that kidney function-related dietary pattern with high intake of preserved or processed foods, meat, organ meats, rice/flour products, and instant noodles but low intake of fruit, vegetables, bread, and beans was positively correlated with abnormal weight status and cardiovascular risk factors. This type of dietary pattern may further increase the risk of cardiovascular dis-ease and the severity of impaired kidney function.
Additional files
Additional file 1:Table S1.Adjusted Spearman’s correlation coefficient (r) between the variables and estimated glomerular filtration ratea. (DOCX 24 kb)
Additional file 2:Table S2.Baseline characteristics of participants across tertiles of dietary pattern scoresa. (DOCX 19 kb)
Abbreviations
BMI:body mass index; BUN: blood urea nitrogen; CKD: chronic kidney disease; CRP: C-reactive protein; CVD: cardiovascular disease; DBP: diastolic blood pressure; eGFR: estimated glomerular filtration rate; FBG: fasting blood glucose; HDL-C: high density lipoprotein-cholesterol; LDL-C: low density lipoprotein-cholesterol; RRR: reduced rank regression; SBP: systolic blood pressure; TC: total cholesterol; TC/HDL-C: total cholesterol-to-HDL-C ratio; TG: triglycerides; WHR: waist-to-hip ratio
Acknowledgements
The authors thank to Mei Jau Health Institute for collecting and providing their database available for this study.
Funding
This research received no external funding.
Availability of data and materials
The data that support the findings of this study are available from Mei Jau (MJ) Health Institute, but restricted for research use only. The data are not publicly available. Data are available from the authors upon reasonable request and with permission of MJ Health Institute.
Authors’contributions
ALK and JCJC conceived and designed the study; CYH and HHR managed the dataset and retrieved the data; ALK analyzed and interpreted the data; ALK and JCJC wrote the manuscript. All authors have read and approved the final manuscript.
Ethics approval and consent to participate
The study was approved by the Taipei Medical University-Joint Institutional Review Board (TMU-JIRB) no. 201802006. All the participants signed a written informed consent authorized by Mei Jau (MJ) Health Institute.
Consent for publication
Competing interests
The authors declare no conflict of interest.
Publisher’s Note
Springer Nature remains neutral with regard to jurisdictional claims in published maps and institutional affiliations.
Author details
1School of Nutrition and Health Sciences, College of Nutrition, Taipei Medical
University, 250 Wu-Hsing Street, Taipei 110, Taiwan.2Department of Information Management, National Taipei University of Nursing and Health Sciences, 365 Ming-Te Road, Peitou District, Taipei 112, Taiwan.3Master Program in Global Health and Development, College of Public Health, Taipei Medical University, 250 Wu-Hsing Street, Taipei 110, Taiwan.4Joint Commission of Taiwan. 31 Sec.2 Sanmin Road, Banqiao District, New Taipei City 220, Taiwan.5Nutrition Research Center, Taipei Medical University Hospital, 252 Wu-Hsing Street, Taipei 110, Taiwan.
Received: 22 November 2018 Accepted: 28 March 2019
References
1. Hwang SJ, Tsai JC, Chen HC. Epidemiology, impact and preventive care of chronic kidney disease in Taiwan. Nephrology. 2010;15:3–9.
2. Menon V, Gul A, Sarnak MJ. Cardiovascular risk factors in chronic kidney disease. Kidney Int. 2005;68:1413–8.
3. Di Angelantonio E, Chowdhury R, Sarwar N, Aspelund T, Danesh J, Gudnason V. Chronic kidney disease and risk of major cardiovascular disease and non-vascular mortality: prospective population based cohort study. Br Med J. 2010;341:c4986.
4. Wen CP, Cheng TY, Tsai MK, Chang YC, Chan HT, Tsai SP, et al. All-cause mortality attributable to chronic kidney disease: a prospective cohort study based on 462 293 adults in Taiwan. Lancet. 2008;371:2173–82.
5. Parikh NI, Hwang SJ, Larson MG, Meigs JB, Levy D, Fox CS. Cardiovascular disease risk factors in chronic kidney disease: overall burden and rates of treatment and control. Arch Intern Med. 2006;166:1884–91.
6. Fan HM, Li XL, Zheng L, Chen XL, Lan Q, Wu H, et al. Abdominal obesity is strongly associated with cardiovascular disease and its risk factors in elderly and very elderly community-dwelling Chinese. Sci Rep. 2016;6:21521. 7. Dhingra R, Sullivan LM, Fox CS, Wang TJ, D'Agostino RB, Gaziano JM, et al.
Relations of serum phosphorus and calcium levels to the incidence of cardiovascular disease in the community. Arch Intern Med. 2007;167:879–85. 8. Shanahan CM, Crouthamel MH, Kapustin A, Giachelli CM. Arterial
calcification in chronic kidney disease: key roles for calcium and phosphate. Circ Res. 2011;109:697–711.
9. Whitton C, Rebello SA, Lee J, Tai ES, van Dam RM. A healthy asian a posteriori dietary pattern correlates with a priori dietary patterns and is associated with cardiovascular disease risk factors in a multiethnic Asian population. J Nutr. 2018;148:616–23.
10. Hsu CC, Jhang HR, Chang WT, Lin CH, Shin SJ, Hwang SJ, et al. Associations between dietary patterns and kidney function indicators in type 2 diabetes. Clin Nutr. 2014;33:98–105.
11. Muga MA, Owili PO, Hsu CY, Rau HH, Chao JCJ. Association between dietary patterns and cardiovascular risk factors among middle-aged and elderly adults in Taiwan: a population-based study from 2003 to 2012. PLoS One. 2016;11:e0157745.
12. Paterson EN, Neville CE, Silvestri G, Montgomery S, Moore E, Silvestri V, et al. Dietary patterns and chronic kidney disease: a cross-sectional association in the Irish Nun eye study. Sci Rep. 2018;8:6654.
13. Hoffmann K, Schulze MB, Schienkiewitz A, Nothlings U, Boeing H. Application of a new statistical method to derive dietary patterns in nutritional epidemiology. Am J Epidemiol. 2004;159:935–44.
14. Weikert C, Schulze MB. Evaluating dietary patterns: the role of reduced rank regression. Curr Opin Clin Nutr Metab Care. 2016;19:341–6.
15. Barbaresko J, Siegert S, Koch M, Aits I, Lieb W, Nikolaus S, et al. Comparison of two exploratory dietary patterns in association with the metabolic syndrome in a northern German population. Br J Nutr. 2014;112:1364–72. 16. Miki T, Kochi T, Kuwahara K, Eguchi M, Kurotani K, Tsuruoka H, et al. Dietary
patterns derived by reduced rank regression (RRR) and depressive symptoms in Japanese employees: the Furukawa nutrition and health study. Psychiatry Res. 2015;229:214–9.
17. Frank LK, Jannasch F, Kröger J, Bedu-Addo G, Mockenhaupt FP, Schulze MB, et al. A dietary pattern derived by reduced rank regression is associated with type 2 diabetes in an urban Ghanaian population. Nutrients. 2015;7: 5497–514.
18. Nettleton JA, Steffen LM, Schulze MB, Jenny NS, Barr RG, Bertoni AG, et al. Associations between markers of subclinical atherosclerosis and dietary patterns derived by principal components analysis and reduced rank regression in the multi-ethnic study of atherosclerosis (MESA). Am J Clin Nutr. 2007;85:1615–25.
19. Manios Y, Kourlaba G, Grammatikaki E, Androutsos O, Ioannou E, Roma-Giannikou E. Comparison of two methods for identifying dietary patterns associated with obesity in preschool children: the GENESIS study. Eur J Clin Nutr. 2010;64:1407–14.
20. Department of Health, Executive Yuan, R.O.C. (Taiwan). Identification, evaluation, and treatment of overweight and obesity in adults in Taiwan. Taipei: Department of Health, Executive Yuan, R.O.C. (Taiwan); 2003. 21. World Health Organization. Waist circumference and waist-hip ratio: report
of a WHO expert consultation, Geneva, 8–11 December 2008. Geneva: World Health Organization; 2011. p. 27–8.
22. Gallagher D, Heymsfield SB, Heo M, Jebb SA, Murgatroyd PR, Sakamoto Y. Healthy percentage body fat ranges: an approach for developing guidelines based on body mass index. Am J Clin Nutr. 2000;72:694–701.
23. Giles TD, Materson BJ, Cohn JN, Kostis JB. Definition and classification of hypertension: an update. J Clin Hypertens (Greenwich). 2009;11:611–4. 24. American Diabetes Association. Diagnosis and classification of diabetes
mellitus. Diabetes Care. 2014;37(Suppl 1):S81–90.
25. Grundy SM, Becker D, Clark LT, Cooper RS, Denke MA, Howard J, et al. Detection, evaluation, and treatment of high blood cholesterol in adults (adult treatment panel iii). Circulation. 2002;106:3143–421.
26. Chang HY, Yeh WT, Chang YH, Tsai KS, Pan WH. Prevalence of dyslipidemia and mean blood lipid values in Taiwan: results from the nutrition and health survey in Taiwan (NAHSIT, 1993-1996). Chin J Physiol. 2002;45:187–97. 27. Levey AS, Coresh J. Chronic kidney disease. Lancet. 2012;379:165–80. 28. Kidney Disease Improving Global Outcome. Chapter 1: definition and
classification of CKD. Kidney Int Suppl. 2013;3:19–62.
29. Bailie GR, Massry SG. Clinical practice guidelines for bone metabolism and disease in chronic kidney disease: an overview. Pharmacotherapy. 2005;25: 1687–707.
30. Lyu LC, Lin CF, Chang FH, Chen HF, Lo CC, Ho HF. Meal distribution, relative validity and reproducibility of a meal-based food frequency questionnaire in Taiwan. Asia Pac J Clin Nutr. 2007;16:766–76.
31. Wang Y, Beydoun MA. Meat consumption is associated with obesity and central obesity among US adults. Int J Obesity. 2009;33:621–8.
32. Cho YA, Shin A, Kim J. Dietary patterns are associated with body mass index in a Korean population. J Am Diet Assoc. 2011;111:1182–6.
33. Kim J, Jo I, Joung H. A rice-based traditional dietary pattern is associated with obesity in Korean adults. J Acad Nutr Diet. 2012;112:246–53. 34. Okubo H, Sasaki S, Murakami K, Kim MK, Takahashi Y, Hosoi Y, et al. Three
major dietary patterns are all independently related to the risk of obesity among 3760 Japanese women aged 18-20 years. Int J Obesity. 2008;32:541–9. 35. Xu XY, Hall J, Byles J, Shi ZM. Dietary pattern is associated with obesity in
older people in China: data from China health and nutrition survey (CHNS). Nutrients. 2015;7:8170–88.
36. Yu ZM, DeClercq V, Cui Y, Forbes C, Grandy S, Keats M, et al. Fruit and vegetable intake and body adiposity among populations in eastern Canada: the Atlantic partnership for tomorrow’s health study. BMJ Open. 2018;8: e018060.
37. Park SH, Lee KS, Park HY. Dietary carbohydrate intake is associated with cardiovascular disease risk in Korean: analysis of the third Korea National Health and nutrition examination survey (KNHANES III). Int J Cardiol. 2010; 139:234–40.
38. Shridhar K, Satija A, Dhillon PK, Agrawal S, Gupta R, Bowen L, et al. Association between empirically derived dietary patterns with blood lipids, fasting blood glucose and blood pressure in adults-the India migration study. Nutr J. 2018;17:15.
39. Song S, Song WO, Song Y. Dietary carbohydrate and fat intakes are differentially associated with lipid abnormalities in Korean adults. J Clin Lipidol. 2017;11:338–47 e333.
41. Lew QLJ, Jafar TH, Koh HWL, Jin AZ, Chow KY, Yuan JM, et al. Red meat intake and risk of ESRD. J Am Soc Nephrol. 2017;28:304–12.
42. Scialla JJ, Anderson CA. Dietary acid load: a novel nutritional target in chronic kidney disease? Adv Chronic Kidney Dis. 2013;20:141–9. 43. Banerjee T, Crews DC, Wesson DE, Tilea AM, Saran R, Rios-Burrows N, et al.
High dietary acid load predicts ESRD among adults with CKD. J Am Soc Nephrol. 2015;26:1693–700.
44. Goraya N, Simoni J, Jo CH, Wesson DE. A comparison of treating metabolic acidosis in CKD stage 4 hypertensive kidney disease with fruits and vegetables or sodium bicarbonate. Clin J Am Soc Nephrol. 2013;8:371–81. 45. Evangelista LS, Cho WK, Kim Y. Obesity and chronic kidney disease: a
population-based study among south Koreans. PLoS One. 2018;13:e0193559. 46. Chang TJ, Zheng CM, Wu MY, Chen TT, Wu YC, Wu YL, et al. Relationship
between body mass index and renal function deterioration among the Taiwanese chronic kidney disease population. Sci Rep. 2018;8:6908. 47. Chang PY, Chien LN, Lin YF, Wu MS, Chiu WT, Chiou HY. Risk factors of
gender for renal progression in patients with early chronic kidney disease. Medicine (Baltimore). 2016;95:e4203.
48. Chen SC, Hung CC, Kuo MC, Lee JJ, Chiu YW, Chang JM, et al. Association of dyslipidemia with renal outcomes in chronic kidney disease. PLoS One. 2013;8:e55643.
49. Shurraw S, Hemmelgarn B, Lin M, Majumdar SR, Klarenbach S, Manns B, et al. Association between glycemic control and adverse outcomes in people with diabetes mellitus and chronic kidney disease a population-based cohort study. Arch Intern Med. 2011;171:1920–7.
50. Kovesdy CP, Kuchmak O, Lu JL, Kalantar-Zadeh K. Outcomes associated with serum calcium level in men with non-dialysis-dependent chronic kidney disease. Clin J Am Soc Nephrol. 2010;5:468–76.
51. Heidemann C, Hoffmann K, Spranger J, Klipstein-Grobusch K, Möhlig M, Pfeiffer A, et al. A dietary pattern protective against type 2 diabetes in the European prospective investigation into Cancer and nutrition