R E S E A R C H
Open Access
Network performance of multiple virtual
machine live migration in cloud federations
Walter Cerroni
Abstract
The idea of pay-per-use computing incarnated by the cloud paradigm is gaining a lot of success, both for
entertainment and business applications. As a consequence, the demand for computing, storage and communication resources to be deployed in data center infrastructures is increasing dramatically. This trend is fostering new forms of infrastructure sharing such as cloud federations, where the excess workload is smartly distributed across multiple data centers, following some kind of mutual agreement among the participating cloud providers. Federated clouds can obtain great advantages from virtualization technologies and, in particular, from multiple virtual machine live migration techniques, which allow to flexibly move bulk workload across heterogeneous computing environments with minimal service disruption. However, a quantitative characterization of the performance of the inter-data center network infrastructure underlying the cloud federation is essential to guarantee user’s quality of service and optimize provider’s resource utilization. The main contribution of this paper is the definition and application of an analytical model for dimensioning inter-data center network capacity in order to achieve some given performance levels, assuming some simple multiple virtual machine live migration strategies. An extensive set of results are provided that allow to understand the impact of the many parameters involved in the design of a cloud federation network. Keywords: Cloud computing; Cross-cloud communication; Inter-data center communication; Virtualization; Virtual machine live migration
1 Introduction
Software applications based on the cloud computing paradigm have become very popular in the last few years, both for entertainment and business purposes, and an increasing number of new services—including entire vir-tual IT infrastructures—are today considered as part of “the Cloud” [1]. Such an idea of the cloud as a ubiq-uitous computing utility has become a reality owing to recent advances in data center (DC) technologies. How-ever, in order to cope with the exponentially increasing number of cloud service subscribers—especially mobile cloud users—more advanced networking infrastructures and technologies are expected to be deployed for both intra-DC and inter-DC communications [2].
Over-provisioning DC processing power may not always be the right answer, as increasing the size of a DC can result in very expensive and energy-demanding operations. For this reason, the emergingfederated cloud
Correspondence: [email protected]
Department of Electrical, Electronic and Information Engineering, University of Bologna, via Venezia 52, 47521 Cesena (FC), Italy
computing model adopts the idea of smartly sharing
the workload across the DC resources of multiple cloud providers, following some kind of mutual agreement [3,4]. However, in order for cloud federations to become current practice, several issues still remain to be solved, among which the correct design of the inter-DC interconnection network by means of suitable communication infrastruc-ture planning to achieve the required level of quality of service (QoS) [5].
The use of virtual machines (VMs) to implement end-user services is one of the key enablers of cloud fed-erations. In fact, decoupling service instances from the underlying processing and storage hardware allows to flexibly deploy any application on any server within any DC, independently of the specific operating system used. One of the main advantages is that a VM can be instan-tiated, cloned, migrated, rolled-back to a previous state without expensive hardware interventions. This is partic-ularly useful in a cloud federation, where VMs can be easily moved from one DC to another as long as hyper-visor compatibility is guaranteed. Live VM migration is an additional feature that allows to move services from
one server/DC to another with minimal disruption to the end-user service availability [6].
Migrating a running VM to a different DC requires to maintain the guest’s network state consistency. Emerging technologies, such as software defined networking (SDN) [7], offer new opportunities to seamlessly migrate virtu-alized environments and their current network states [8]. This is particularly useful when considering groups of cor-related VMs that must be live-migrated together while maintaining reciprocal connectivity. In fact, many multi-tier applications are often executed across multiple VMs [9] (e.g., front-end, business logic and back-end tiers of e-commerce services, or clustered MapReduce computing environments) and the relative services are available to the end-user only when all VMs in the group are active and connected to each other.
The main contribution of this paper is the definition and application of an analytical model to assess the network performance of a federated cloud, specifically assuming some simple multi-VM live migration strategies. The pro-posed model should be intended as a useful design tool to dimension inter-DC network capacity in order to achieve some given performance levels in a cloud federation, tak-ing into account both the cloud provider’s and end-user’s points of view. This paper extends and generalizes a pre-viously published, simpler version of the model [10], and provides an extensive set of results that allow to charac-terize the impact of the many parameters involved in the design of a cloud federation network.
The paper is organized as follows. After a brief look into related work in Section 2, the problem statement and the federated cloud network scenario considered in the model are introduced in Section 3. Then, the main parameters of interest for multiple VM live migration are discussed in Section 4, whereas the proposed Markovian model of the inter-DC network is presented in Section 5. After report-ing extensive numerical results in Section 6, the role of the different cloud federation design parameters is discussed in Section 7. Finally, conclusions are drawn in Section 8.
2 Related work
One of the most relevant advantages of cloud federations is that they act as a single overlay entity across the par-ticipating networks and DCs, thus boosting the capacity of what can be seen by the end-user as a “virtual data center”. However, the distributed nature of these cross-cloud infrastructures makes the network a very critical element for an effective deployment and management of cloud federations, confirming the importance of being able to assess and control the performance of inter-cloud communication resources [11].
The joint effect of computing and network resource availability in distributed cloud systems has been inves-tigated mainly from an optimization perspective. The
importance of revisiting the algorithms for dynamically mapping user-driven virtual resources into physical resources within distributed clouds is highlighted in [12], where an optimal unified resource allocation framework for improving cost efficiency of networked clouds is for-mulated, and efficient heuristics to solve the problem are proposed.
Other works deal with the virtual DC optimization problem, where a set of interconnected VMs must be pro-visioned to the end-user according to a given service level agreement that specifies not only computing and storage requirements, but also bandwidth requirements. Virtual DCs must then be mapped to physical resources follow-ing efficient and bandwidth-aware heuristics, such as the one implemented by SecondNet [13]. More recent algo-rithms and frameworks, such as AppAware [14] and VDC Planner [15], take into account also the effects of VM migration while performing dynamic virtual DC network embedding and consolidation.
A holistic solution to the issue of large-scale, distributed cloud system design is proposed in [16]: the authors for-malize an optimal VM placement strategy aimed at min-imizing both intra-DC resource demand and inter-DC energy consumption. Other related cross-cloud network optimization works include a resilient optical inter-DC infrastructure planning scheme based on dynamic elec-tricity pricing [17] and a framework for joint computing and communication resource allocation targeted at satis-fying green service level agreements [18]. Differently from the aforementioned approaches, the analytic evaluation of cloud federation network performance presented here is not based on linear programming optimization models or related heuristics; instead, it relies on relatively sim-ple closed-form formulas that are more straightforward to compute.
A completely different approach is followed in [19], where an analytical model based on stochastic reward nets is proposed to evaluate the performance of infrastructure-as-a-service cloud systems. The model is scalable and can cope with thousands of resources. It is also flexible to represent different resource management policies and cloud-specific strategies. However, although several per-formance metrics are defined and evaluated to analyze the behavior of a cloud DC, this approach does not provide an effective tool to dimension the inter-cloud network considering both communication and computing resource availability.
strategy [6], which is currently adopted by many virtu-alization systems such as Xen and KVM [20,21]. With pre-copy, the virtual memory is repeatedly copied to the destination while the VM is still running at the source, until the residual number of modified memory pages is small enough to ensure very quick VM pause, transfer and resume. The opposite approach is adopted by the post-copy migration technique [22]: the VM is immediately paused, a minimal processor state is copied, and the VM is quickly resumed at the destination; then, any memory page needed by the running applications is pulled from the source. Post-copy is able to reduce the migration time with respect to pre-copy, as each memory page is transferred only once. However, in case of failure at the destination, the VM state may become unrecoverable.
The file system state consistency during live migration within a local cloud environment is typically ensured by adopting well-established shared storage solutions, such as Network Attached Storage (NAS) and Storage Area Network (SAN). In this case the migrating VMs are attached to the same file system, available at both source and destination hosts, so that there is no need to copy disk images. Different is the case of live migration to a remote DC: the storage located at the destination must be synchronized with the one at the source, and this may require to perform large data transfers—in the worst case to copy an entire VM disk image. An efficient solution consists in: (i) executing the bulk storage data transfer before launching the actual VM live migration, (ii) record-ing all write operations happenrecord-ing durrecord-ing the transfer, and (iii) applying the changes at the destination when the VM is being migrated [23,24]. Template disk images and write throttling mechanisms allow to reduce the amount of bulk storage data to be transferred and the number of changes to be applied, respectively.
The network state consistency issue is easily solved in a local cloud environment: in fact, since each VM is con-nected via a virtual bridge to the same physical LAN at both source and destination hosts, it will keep the same IP address and, when the execution is resumed at the des-tination, a gratuitous ARP packet is sufficient to make all switches and neighbors aware of the new VM loca-tion. More complex is the case of migrating a VM to a remote DC, because ongoing connections need to be rerouted. Indeed, when the relocated VM is hosted in a DC connected to a different IP network, or even within a different domain, some kind of IP mobility solution must be adopted, such as those based on the so-called iden-tifier/locator split principle [25,26]. Another possibility is to take advantage of the highly flexible, dynamic net-work reconfiguration capabilities of SDN, which allows to migrate an entire virtual network from one DC to another [27], and to smartly reroute external traffic after a VM has been migrated [28].
While most of the existing literature focuses on the single VM migration, the case of migrating multiple cor-related VMs is still to be investigated in detail. Some studies have been carried out to understand the implica-tions of live-migrating a group of VMs together with the virtual network interconnecting them [27], whereas other works focused on different optimization aspects [29-31]. A starting point for a quantitative analysis of the per-formance of multiple VM live migration assuming some simple scheduling strategies can be found in [32,33].
The analytic inter-DC network performance evaluation, with particular emphasis on communication resources consumed by multi-VM live migration, deserves specific attention in order to understand if and how a cloud fed-eration can be designed and dimensioned in an efficient way. To the best of the author’s knowledge, this topic has not been previously investigated in detail, apart from the early work in [10] which is generalized and extended here.
3 Federated cloud network scenario
The general problem addressed in this paper is how to quantify the effects of the main design parameters in a cloud federation on the performance of VM live migra-tion procedures. The design parameters include the size of the federation, the amount of communication and com-puting resources, and how they are allocated within the federation. The migration performance is assessed from both the end-user’s perspective, in terms of impact of the migration on the availability of cloud services, and the cloud provider’s point of view, considering resource utilization and availability of the migration service itself. If an analytical model that can reasonably capture all these aspects is developed, then it can be used to prop-erly choose the aforementioned design parameters and dimension the cloud federation network.
The federated cloud network scenario considered here consists ofn+1 DCs interconnected by a full mesh of guaranteed-bandwidth network pipes. Figure 1 shows the assumed connectivity model from the the point of view of a given DC (local DC), which can reach thenremote DCs via as many established network pipesL1,L2,. . .,Ln. Such network pipes could be implemented as MPLS label-switched paths (LSPs) or as lightpaths established between the edge nodes of an inter-DC optical network. Those LSPs or lightpaths are assumed to be established according to a long-term network resource planning strat-egy (e.g., by means of well-known routing and wavelength assignment techniques [34]). It is reasonable to assume that some QoS requirements (e.g., minimum bandwidth) must be guaranteed within a cloud federation network, to be able to control the performance of the inter-cloud communications.
Figure 1Cloud federation network connectivity model, as seen by a given traffic source (local DC).
e.g. for load balancing, energy saving, server consolidation or DC maintenance reasons. Amigration requestis then sent to thefederated cloud management system, which is in charge of finding a suitable DC where the VMs can be hosted. In principle, any DC within the cloud federa-tion could host the moving VMs. However, it would be more realistic to assume that only a subset of the DCs are actually able to receive the workload of the set of VMs to be migrated. This can be true for a number of rea-sons: for instance, not all DCs may provide the specific computing or storage resources required by the given VM set; or maybe the services implemented by the VMs have some latency requirements that cannot be satisfied if the VMs are migrated to a DC located too far from their final users; also, not all DCs in a cloud federation are equiva-lent in terms of energy savings or maintenance schedules; last but not least, load balancing reasons may force to choose some DCs instead of others. These limitations are caused by situations that can be either permanent (e.g., the nature, size, and location of a DC) or contin-gent (e.g., maintenance or load balancing schedules within the federation), but in any case known to the federated cloud management system, which is thus able to iden-tify, for each migration request, the subset of DCs in the federation that are suitable to satisfy it.
More formally, in this work it is assumed that the generic request z of migrating a group ofMz VMs can be satisfied by the set of resourcesCzavailable in a sub-set of the n remote DCs, as illustrated in Figure 2. In general, different requests may need different resource sets. It is assumed that the mz resource set instances
Cz(1),Cz(2),. . .,Cz(mz) available in the cloud federation are randomly distributed over thenremote DCs. Any of the
mz resource set instances is equivalent for hosting the VMs, according to a generalanycastservice model.
The federated cloud management system associates each migration requestzto the resource setCzby means of a sort of anycast address, defined internally in the fed-eration and used to identify the relevant subset of suitable DCs, that is then translated into:
• the set of network pipes between the local DC and any possible location ofCzinstances, i.e.{L2,L3,Ln}
in the example of Figure 2;
• the minimum amount of network pipe capacitybz
that must be guaranteed to migrate the whole group ofMzVMs, according to the live migration
performance model presented in the next section.
Then the management system is in charge of finding the location of the most suitable instance ofCz, namely
Cz(x). The choice is made based on the availability of the required capacity bz towards the location of C(zx). More specifically, letBi andBa,i respectively denote the total and currently available capacity of network pipeLi,
i = 1, 2,. . .,n. The capacity currently used by other data transfers between the local DC and thei-th remote DC is
Bi −Ba,i. Any network pipe towards a remote DC host-ing at least one of themzresource set instances and such thatBa,i ≥ bzis considered equivalent in the model and can be used to migrate theMzVMs. A migration request
Figure 2Example of resource availability in a cloud federation whenMzVMs are scheduled for migration.
between the local DC and any remote DC where the instances of resource setCzare located.
As an example, consider the case when n = 5 and
Bi = 4 Gbps, ∀i = 1,. . ., 5. Assume that requestz = j asks to migrateMj = 2 VMs with a guaranteed bit rate
bj = 1 Gbps. Suppose that, when the request arrives, it finds the available network pipe capacity as expressed by vectorBa =[Ba,1,Ba,2,Ba,3,Ba,4,Ba,5]=[ 2, 1, 0, 4, 2] Gbps,
and only mj = 3 instances of resource set Cj are avail-able, e.g. located in remote DCs 1, 3, and 5. There is enough available capacity in network pipesL1andL5, so
the group of VMs can be migrated to either remote DC 1 or remote DC 5. If the latter one is chosen and none of the ongoing transfers is completed when the next request arrives, then the available capacity vector becomesBa = [ 2, 1, 0, 4, 1] Gbps. If requestz=j+1 needs to migrate a larger number of VMs, e.g.Mj+1 = 5, it can happen that
the number of suitable DCs is smaller, e.g. onlymj+1=2
instances of resource set Cj+1 are available, located in
remote DCs 2 and 5. Then, if the bit rate requirement is also higher, e.g.bj+1=2 Gbps, none of the network pipes L2andL5towards the suitable remote DCs have enough
capacity left, and the migration request is blocked. The previous example shows that a request may be blocked because of lack of communication resources even when the total network capacity is not fully con-sumed. The occurrence of this kind of blocking situations depends on the availability of proper computing and stor-age resources in the remote DCs, or, in other words, it depends on which remote DCs are part of the anycast
group associated to a given request. Of course it could be argued that, if requestz = j+1 reduces its bit rate requirement tobj+1= 1 Gbps, then the migration can be
performed over eitherL2orL5: however, this choice could
negatively affect the service offered to the VM users, since the reduced transfer rate can have a significant impact on the live migration performance, as discussed in the next section. It could also be argued that, by choosing network pipeL1instead ofL5to serve requestz = j, the capacity
left onL5would be enough to serve requestz = j+1:
however, this implies the capability of the federated cloud management system to know future requests in advance, which could be possible only if all the VM migrations are already planned and pre-scheduled. This would be a case of static load patterns, for which an optimization model such as the one in [12] would be a better choice, but it is out of the scope of this paper.
The purpose of the model described in the next sections is to evaluate the performance, in terms of migration request blocking probability, of the aforementioned feder-ated cloud network scenario and to provide a useful design tool for network pipe dimensioning, considering dynamic network load patterns generated by the specific nature of VM live migration traffic. In order to keep the model sim-ple enough to be tractable and understand the role of the different design parameters, the following homogeneity assumptions are made:
A.2each network pipe provides the same total capacity, i.e.Bi=B, ∀i=1,. . .,n;
A.3each remote DC has the capability of hosting up tok
resource set instances;
A.4each migration request finds the same number of instances of resource setCz, i.e.mz = m, which are uni-formly distributed over thenremote DCs (considering the general case when multiple instances of the same resource set could be available in the same DC).
The migration request blocking model is obtained in two steps. First, an exact formulation of the multiple VM migration time is derived and used to compute for how long each migration request consumes the guaranteed amount of network capacity (Section 4). Then, the previ-ous result is applied to characterize the average network pipe capacity occupancy time in a Markov chain that approximates the state evolution of the inter-DC network and allows to compute the migration request blocking probability (Section 5).
4 Modeling multiple VM migration
The main advantage oflive migration, i.e. of moving the VM from one hosting server to another while it is still running, is that the current state of VM kernel and run-ning processes is maintained and the migration procedure has minimum impact on the end-user service availability. It also reduces the risk of inconsistencies due to duplicate VM instances running simultaneously in both the source and destination DCs. This work is focused mainly on the memory migration issue, assuming the pre-copy strategy [6].
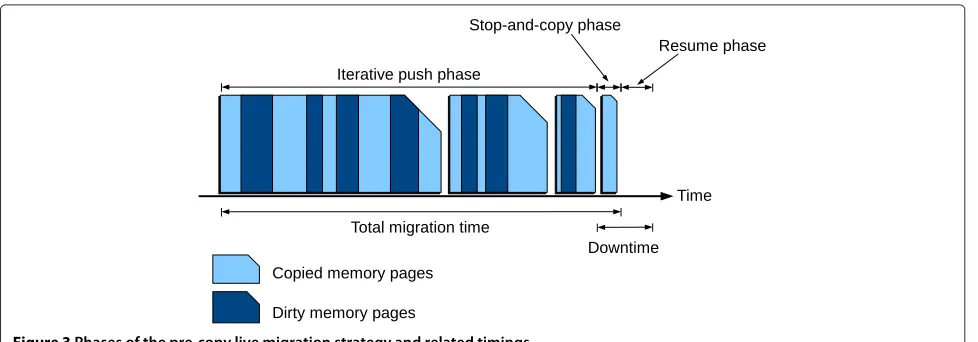
As illustrated in Figure 3, the migration starts with an
iterative push phase: a first snapshot of the VM mem-ory is transferred, while the VM is still running; during the transfer, some memory pages can still be modified by the running processes. Therefore, “dirty” memory pages
(i.e., pages modified during a given transfer) are trans-mitted again during the next round, until the total size of dirty pages is below a given threshold, or a maximum number of iterations is reached. After that, the stop-and-copy phasetakes place: the VM is suspended at the source host and the remaining dirty pages are copied to the destination. Finally, during the resume phasethe VM is brought back on-line at the destination host with consis-tent memory and network states. Network state can be either migrated during the resume phase or cloned at the beginning of the push phase, as suggested in [27]. The for-mer solution is more straightforward, whereas the latter seems to be more efficient in terms of latency and network load.
The two key performance parameters that are typically considered in the single VM migration process are the so-calleddowntime(Tdown) andtotal migration time(Tmig).
The former is defined as the amount of time the VM is paused during the transfer and it measures the impact of the migration on the end-user’s perceived quality of the service offered by the VM. Keeping the downtime as small as possible helps to make the migration process look transparent to the end-user, even for time-critical ser-vices such as audio/video streaming and on-line gaming. On the other hand, the total migration time is also very important because it measures the impact of the migra-tion process on the cloud federamigra-tion resources: in fact, the network pipe capacity consumed for transferring the VM as well as the computing resources dedicated to the VM in both source and destination DCs are occupied during the whole migration phase and cannot be used to perform other tasks.
A simple model used to evaluate Tdown and Tmig in
case of a single VM migrated with the pre-copy strategy was proposed in [35]. Based on this model, two gener-alized extensions to the case of multiple VM migration were presented in [32,33]. In this case, the definition of
the performance parameters depends on how the mul-tiple VMs are scheduled for the live transfer and on their mutual interactions when providing services to the end-user. The formulation of the multiple VM migra-tion model is briefly recalled here, under the following assumptions:
A.5 the Mz VMs to be migrated as per request z are allotted the same amount of memoryVz;
A.6the applications running on the VMs show the same constant memory page dirtying rateD;
A.7all VMs have the same memory page sizeP;
A.8the bit rateR(jz)used to transfer thej-th VM in the requested set is constant during the whole migration pro-cess; this is the amount of network pipe capacity dedicated to transfer VMj, i.e.R(jz)≤b, ∀j=1,. . .,Mz.
AssumptionsA.5andA.6may not be completely true in a real-word scenario, since the memory profile of each VM strongly depends on the specific applications that are being executed. However, these assumptions allow to simplify the equations and to capture the macroscopic performance aspects of multiple VM live migration. Any-ways, the case of VMs with different memory sizes in the same migration group can be studied by extending the migration model as in [33].
LetTi(,zj)be the time needed to complete thei-th itera-tion in the push phase of VMjmigration as per requestz. From the general equations derived in [32] that describe the iterative migration process of each VMj=1,. . .,Mz, it is possible to compute the time needed to migrate the
j-th VM and the number of iterations required as:
Tmig,(z)j= n(jz)
i=0 Ti(,zj)=
n(jz)
i=0
Vz (P D) i
R(jz)i+1 = Vz
R(jz)
1−γj(z)n (z) j +1
1−γj(z)
(1)
n(jz)=min
logγ(z) j
Vth Vz
,nmax
(2)
whereVthis the dirty memory size threshold andnmaxis
the maximum number of iterations that trigger the stop-and-copy phase, whereasγj(z) = (P D)/R(jz)must always be lesser than 1, because the pre-copy migration algorithm is sustainable as long as the average memory dirtying rate is smaller than the transfer rate.
The computation of the total migration time and down-time of a set of VMs strictly depends on how many of them are simultaneously transferred. In the following, two simple cases are considered: (i) when the Mz VMs are transferred one at a time (sequential migration); (ii) when all theMz VMs are simultaneously transferred (parallel
migration). A useful system parameter is the ratio of the dirtying rate to the maximum transfer rateγ =(P D)/b.
When the Mz VMs are migrated one at a time, each transfer is performed at full rate, i.e.R(jz) = b, ∀j. In this case,γj(z)=γ, ∀jand the sequential migration time of the whole VM setzis given by
Ts(−z)mig=
Mz
j=1
Tmig,(z)j=Mz
Vz
b
1−γn(sz)+1
1−γ (3)
wheren(sz)=min logγVth/Vz
,nmax
.
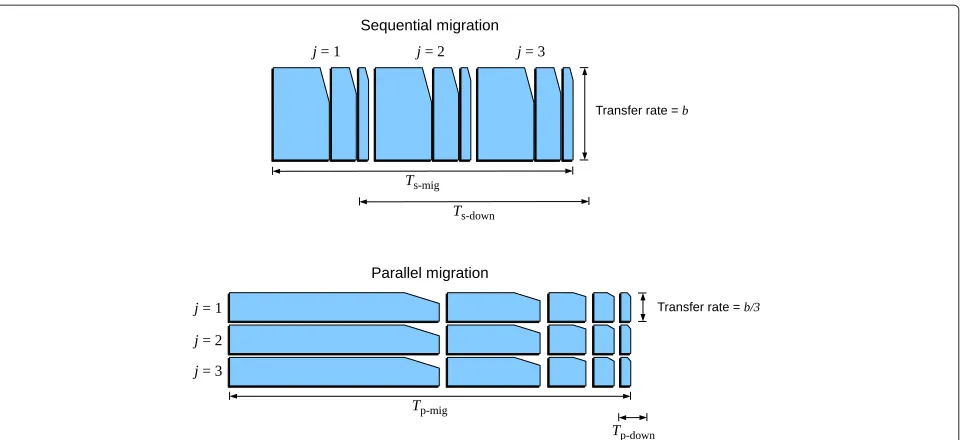
As illustrated in Figure 4, the downtime of the whole VM set starts when the first VM is stopped at the source host (i.e., when the last iteration of the first VM begins) and ends when the last VM is resumed at the destination host. IfTresis the fixed time required to resume a VM at
the destination host, the sequential migration downtime can be computed as
Ts(−z)down= Vz
b γ
n(sz)+(Mz−1)Vz b
1−γn(sz)+1
1−γ +Tres (4)
When the Mz VMs are migrated simultaneously, each one of them is transferred at a bit rate that depends on how the requested capacity b is shared among the on-going connections. Assuming an equal share of the channel capacity and considering that all the VMs in setz
have the same memory profile, all VMs start and end their iterations at the same instants. Therefore, there are always
Mz simultaneous transfers and the transfer rate used for each VM isR(jz) =b/Mz, ∀j. In this case,γj(z) =Mzγ, ∀j and, as shown in Figure 4, the parallel migration time of the whole VM set is equivalent to the migration time of any single VM, given by
Tp(z−)mig=Tmig,(z) j=Mz
Vz
b
1−(Mzγ )n
(z)
p +1
1−Mzγ
(5)
wheren(pz)=min logMzγVth/Vz
,nmax
.
The parallel migration downtime of the whole VM set corresponds to the last iteration (stop-and-copy phase) of any single VM and is given by
Tp(z−)down=Mz
Vz
b (Mzγ )
n(pz)+T
res (6)
Figure 4Different definitions of total migration time and downtime for sequential and parallel migration ofMz=3VMs.
Besides migration time and downtime, other parameters have been defined to quantify the overall cost of VM
migration [36]. One is the VM performance loss,
tak-ing into account the overhead of monitortak-ing memory write-access operations during the push phase: this can significantly slow down the execution of processes run-ning inside the VM and reduce their throughput. Another important cost factor is the energy overhead, i.e. the additional amount of energy consumed by the comput-ing and communication resources involved in the VM live migration. A different approach is followed here, taking advantage of the quantities obtained from the multi-VM migration model. The idea is to quantify the migration cost of a given set of VMs by measuring two factors: (i) the volume of data transferred on the net-work pipe during the migration, representing the com-munication resource overhead; (ii) the volume of data that the applications running inside the VMs are not able to exchange with the external end-users during the downtime, representing the VM processing performance degradation.
The former cost component can be evaluated as
Ts(−z)migb and Tp(z−)migb for the sequential and parallel migration, respectively, whereas the latter one can be obtained assuming the application throughput to be equal to the transfer rate, i.e.Ts(−z)downbandTp(z−)downb. Then, in order to come up with two cost contributions with compa-rable values, each product is normalized to its maximum value, which is obtained when γ approaches its upper bound, i.e.
lim
γ→1T
(z)
s−migb=MzVz lim γ→1
1−γn(sz)+1
1−γ =MzVz(nmax+1)
lim
γ→1 Mz
Tp(z−)migb=MzVz lim γ→ 1
Mz
1−(Mzγ )n(pz)+1
1−Mzγ =MzVz(nmax+1)
lim
γ→1T
(z)
s−downb=Vz(1+(Mz−1) (nmax+1))+Tresb
lim
γ→1 Mz
Tp(z−)downb=MzVz+Tresb
Therefore, the multi-VM migration cost factors related to network overhead and application throughput degrada-tion as per requestzfor sequential and parallel migration can be written as
c(sz−)net= 1−γ
n(sz)+1
(nmax+1) (1−γ )
(7)
c(pz−)net= 1−(Mzγ )
n(pz)+1
(nmax+1) (1−Mzγ )
(8)
c(sz−)app= Vz
γn(sz)+(M
z−1)1−γ
n(sz)+1
1−γ
+Tresb
Vz(1+(Mz−1) (nmax+1))+Tresb
(9)
c(pz−)app= MzVz(Mzγ )
n(pz)+Tresb
MzVz+Tresb
(10)
c(sz)=αc(sz−)net+(1−α)c(sz−)app (11)
c(pz)=αc(pz−)net+(1−α)c(pz−)app (12) where 0≤α≤1.
5 Markovian model of inter-DC network
According to the federated cloud network scenario described in section 3, migration request z is refused when other ongoing transfers consume all the capac-ity on network pipes reaching the remote DCs where the minstances of resource setCz are located. In order to compute the migration request blocking probability, it is necessary to determine which states of the inter-DC network are such that all the resource set instances
C(z1),Cz(2),. . .,C(zm) are located inside unreachable DCs. To this purpose, the state of the network is defined as the numberrof ongoing VM group migrations originated at the local DC. From assumptions A.1 and A.2, B is the total capacity of each of the n network pipes con-necting the local DC to the remote ones, and b is the capacity consumed by each group migration. Then, each network pipe is able to carry at mosth= B/b simulta-neous group migrations, and the maximum total number of simultaneous transfers originating from the local DC is
nh. Therefore, the state space of the network, as seen by the local DC, isr∈ {0, 1,. . .,nh}.
Assuming that the multi-VM migration requests follow a Poisson arrival process, a Markov chain describing the network state evolution can be defined using the following parameters:
• λ: migration request arrival rate; • μ: migration service rate;
• A0=λ/μ: load offered to the inter-DC network as seen by the local DC.
Since this Markov chain represents a system without a waiting line, it can be classified as a loss system and its solution is valid for any service time distribution with a finite mean [37].
To obtain the service rate, the reciprocal of the aver-age total migration time must be computed. Therefore, we can define two possible values ofμ, depending on the multi-VM migration strategy adopted (either sequential or parallel):
μs = 1
E
Ts(−z)mig
or μp= 1
E
Tp(z−)mig
where the migration time must be averaged over all migra-tion requestszaccording to the statistical distribution of
VzandMz.
The inter-DC network, as seen by the local DC, is there-fore modeled as a loss system where the number of servers
is equal tonhand migration request blocking events may occur in a generic state r, depending on the requested resource set instance locations. In fact, the transition to stater+1 occurs only when at least one of themrequested resource set instances is placed in a DC reachable via a network pipeiwith available capacityBa,i ≥b, otherwise the request is blocked. LetPbl|r be the blocking probabil-ity in stater. Transitions from staterto stater+1 occur with rateλr =(1−Pbl|r) λ, whereas transitions from state
rto stater−1 occur with raterμ.
To obtain Pbl|r, the combinatorial behavior of the anycast approach must be analyzed first. Considering assumptionsA.3andA.4, when the number of fully occu-pied network pipes is, the probability that themresource set instances are located in theunreachable remote DCs, each capable of hosting up to k instances, is given by the probability of choosingmobjects from a subset ofk
elements out ofnkpossible choices, i.e.
p(m|)=
m−1
i=0 k−i
nk−i =1,. . .,n (13)
Then, to correctly use formula (13), all the possible sub-states of stater must be considered, i.e. all the possible ways the r ongoing migrations can be distributed over any subset of the nremote DCs. This means finding all the possible partitions of number rinto up to min{n,r}
positive terms not greater than h. In principle, a more complex Markov chain including all sub-states of each statershould be solved in order to obtain the exact sub-state probabilities. However, this approach may become impractical, as the number of sub-states quickly becomes very large. Therefore, it was decided to approximate the sub-state probabilities considering only the “forward” evolution of the state, i.e. by recursively computing the sub-state probabilities of staterfrom those of stater−1.
Figure 5Possible sub-states of statesr=0, 1,. . ., 9and related “forward” transition probabilities, for the casen=3andh=3.
s(1|1)=1;s(2|2) =1/3 ands(1, 1|2)=2/3. When mov-ing further to state r = 3, the third migration request can bring the system to one of sub-states (3), (2, 1) or
(1, 1, 1), depending on the previous sub-state and the location of the chosen resource set instance. Therefore, the sub-state probabilities are s(3|3) = 1/3s(2|2) = 1/9, s(2, 1|3) = 2/3s(2|2) + 2/3s(1, 1|2) = 2/3, and
s(1, 1, 1|3) = 1/3s(1, 1|2) = 2/9. If the system is in sub-state(3), one of the remote DCs has a full network pipe and a new request can be blocked with probabilityp(m|1), otherwise it moves forward to sub-state(3, 1). The chance of a missing transition due to request blocking must be taken into account when computing the sub-state proba-bilities for stater=4, by normalizing to the sum of all the possible sub-state transitions, e.g.
s(3, 1|4)= (1−p(m|1))s(3|3)+1/3s(2, 1|3)
(1−p(m|1))s(3|3)+s(2, 1|3)+s(1, 1, 1|3)
s(2, 2|4)= 1/3s(2, 1|3)
(1−p(m|1))s(3|3)+s(2, 1|3)+s(1, 1, 1|3)
s(2, 1, 1|4)= 1/3s(2, 1|3)+s(1, 1, 1|3)
(1−p(m|1))s(3|3)+s(2, 1|3)+s(1, 1, 1|3)
It is worth to mention that only partitions(3, 1),(2, 2) and(2, 1, 1)of number 4 correspond to feasible sub-states of state r = 4. In fact, sub-state (4) can never occur because only up toh= 3 simultaneous transfers are pos-sible on a given network pipe, whereas sub-state(1, 1, 1, 1) is impossible because there are onlyn = 3 remote DCs. With the help of the forward sub-state transition bilities shown in Figure 5, the remaining sub-state proba-bilities can be computed in a similar way. This procedure can be generalized to a recursive sub-state probability computation algorithm that is relatively simple to execute. Once all the sub-states probabilities are known, the blocking probability in a given statercan be obtained by averagingp(m|)over all sub-states such that at least one DC has a full network pipe, e.g. in the example of Figure 5:
Pbl|3=p(m|1)s(3|3) Pbl|4=p(m|1)s(3, 1|4)
Pbl|5=p(m|1)s(3, 2|5)+p(m|1)s(3, 1, 1|5) Pbl|6=p(m|2)s(3, 3|6)+p(m|1)s(3, 2, 1|6) Pbl|7=p(m|2)s(3, 3, 1|7)+p(m|1)s(3, 2, 2|7) Pbl|8=p(m|2)s(3, 3, 2|8)
Pbl|9=p(m|3)s(3, 3, 3|9)=1
Then, solving the Markov chain of states r gives the following general steady-state probabilities:
P0= ⎛
⎝1+A0+
nh
r=2
r−1
=1
1−Pbl| Ar0
r!
⎞ ⎠
−1
P1=P0A0
Pr =P0
r−1
=1
1−Pbl| Ar0
r! 2≤r≤nh
(14)
Finally, the total request blocking probability can be obtained by adding the contributions from each state, resulting in
Pbl=
nh
r=1
Pbl|rPr (15)
6 Numerical results
This section presents an extensive set of numerical results, obtained with the federated cloud network model intro-duced above, that help to understand the role of the different parameters involved in the design of a cloud fed-eration network. In the following it is assumed that the VM memory size Vz follows a bimodal distribution, i.e.
Vz = V0, with probabilityq, andVz = u V0, u > 1,
Table 1 Model parameters and their reference values
Parameter Symbol and reference value
Maximum number of VMs to be migrated in a group
M=12
Small VM memory size V0=1 GB
Large VM memory size multiplying factor
u=4
Fraction of small VMs q=0.75 Memory page dirtying rate D=2500 pps Memory page size P=4 KB Residual dirty memory size threshold Vth=100 MB
Maximum number of iterations nmax=8
VM resume time Tres=100 ms
Network pipe capacity reserved for any multi-VM migration
b=1 Gbps
Total network pipe capacity B=4 Gbps Number of remote DCs in the cloud
federation
n=5
Number of resource set instances per request
m=3
Number of resource set instances supported by each remote DC
k=8
average multi-VM migration time (e.g., in the sequential case) can be computed as
ETs(−z)mig=M+1 2
V0 b
q1−γns(V0)+1+u(1−q)1−γns(uV0)+1 1−γ
(16)
wherens(x) = min logγVth/x,nmax
. Unless explic-itly mentioned, the charts included in this section show the performance trends as a function of the migration request arrival rateλ, when one of the model parameters varies and the others are assigned the reference values reported in Table 1.
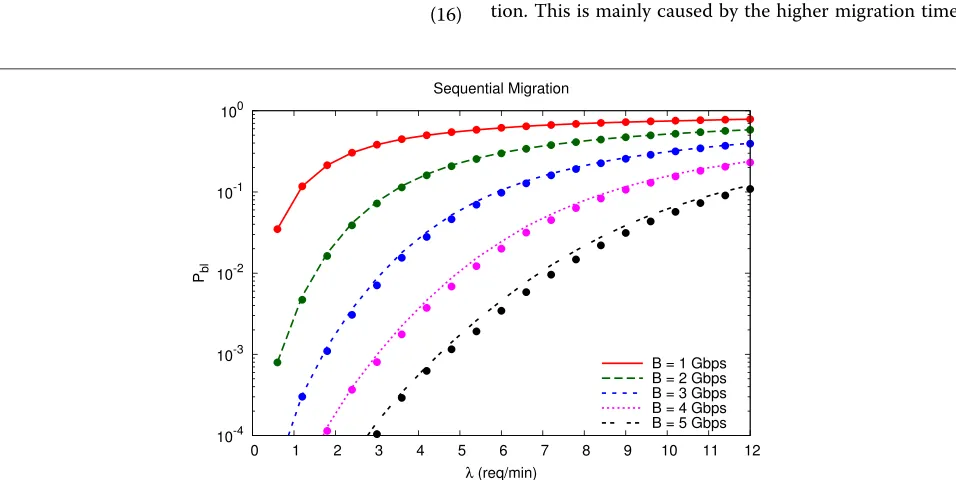
Figures 6 and 7 show the migration request block-ing probability as a function of the arrival rate for different values of the total network pipe capacity B, assuming a sequential and a parallel migration strategy respectively. The curves have been obtained by apply-ing the proposed model, whereas the points correspond to measurements obtained with a discrete-event simu-lator, specifically developed to evaluate the accuracy of the approximation introduced by the model. The ana-lytic results show a quite good match with simulations, with a slight overestimation of the blocking probability, noticeable for small values ofPbl. The same data validation
was performed for all the following graphs. However, for the sake of readability, only the curves obtained with the model will be shown.
As expected, the blocking probability increases when migration requests are more frequent, but a proper dimensioning of the network pipe capacity allows to keep the negative performance below a target level. Indeed, the proposed model can be used as an effective dimen-sioning tool to quantify the amount of communication resources needed for the design of a federated cloud network. Comparing the two figures clearly shows that parallel migration has a more detrimental effect on the inter-DC network performance than sequential migra-tion. This is mainly caused by the higher migration time
Figure 7Parallel migration request blocking probability as a function of the arrival rate, for different values of the total network pipe capacity.Lines: analysis. Points: simulations.
experienced by VMs transferred simultaneously: in fact, in parallel migration the transfer rate of each VM is reduced due to network pipe capacity sharing, while the mem-ory dirtying rate remains the same, thus increasing the number of iterations needed to complete the migration [32].
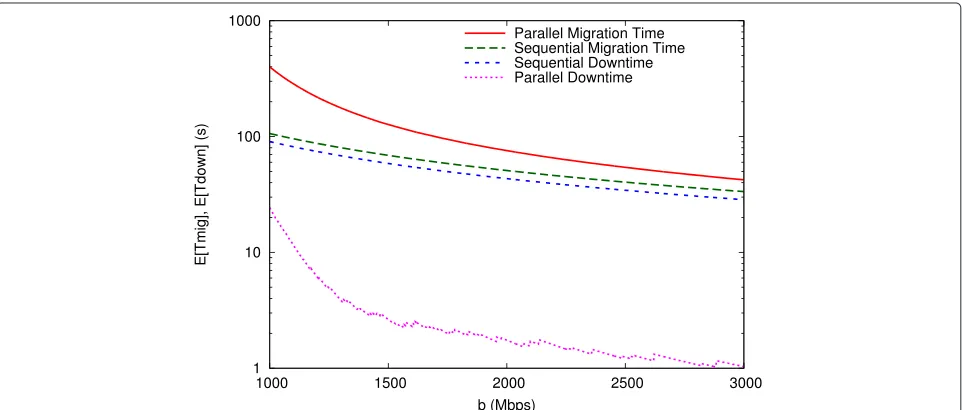
The worse network performance of parallel migration from the cloud federation management perspective is the price to pay to keep the total downtime as small as possi-ble. In fact, as shown in Figure 8, while the average parallel migration downtime can be significantly smaller than the
sequential one, the migration time can be much larger in the parallel case. This behavior affects also how the blocking probability depends on the ratiob/B, as reported in Figure 9: the step-like trend of the curves is caused by the abrupt change in the number of simultaneous group migrations supported by each network pipe, which decreases from 4 to 1. However, choosing a proper value of the network pipe capacitybto be reserved to each multi-VM transfer can help to control the migration timings and performance. In this sense, the proposed model allows to: (i) quantify the existing trade-off between sequential
Figure 9Sequential and parallel migration request blocking probability as a function of the fraction of network pipe capacity reserved to each multi-VM migration, whenλ=6req/min.
migration, which tends to reduce the network resource occupancy, and parallel migration, which is better for the end-user’s perceived quality; (ii) properly dimension the network pipe capacity bto be dedicated to a multi-VM transfer.
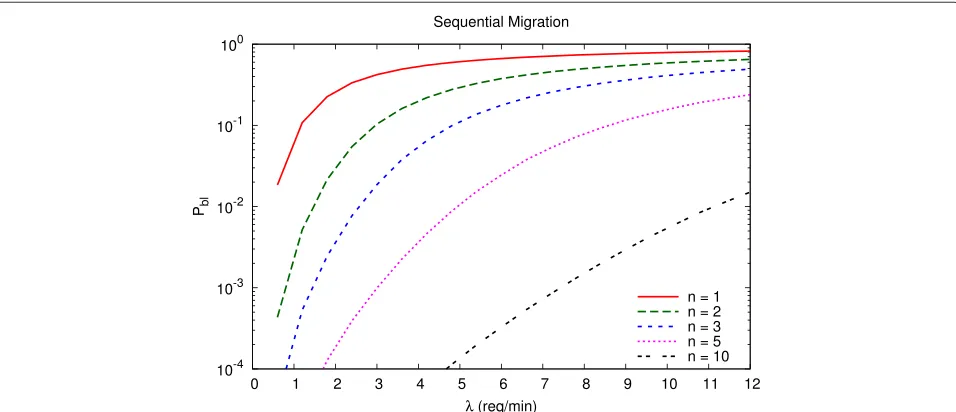
Another important aspect that the proposed model allows to quantify is the impact of the size of the cloud federation. To this purpose, Figures 10 and 11 show how the request blocking rate can be significantly reduced by increasing the number n + 1 of DCs participat-ing in the cloud federation. Obviously, the performance
improvement is a direct consequence of the higher num-ber of communication and computing resources available whennincreases, as there are more DCs capable of host-ing the VMs to be migrated. However, increashost-ing the size of the federated cloud network may have a signifi-cant infrastructure cost: the proposed model can help in finding a good cost/performance trade-off, given that a complementary infrastructure cost model is devised.
To understand the role of the availability of the com-puting resource set instances, i.e. the impact of the size of the anycast group associated to each migration request,
10-4 10-3 10-2 10-1 100
0 1 2 3 4 5 6 7 8 9 10 11 12 Pbl
(req/min) Parallel Migration
n = 1 n = 2 n = 3 n = 5 n = 10
λ
Figure 11Parallel migration request blocking probability as a function of the arrival rate, for different values of the number of remote DCs.
Figures 12 and 13 show how Pbl decreases when m
increases. As expected, the performance improves when it is possible to choose among a larger number of instances, since the computing resources available in the cloud fed-eration can be better utilized. In other words, the model allows to quantify the improvement achieved by migrating groups of VMs that are compatible with a higher number of DCs participating in the federation, e.g. choosing VMs with less stringent requirements. However, it is worth to note that such an improvement saturates at a given point,
e.g., there is little difference between m = 10 and m =
40. So, increasing mfurther does not bring any signifi-cant advantage, as long as space diversity and the related amount of communication resources, quantified byn, is the limiting factor. This effect is more evident in the paral-lel migration case, due to the worse network performance level.
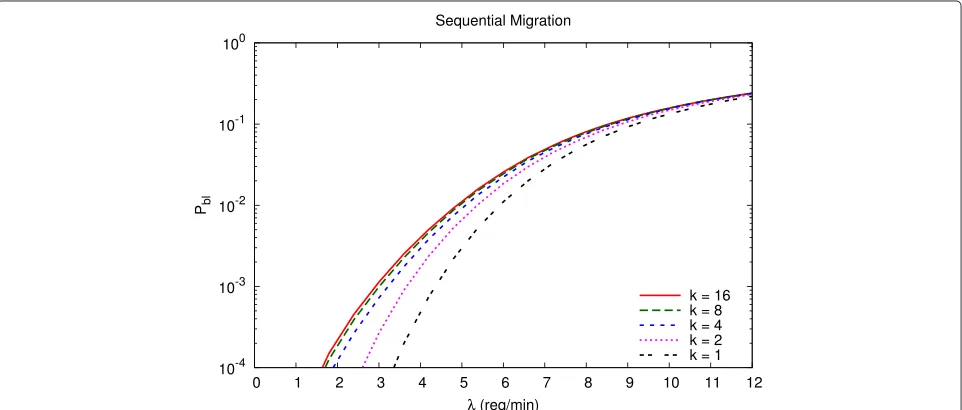
The same dominant effect of the communication resource availability can be verified by varying the num-berkof resource set instances supported by each remote
Figure 13Parallel migration request blocking probability as a function of the arrival rate, for different values of the number of resource set instances available per request.
DC, as shown in Figures 14 and 15. In this case,Pblquickly
reaches saturation whenkincreases, especially for parallel migration. Therefore, increasing the DC capacity in terms of computing resources is not helpful if communication resources are not adequately improved as well. Indeed, the curves show that larger values ofkgive even worse request blocking probabilities whennandmare fixed. The rea-son of such counterintuitive behavior in the system model is the general assumptionA.4of uniform distribution of themcompatible computing resource set instances to be chosen among the nk instances available in all remote DCs, which includes the possibility of choosing multiple
instances located in the same DC. Increasingk means a higher chance of finding most or all of the minstances in the same remote DC without provisioning additional communication resources, thus increasing the chance of finding a full network pipe.
The number of VMs to be migrated in a single request and the size of their allotted memory are two key param-eters with significant impact on the federated cloud network performance. In fact, increasing any of them results in a higher total migration time, and then in a higher resource occupancy period. This is exemplified by Figures 16 and 17 with relation to the maximum
Figure 15Parallel migration request blocking probability as a function of the arrival rate, for different values of the number of resource set instances supported by each remote DC.
number M of VMs to be migrated for each request, and by Figures 18 and 19 in terms of the large VM memory size multiplying factor u, according to the sta-tistical assumptions made at the beginning of this section that led to the average migration time expressed in (16) for the sequential case. The proposed model allows to determine the limits of the VM migration group size and the VM memory size that are compatible with a desired average performance level, given the amount of comput-ing and communication resources available in the cloud federation.
As a last example of the possible applications of the proposed model, Figure 20 compares the sequential and parallel migration costs as defined in (11) and (12), assum-ing an equal weight for network overhead and application throughput degradation, i.e. α = 0.5. The sequential migration cost is less sensitive to the variation of the VM transfer capacity than the parallel migration cost, due to the similar behavior of the migration time and downtime as shown in Figure 8. The interesting result here is that there is a value of babove which parallel migra-tion becomes more convenient than sequential migramigra-tion:
Figure 17Parallel migration request blocking probability as a function of the arrival rate, for different values of the maximum number of VMs to be migrated for each request.
according to the aforementioned definition of migra-tion cost, this happens when the difference in terms of network overhead becomes less significant than the dif-ference in application throughput degradation, which is reduced when adopting a parallel migration. Of course, a different choice of the weight α would give a differ-ent result, but this simple cost model can help comparing different design choices for the federated cloud network infrastructure, after the relative importance of network overhead and customer’s perceived quality has been deter-mined.
7 Discussion
The results presented in the previous section show how to quantify the effects of the main cloud federa-tion design parameters on the performance of multi-VM live migration procedures. The most relevant findings include:
• parallel migration is more demanding than sequential migration in terms of communication and computing resources, resulting in worse network performance from the cloud provider’s viewpoint, although the
Figure 19Parallel migration request blocking probability as a function of the arrival rate, for different values of the large VM memory size multiplying factor.
downtime experienced by the end-user can be significantly smaller;
• the total inter-DC network pipe capacity (B ) and the minimum capacity guaranteed to migration requests (b ) are key parameters that allow to control the performance from both end-user’s and cloud provider’s perspective;
• the significant effect of an increased size of the cloud federation (n) must be traded with the additional communication infrastructure cost that this implies;
• increasing the amount of computing resources available in the DCs (m, k ) can have some positive effects on the performance, but only if supported by adequate space diversity (n) and/or network capacity (B );
• the number of VMs to be migrated together (Mz)
must be carefully chosen in order to obtain the desired performance levels, also taking into account the VM memory size (V0,u) and the amount of communication resources (B, b );
• a well-defined balance between network overhead and end-user’s perceived quality is essential to decide which multi-VM strategy is better under some given conditions (cs,cp).
The proposed model can then be used to properly dimension the cloud federation network. As a matter of fact, from the live migration model presented in Section 4, and by carefully choosing the number of VMs to be migrated, it is possible to compute the minimum amount of network pipe capacity (b) that must be guaranteed to migrate a group of VMs while ensuring a given maximum total downtime (Figure 8). Then, based on the expected load of migration requests (λ), it is possible to deter-mine the minimum amount of total network pipe capacity (B) that must be provided by the inter-DC communica-tion infrastructure to achieve a given performance level (Figures 6 and 7). As discussed above, other parameters can be used to refine the design of the cloud federation.
8 Conclusion
This paper presented a model for assessing inter-DC net-work performance in cloud federations, assuming that network load is caused by live migration of multiple VMs cooperating to provide the end-user with a given ser-vice. After characterizing the multi-VM migration time for the two alternatives of sequential and parallel migra-tion strategies, it was demonstrated how the former one has a less detrimental effect on network performance, although parallel migration results in a much smaller service downtime. A possible trade-off in terms of migra-tion cost has been quantified, showing how the choice of the optimal multi-VM migration strategy depends on the capacity provisioned in the network. Although some assumptions made can be considered abstractions, the proposed model can be used to properly dimension the inter-DC network capacity and to understand the macro-scopic impact of the many parameters involved in the design of a federated cloud network.
Possible future extensions include a more accurate and dynamic modeling of the availability of comput-ing resources in remote DCs, and the analysis of the impact of more realistic inter-DC network topologies. In addition, extensions to existing open-source hypervisors are currently being investigated in order to implement customized multi-VM migration strategies and build an experimental test-bed for validating the proposed model in a real inter-DC environment.
Competing interests
The author declares that he has no competing interests.
Authors’ contributions
WC is the single author of this manuscript. He developed the analytical model presented here, wrote a software tool to compute the model as well as a discrete-event simulator to validate it, prepared all the graphs and tables with
numerical results, and wrote the text of the paper. The author read and approved the final manuscript.
Acknowledgements
This work was partially funded by EIT ICT Labs, Action Line on Future Networking Solutions, under Activity 2013 “Smart Networks at the Edge” and Activity 2015 “SDN at the Edges”.
Received: 24 October 2014 Accepted: 2 March 2015
References
1. Höfer CN, Karagiannis G (2011) Cloud computing services: taxonomy and comparison. J Internet Serv Appl 2(2):81–94
2. Chen M, Jin H, Wen Y, Leung VCM (2013) Enabling technologies for future data center networking: a primer. IEEE Netw 27(4):8–15
3. Rochwerger B, Breitgand D, Epstein A, Hadas D, Loy I, Nagin K, Tordsson J, Ragusa C, Villari M, Clayman S, Levy E, Maraschini A, Massonet P, Muñoz H, Toffetti G (2011) Reservoir - When one cloud is not enough. IEEE Comput 44(3):44–51
4. Toosi AN, Calheiros RN, Buyya R (2014) Interconnected cloud computing environments: challenges, taxonomy, and survey. ACM Comput Surv 47(1):7
5. BTI Systems (2014) Data Center Interconnect. http://www.btisystems. com/solutions/data-center-interconnect.aspx. Accessed 10 Sept 2014 6. Clark C, Fraser K, Hand S, Hansen JG, Jul E, Limpach C, Pratt I, Warfield A (2005) Live migration of virtual machines. In: Proc. of the 2nd USENIX Symp on Networked Systems Design & Implementation (NSDI 2005), Boston, MA. USENIX Association, Berkeley
7. The Open Networking Foundation (2012) Software-defined networking: the new norm for networks. ONF White Paper. https://www.
opennetworking.org
8. Jain R, Paul S (2013) Network virtualization and software defined networking for cloud computing: a survey. IEEE Commun Mag 51(11):24–31
9. Wang X, Du Z, Chen Y, Li S (2008) Virtualization-based autonomic resource management for multi-tier web applications in shared data center. J Syst Software 81(9):1591–1608
10. Cerroni W (2014) Multiple virtual machine live migration in federated cloud systems. In: Proc. of the IEEE INFOCOM Workshop on Cross-cloud Systems (CrossCloud 2014), Toronto, Canada. IEEE, USA
11. Cuadrado F, Navas A, Dueñas JC, Vaquero LM (2014) Research challenges for cross-cloud applications. In: Proc. of the IEEE INFOCOM Workshop on Cross-cloud Systems (CrossCloud 2014), Toronto, Canada. IEEE, USA 12. Papagianni C, Leivadeas A, Papavassiliou S, Maglaris V, Cervelló-Pastor C,
Monje A (2013) On the optimal allocation of virtual resources in cloud computing networks. IEEE T Comput 62(6):1060–1071
13. Guo C, Lu G, Wang HJ, Yang S, Kong C, Sun P, Wu W, Zhang Y (2010) SecondNet: a data center network virtualization architecture with bandwidth guarantees. In: Proc. of the 6th ACM Int Conf on Emerging Networking Experiments and Technologies (CoNEXT 2010), Philadelphia, PA. ACM, New York
14. Shrivastava V, Zerfos P, Lee K-W, Jamjoom H, Liu Y-H, Banerjee S (2011) Application-aware virtual machine migration in data centers. In: Proc. of the 30th IEEE Int Conf on Computer Communications (INFOCOM 2011), Shanghai, China. IEEE, USA
15. Zhani MF, Zhang Q, Simon G, Boutaba R (2013) VDC Planner: dynamic migration-aware virtual data center embedding for clouds. In: Proc. of the IFIP/IEEE Int Symp on Integrated Network Management (IM 2013), Ghent, Belgium. IEEE, USA
16. Kantarci B, Foschini L, Corradi A, Mouftah HT (2013) Design of
energy-efficient cloud systems via network and resource virtualization. Int J Network Mgmt. doi:10.1002/nem.1838. John Wiley & Sons, USA 17. Mouftah HT, Kantarci B (2014) Optical inter-data-center network design
under resilience requirements and dynamic electricity pricing. In: Proc. of the 16th Int Conf on Transparent Optical Networks (ICTON 2014), Graz, Austria. IEEE, USA
19. Bruneo D (2014) A stochastic model to investigate data center
performance and QoS in IaaS cloud computing systems. IEEE T Parall Distr 25(3):560–569
20. Ibrahim KZ, Hofmeyr S, Iancu C, Roman E (2011) Optimized pre-copy live migration for memory intensive applications. In: Proc. of the Int Conf of High Performance Computing, Networking, Storage and Analysis (SC 2011), Seattle, WA. IEEE, USA
21. Medina V, Garcia JM (2014) A survey of migration mechanisms of virtual machines. ACM Comput Surv 46(3):30
22. Hines MR, Deshpande U, Gopalan K (2009) Post-copy live migration of virtual machines. ACM SIGOPS Operat Syst Rev 43(3):14–26
23. Bradford R, Kotsovinos E, Feldmann A, Schioberg H (2007) Live wide-area migration of virtual machines including local persistent state. In: Proc. of the 3rd ACM Int Conf on Virtual Execution Environments (VEE 2007), San Diego, CA. ACM, New York
24. Wood T, Ramakrishnan KK, Shenoy P, van der Merwe J (2011) CloudNet: dynamic pooling of cloud resources by live WAN migration of virtual machines. In: Proc. of the 7th ACM Int Conf on Virtual Execution Environments (VEE 2011), Newport Beach, CA. ACM, New York 25. Koponen T, Gurtov A, Nikander P (2005) Application mobility with HIP. In:
Proc. of the 12th Int Conf on Telecommunications (ICT 2005). Cape Town, South Africa
26. Bhatti SN, Atkinson R (2012) Secure and agile wide-area virtual machine mobility. In: Proc. of the IEEE Military Communications Conf (MILCOM 2012), Orlando, FL. IEEE, USA
27. Keller E, Arora D, Perez Botero D, Rexford J (2012) Live migration of an entire network (and its hosts). Tech Rep TR-926–12 Dept of Computer Science, Princeton University
28. Bifulco R, Brunner M, Canonico R, Hasselmeyer P, Mir F (2012) Scalability of a mobile cloud management system. In: Proc. of the 1st ACM Workshop on Mobile Cloud Computing (MCC 2012), Helsinki, Finland. ACM, New York
29. Ye K, Jiang X, Ma R, Yan F (2012) VC-migration: live migration of virtual clusters in the cloud. In: Proc. of the 13th ACM/IEEE Int Conf on Grid Computing (GRID 2012), Beijing, China. IEEE, USA
30. Deshpande U, Wang X, Gopalan K (2011) Live gang migration of virtual machines. In: Proc. of the 20th Int Symp on High Performance Distributed Computing (HPDC 2011), San Jose, CA. ACM, New York
31. Bari MF, Zhani MF, Zhang Q, Ahmed R, Boutaba R (2014) CQNCR: optimal VM migration planning in cloud data centers. In: Proc. of the IFIP Networking Conf, Trondheim, Norway. IEEE, USA
32. Callegati F, Cerroni W (2013) Live migration of virtualized edge networks: analytical modeling and performance evaluation. In: Proc. of first IEEE Workshop on Software Defined Networks for Future Networks and Services (SDN4FNS 2013), Trento, Italy. IEEE, USA
33. Cerroni W, Callegati F (2014) Live migration of virtual network functions in cloud-based edge networks. In: Proc. of the IEEE Int Conf on
Communications (ICC 2014), Sydney, Australia. IEEE, USA 34. Mukherjee B (2006) Optical WDM networks. Springer, New York 35. Liu H, Jin H, Xu C-Z, Liao X (2013) Performance and energy modeling for
live migration of virtual machines. Cluster Comput 16(2):249–264 36. Strunk A (2012) Costs of virtual machine live migration: a survey. In: Proc.
of the 8th IEEE World Congress on Services (SERVICES 2012), Honolulu, HI. IEEE, USA
37. Kelly FP (1991) Loss networks. Ann Appl Probab 1(3):319–378
Submit your manuscript to a
journal and benefi t from:
7Convenient online submission 7Rigorous peer review
7Immediate publication on acceptance 7Open access: articles freely available online 7High visibility within the fi eld
7Retaining the copyright to your article