Membership Function Modification in Fuzzy SVM
using Combination of Distance Feature,
Correlation, and Depth of Data
M. Rahmat Widyanto and Rini Wijayanti
Faculty of Computer Science, University of Indonesia Depok Campus, West Java, Depok 16424, INDONESIA
E-mail: [email protected]
Abstract-- In this paper, we proposed the membership function modification in Fuzzy Support Vector Machine (Fuzzy SVM) based on exponential distribution function. This function is expressed as the level of training data contribution to its class model building. It is formed prior to training phase and started with checking and handling the missing values. Afterwards is the formation of fuzzy variables based on the distance feature, correlation, and the depth of data to be formalized into the exponential distribution function. The experiments results show that the proposed method has a higher accuracy about 2% compared to conventional SVM and Fuzzy SVM. This method is expected more contributed in the development of various pattern recognition applications, which more demand on higher accuracy.
Index Term-- Fuzzy, svm, feature combination. 1. INTRODUCTION
Nowadays, automatic pattern recognition to find an optimal solution is still becomes an interesting topic to be further developed. Pattern recognition, which is usually called as classification, is one of topic in computer science that maps a set of data into several classes that has been specified [Anto, 2005]. This topic has been applied in many fields, i.e. email classification (spam or not spam), disease classification based on medical diagnose, text document classification, etc.
One of classification methods that are widely used recently is Support Vector Machine (SVM). It has been proved as the third most popular method after C.45 and K-Means in International Conference on Data Mining (ICDM 2006). It has been considered as the most influenced algorithm to data mining communities [XindongWu, 2007]. This method was first introduced by Vapnik in 1992 and still gains many attention until now due to its well generalization (B. Boser, 1992) (Vapnik, 1995) (Mulier, 1998) (Vapnik V. N., 1998) (Wu, 1999) (Byun H., 2003).
In conventional SVM, each input points are considered to have the same contribution to the training model. However, this is not always true since there might be some points corrupted by noise so they are less meaningful and the machine should better to discard them. This paper aims to handle this kind of data using fuzzy approach by giving them a weight which indicate different contribution of each point to the model. The weights are determined with respect to their membership function. Such approach is usually called as Fuzzy SVM (FSVM).
Several researches have been conducted in Fuzzy SVM. Chun-Fu Lin and Sheng-De Wang proposed Fuzzy SVM to solve such problem by weighting the data training so that different input points can make different contributions to the learning of decision surface [Chun-Fu Lin, 2002]. For non-sequential dataset, they estimate the distance between each data to its class center as membership function. This method is widely accepted and used in some papers. Qin-Yu Ping used this method to solve the multi-class problem [Qin-Yu Ping, 2008]. Hao Tang also used such distance function combined with affinity variable to weigh the input points [Hao Tang, 2008]. However, this method always considers the outer data as outlier because they are given a very small membership value, nearly or exactly the same as lower bound value that has been specified. Whereas, not all outer data can be considered as outlier since they have similar characteristic with other data in the same class. Moreover, they used Mean value as the center of class, while it is easy affected by outlier. In this paper, a new membership function assigned to each data is proposed. We use three fuzzy variables: distance, correlation, and depth of data, and formulize them into exponential distribution function. Distance variable is used to see overlapping between class, while the correlation and depth of data is used to find the level of similarity. Class center location is determined using the Hodges-Lehmann due to the presence of outliers is not affected.
The rest of this paper is organized as follows. A brief review of the theory of SVM and Fuzzy SVM will be described in Section II. The proposed FSVM will be derived in Section III. The experiments are presented in Section IV. Some concluding remarks are given in Section V.
2. SVM AND FUZZY SVM
In this section, we describe about SVM and fuzzy SVM as the basic in classification problem
2.1. SVM
the nearest data in each class, which is called as support vectors. These illustration can be seen in figure 1.
Fig. 1. Optimal hyperplane
Suppose there are n datasets {x1, ..., xn}, where
is belongs to one of the two classes labeled by yi {+1, -1}, then each sample point must satisfied the following conditions
(1)
where w is a normal to the hyperplane and b is a bias of the hyperplane. Therefore, the margin of separating hyperplane is
( )
.
(2)
Since maximizing
is equal by minimizing , then the
optimal hyperplane can be find by formulating
‖ ‖
( ) .
(3)
However, in the non-separable case, we introduce nonnegative slack variables ξ such that the following conditions are satisfied
‖ ‖ (∑
) (
)
, , ,
(4)
where ξi =0, if xi is correctly classified. C is a predefined positive constant which determines the penalty on empirical error.
The problem above is a quadratic problem which quite difficult to resolve and requires a heavy computation time. Therefore, a set of Lagrange multipliers (
α
) is introduce and the problem is converted into
( ) ‖ ‖
∑ ( )
∑
(5)
These points with αi > 0 is called as support vector. If 0< αi <
C, these points are lie on one of the margin. Whereas if αi =
C, these points are regarded as misclassified data.
By minimizing the Lp with respect to b (
( ) )
and w (
( ) ), then be obtained
∑
,
(6)
∑
.
The w vector is often very large (possibly infinite), but the value of αi is finite. Therefore, by subtituting the equation
above will be obtained the dual problem
( ) ∑ ∑
.
(7)
The problem to find the optimal hyperplane can be formulated as follows,
∑ ∑
∑
(8)
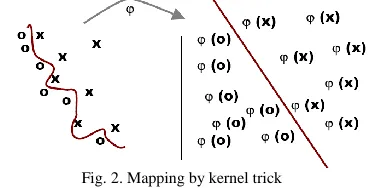
Non-separable case also can be solved by kernel trick. This original input space is mapped into a high-dimensional dot product space called as feature space. The mapping ilustration can be seen in figure 2.
Fig. 2. Mapping by kernel trick
Kernel functions that commonly used in pattern recognition problem are the following:
Linear : ( ) .
Polynomial : ( ) ( ) . Radial Basis Function (RBF) :
( ) ( ) . Tangent hyperbolic (sigmoid) : ( ) ( ) .
According to (Hsu, 2004), kernel that are recommended tested for the first time is RBF kernel function because it has the same performance with linear kernel and sigmoid kernel behaviors on certain parameters and have a small range values [0,1]
2.2. Fuzzy SVM
Fuzzy SVM was first introduced by Shigeo Abe in 2001 to resolve the unclassifiable regions problem. Then, in 2002, Fuzzy SVM used in different ways by Chun-Fu Lin to reduce the effect of outliers in model generation.
In conventional SVM, the sample points are treated equally, including outlier and each point is assumed to be belonged to one class. However, in many real-world problem, some input points may not exactly assigned to one of these classes and different points have different contributon to the decision surface. To solve this problem, fuzzy membership is introduced by assigning a membeship value µi to each training point xi. The higher value of µi makes the corresponding point
xi less important in the training, and vice versa.
Suppose there are n dataset with associated fuzzy membership (x1,y1, µi)….(xn,yn, µn) }, where is belongs to one of the two classes labeled by yi {+1, -1} which has fuzzy membership with sufficient small t > 0. Then, the separating hyperplane can be find by formulating
‖ ‖ (∑
)
( ) ξ
ξ .
(9)
Furthermore, the problem can be transpormed into Lagrange function as follow
∑ ∑
∑
(10)
In conventional SVM, there is only free parameter C which is used to control the trade-off between maximizing margin and minimizing the amount of misclassification. A larger C makes the training SVM less misclassification and the margin will be narrower. The decrease of C makesSVM ignore more training points and get wider margin.
The greater the value of C, then the fewer the number of errors and the margin will be smaller. Conversely, the
smaller the value of C will cause the number of errors and the margin even greater.
In fuzzy SVM, the number of free parameters is equivalent to the number of training points because each training points is given a membership value to control the trade-off. The membership value is usually calculated based on the main property of dataset. If suppose we use fuzzy membership as function of the distance between the point and its class center, then the following formula can be use
{ ( ) ( )
(11)
where is the mean of class +1, is the mean of class -1, and to avoid the case .
as the radius of the class +1 is obtained through
(12)
whereas is the radius of the class -1 is obtained through
(13)
3. PROPOSED MEMBERSHIP FUNCTION FOR FUZZY SVM This section will describe the proposed membership function for Fuzzy SVM. The different membership functions have different effect to the algorithm (Qu, 2008).
In this paper, we introduce a new membership function as combining of distance feature, correlation and the depth of each point. Then these feature are integrated into exponential function. The distance concept is used to identify the overlapping between classes, while the correlation and the depth is used to represent the similarity between points.
In generating membership function, the distance feature and correlation is calculated relative to its class center, so its absolutely requires numerical data. Therefore, this proces is begins by ensuring all features have numerical type. We carried out the missing value, which is usually express as question mark (?) in UCI Machine Learning data, by appling the imputation method. In this paper, we calculate the mean value of missing attribute in the same class to substitute the missing value. However, in large dataset, the observation of missing values can be ignored because a similar observation can be found from another data (Santosa, 2007).
Then, we begin the fuzzy membership calculation for each feature.
3.1. Distance
In most paper, fuzzy membership often define as a function of distance between each sample point to its class center (Chun-Fu Lin, 2002). This is one of important basis for measuring contributions which sample point have (Hao, 2008).
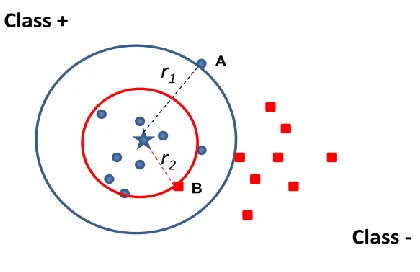
computed each point to its class center, but to all class center. These concept is shown in figure 3.
Fig. 3. The distance concept
Figure 3, shows the observations to the class+. Point A is the farthest point of class+, while point B is the closest point from another class (class -) to class+ center. Thus, the distance between the class+ center (x+) and point A is called as maximum radius (r1), whereas the distance to point B is called as minimum radius (r2). If r1> r2 means there is overlapping between classed. So, the fuzzy membership function based on distance ( ( )) is defined as
{ ‖ ‖ ‖ ‖ ‖ ‖
(14)
In this paper, the class centers are calculated by Hodges-Lehmann (HL) method. This method is a robust statistical method to find the class center based on median of the average data pairs, as expressed as follow
, (15)
where n is the number of data. HL estimator is a more reliable than using the mean value. The mean is very sensitive to outliers because this function calculates the average value of an entire class. For example, if there is a point which have a wide range value compared with other data, then the average value of the class can be much different. Meanwhile, HL estimator determines the location of the center of classes based on ranges of data values in a class. The outermost data in a class is found by using the convex hull method (Eddy, 1977)
3.2. Similarity
The similarity is the second variable used in generating the fuzzy membership. According to (Badrul Sarwar, 2001), one way to measure the similarity of two data is using the Pearson correlation
( ) ( )
∑( ̅)( ̅)
√∑( ̅) ∑( ̅)
(16)
The similarities are generally compared the data with its class center. The data with low similarity will be considered as outlier. In this paper, we also use correlation to find the similarity between each point to its class center. The fuzzy membership function based on similarity ( ( )) is defined as
{ ( ( )) ( ( )) ( ( ))
(17)
In the above membership function, any point that has correlation coefficient more than 0.9 means having a very strong relationship (Wikipedia). Therefore, we define the degree membership for such point is 1. Otherwise, correlation will be close to 0 if there is no relationship exists.
3.3. Depth
In this paper, we use convex hull peeling to identify the depth of each point in its class. This method is executed with a simple algorithm. Suppose we are given a set S of n points. First, calculate the convex hull (H) from S and give a value of 1 at each vertex, so it remains S' as a set in the hull. Then calculete the convex hull of set S' and give a value of 2 (previous value + 1) at each vertex. This process is done iteratively until no more point inside a hull. The values given in each iteration express the depth of data. Furthermore, the depth value will be converted into new value which range [0,1] by the following equation
( ) ( ( ) )
(18)
The results of the convex hull peeling is illustrated in Figure 4.
Fig. 4. Convex Hull Peeling illustration
Briefly, the algorithm of membership functions generation can be written as the following stages:
Phase 1: Check whether there is missing value in each attribute. If missing value found, then substitute by mean value of its attributes.
Phase 2: For each class, find the class center (c) and the outermost point.
For each class i, find the minimum and maximum radius. Minimum radius is the distance from the class center c to the outermost point from the other class (class j), whereas the maximum radius is the distance from the class center to the outermost point of the class i. Then, calculate the distance of each point in class i to its class center. Apply the membership degree according to equation 14.
Step 4: Find the membership degree based on Pearson correlation (μ2(x)).
For each point, calculate its correlation to class center and apply the membership degree according to equation 17. Stage 5: Find the membership degree based on the depth of data (μ3(x)) by using Convex Hull Peeling (CHP).
a. Set the depth (d = 0)
b. Find the convex hull vx of the class i
c. Increase the depth value (d = d + 1) and apply the value to vx (depth (x) = d)
d. Remove the convex hull vx from the class i
e. If there are still datasets in class i, then repeat these step b - e . Otherwise, update the depth value ( ( ) ( ) ).
3.4. Integration the fuzzy variable into the exponential function
As a final step in generating the fuzzy membership degree is integrate the values of three variables into an exponential function
( ) ( ( ) ( ) ( )) (19)
where α = 1, μ1(x) is distance value, 2(x) is correlation value,
μ3(x) is depth value, and σ = 0.049787 is the lower bound. The higher value of ( ) ( ) ( ) makes the membership degree is also higher. This function is illustrated in figure 5.
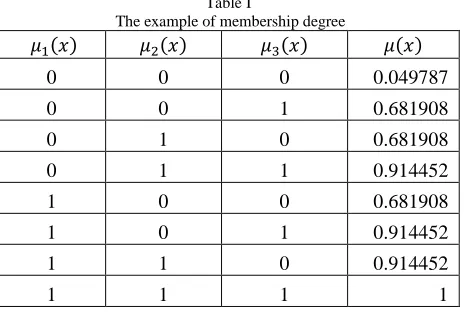
By using this exponential function, it is possible for a point that only have a maximum value (value = 1) in one of three variables to have a high degree of membership. The following table is shows the example of membership degree generated from various of maximum value.
Table I
The example of membership degree
( ) ( ) ( ) ( )
0 0 0 0.049787
0 0 1 0.681908
0 1 0 0.681908
0 1 1 0.914452
1 0 0 0.681908
1 0 1 0.914452
1 1 0 0.914452
1 1 1 1
Fig. 5. Exponential Function
4. EXPERIMENTS
Experiments are made on artifial data and real data which are taken from UCI Machine Learning repository. The following table describe the information about these dataset.
Table II Dataset used in experiment
Dataset #Record #Attribute #Class
Artificial -1 107 2 2
Artificial -2 176 5 3
Soybean 47 35 4
Iris 150 4 3
Wine 178 13 3
Glass 214 10 7
Ecoli 336 8 8
BreastCancer 699 10 2
Mammographic 961 5 2
Yeast 1484 8 10
PageBlocks 5473 10 5
Tabel III
The experiment result based on recognition rate
Dataset Recognition Rate
SVM C.F.LIN EFSVM
Artificial-1 85.71% 82.14% 92.86%
Artificial-2 73.86% 73.86% 79.55%
Soybean 95.83% 95.83% 95.83%
Iris 97.33% 97.33% 97.33%
Wine 98.89% 98.89% 98.89%
Glass 66.06% 66.06% 68.81%
Ecoli 82.94% 82.35% 84.12%
BreastCancer 97.71% - 98.57%
Mammographic 81.50% - 83.58%
Yeast 55.84% 55.57% 56.11%
PageBlocks 93.21% 93.17% 93.24%
Based on the above experimental result, the proposed method generally gives better recognition rates than SVM and fuzzy SVM proposed by CF Lin. However, for small-sized datasets and have a balanced distribution, such as Soybean, Iris, and Wine have the same recognition rate in all three algorithms. For dataset with missing value (Mammographic and BreastCancer), CF Lin method cannot be used.
Furthemore, based on these experiment result, we will evaluate the effect of the proposed membership function to the algorithm. Generally, the proposed membership functions tend to produce a high membership degree. If a training point has a high value in one of the three variables, then this point may have a high membership degree (> 0.5). Therefore, almost the entire dataset is dominated by the membership value of more than 0.7 because the correlation variables tend to produce high value. This condition is different from the membership degree resulting by CFLin method, which tends to produce varying degrees of membership [0,1], so that dominated by values between 0.7 and 0.8. Moreover, CFLin method is always considered the outer point as outlier because it has minimum membeship degree
(≈ 0).
While the proposed method does not always detect the outliers. The illustration of membership degree differences between SVM, FSVM (CF Lin) and the proposed FSVM can be seen in Figure 6.Fig. 6. Illustration of membership degree differences
Based on the experimental results, correlation variable play a role very much in obtaining a high membership degree
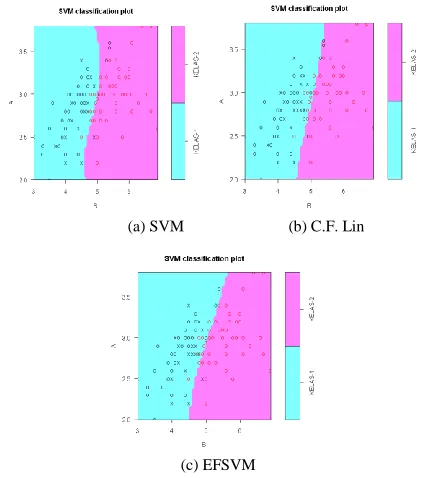
because each point that are not outliers will have a high correlation and eventually will effect to the form of decision surface (hyperplane). In figure 7 below show the difference of hyperplane formed in experiments using an artificial dataset.
(a) SVM (b) C.F. Lin
(c) EFSVM
Fig. 7. The difference of hyperplane between SVM, FSVM (CFLin), and EFSVM
In the figure above, the hyperplane of CF Lin method and EFSVM only slightly different, but EFSVM can more correctly classify the points around the hyperplane.
In this paper, we also analyze the experiment result based on different size of dataset and dataset distribution. In a simple dataset (small-sized dataset and few overlapping), the membership function does not significantly affect to the level of accuracy, such as soybean, iris, and wine. However, in complex dataset, this membership function was influential in the form of decision surface. Suppose in Mammographic dataset, EFSVM hyperplane was away from the outlier, while conventional SVM makes outlier as support vectors. In Ecoli and Glass datasets, EFSVM can classify 20% of data around the hyperplane.
The dataset distribution is divided into balanced and unbalanced distribution. In balanced dataset, the recognition rate is high because all classes have enough data in the training phase. While in unbalanced dataset, recognition rate depends on the class that has a lot of data because the minor classes do not have enough data for training and it makes hard to recognize. In addition, the number of minor class is usually a bit so it does not influence the recognition rate.
5.
CONCLUSIONmembership degree for each training point. The proposed method tend to produced high membership degree and it gives effect to the form of decision surface. Based on the experimental result, the proposed method can be used to handle missin values and gives better recognition rate.
REFERENCES
[1] Abe, S. (2003). Analysis of Multiclass Support Vector Machines, URL : www2.kobe-u.ac.jp/~abe/pdf/cimca2003.pdf. Proc. International Conference on Computational Intelligence for Modelling Control and Automation (CIMCA’2003), (pp. 385-396). Vienna, Austria.
[2] Anto S.N, D. H. (2005). Analisa Informasi Dimensi Tinggi Pada Bioinformatika Memakai Support Vector Machine Machine, Teori dan Aplikasinya dalam Bioinformatika. National Conference on Information & Communication Technology (ICT) for Indonesia/e-Indonesia Initiatives-II, (pp. 427-435).
[3] B. Boser, I. G. (1992). A training algorithm for optimal margin classifers. Proc. 5th Annual Workshop on Computational Learning Theory, (pp. 144-152). NY.
[4] Badrul Sarwar, G. K. (2001). Item-based Collaborative Filtering Recommendation Algorithms. The Tenth International World Wide Web Conference. Hongkong.
[5] Byun H., L. S. (2003). A Survey on Pattern Recognition Applications of Support Vector Machines. International Journal of Pattern Recognition and Artificial Intelligence , 459-486. [6] Chang, C.-C. &.-J. (2001). LIBSVM: a library for support vector
machine. Software available at http://www.csie.ntu.edu.tw/~cjlin/libsvm.
[7] Chun-Fu Lin, S.-D. W. (2002). Fuzzy Support Vector Machines.
IEEE Transactions on Neural Networks .
[8] Eddy, W. F. (1977). A new convex hull algorithm for planar sets.
ACM Transactions on Mathematical Software, , 398–403. [9] Hann, J. K. (2000). Data Mining: Concepts and Techniques.
Morgan Kaufman Publishers.
[10] Han-Pang Huang, Y.-H. L. (2002). Fuzzy support vector machines for pattern recognition and data mining. International Journal of Fuzzy Systems , 826-835.
[11] Hsu, C.-W. e. (2004). A Practical Guide to Support Vector Classification. National Taiwan: Department of Computer Science and Information Engineering.
[12] I. Guyon, N. M. (1996). Discovering Informative Patterns and Data Cleaning. CA: American Association for Artificial Intelligence.
[13] Joachim, T. (2001). Learning To Classify Text Using Support Vector Machine. Kluwer Academic Publisher.
[14] Kunlun Li, H. H. (2004). Fuzzy Support Vector Machine for Multi-Class Classification. Journal of Electronics .
[15] Mulier, V. a. (1998). Learning from Data: Concept, Theory, and Method. John Wiley & Sons.
[16] Qing Song, W. H. (2002). Robust Support Vector Machine With Bullet Hole Image Classification. IEEE Transactions on System, Man, Cybernetics-part C: Application and Reviews , 440-448. [17] Qu, H. T.-S. (2008). Fuzzy Support Vector Machine With A New
Fuzzy Membership Function For Pattern Classification. The Seventh International Conference on Machine Learning and Cybernetics. Kunming: IEEE.
[18] Quang, A. t. (2002). Evolving Support Vector Machine Parameters. Slide presentasi ICML . Tsinghua University. [19] Santosa, B. (2007). Data Mining : Teknik Pemanfaatan Data untuk
Keperluan Bisnis. Yogyakarta: Graha Ilmu.
[20] Sembiring, K. (2007). Penerapan Teknik Support Vector.
Bandung: ITB.
[21] Shigeo Abe, T. I. (2002). Fuzzy Support Vector Machines for Multiclass Problems. European Symposium on Artificial Neural Networks -ESANN'2002, (pp. 113-118). Belgium.
[22] Takuya Inoue, S. A. (2001). Fuzzy Support Vector Machines for Pattern Classification. International Joint Conference on Neural Networks (IJCNN ’01), (pp. 1449–1454).
[23] Team, R. D. (2009). R: A language and environment for statistical computing. URL http://www.R-project.org. Vienna, Austria: R Foundation for Statistical Computing.
[24] Vapnik, V. N. (1998). Statistical Learning Theory. John Wiley & Sons.
[25] Vapnik, V. N. (1995). The Nature of Statistical Learning Theory.
Springer-Verlag .
[26] Wei-Yun Yan, Q. H. (2009). Multi-Class Fuzzy Support Vector Machine Based On Dismissing Margin. Proceedings of the Eighth International Conference on Machine Learning and Cybernetics.
Baoding: IEEE.
[27] Wikipedia. (n.d.). Wikipedia. Retrieved from Wikipedia: http://id.wikipedia.org/wiki/Korelasi
[28] Wu, S. A. (1999). Improving support vector machine classifiers by modifying kernel functions. Proc. Int. Conf. Neural Networks, (pp. 783-789).
[29] XindongWu, V. K. (2007). Top 10 algorithms in data mining.
Knowl Inf Syst. London: Springer-Verlag.