A study on the Accelerated Life Test Coupled with
Computation for Life Prediction of Product
According to Wear and Damage
So Young Hwang
1, Hyunsoo Jeong
1and Naksoo Kim
11 Sogang University, Department of Mechanical Engineering, Seoul, 121-742, South Korea Corresponding Author: Naksoo Kim, nskim@sogang,ac.kr
Abstract--In order to guarantee the reliability of the product, an accurate life prediction process is required. Proposed accelerated life test coupled with computation analysis can predict the life of product quantitatively from the design stage. By understanding the mechanism of the product, the characteristic of the failure can be identified and represented by wear model and damage model. Then test response prediction function according to acceleration factor can be obtained utilizing computation analysis. From the test response prediction function, product life prediction function can be determined by defining the quantitative failure. To verify the reliability of proposed procedure, it is applied to predict the life of refrigerator door. In this case, the cause of the failure is the wear of hinge. The wear depth of the experiment and computation showed less than 5% difference. For cross validation, life of bearing is also predicted.
1. INTRODUCTION
As industrial technology is advanced, developing new product in short time has become important factor. In addition, the reliability of new product has emerged as a major issue. The new products that are currently developed are designed to be operable for decades. Therefore the reliability test to guarantee the life of new product is essential. Many researches have been done on reliability test because the time consumed to run the test has critical effect on the new product development period.[1] Generally accelerated life test is conducted to shorten the test period since it is impossible to test the life with actual use condition. Accelerated life test is carried out in cruel condition compare to actual use condition. The degree of harshness is defined as acceleration factor. There are various kinds of stress that can be imposed during accelerated life test and it is important to select the right stress type that fits to the product. Many researches that investigate the efficiency of the accelerated life test according to the stress type are conducted.
Nelson et al.(1980) proposed step stress model and analysis method when accelerated life test is performed using constant stress type.[2] Shaked et al.(1983) researched on efficient acceleration condition to find the life of the product and confirmed that step stress type is more efficient than the constant stress type.[3] Srivastava et al.(2011) imposed various type of stress and proved that step stress type is proper for cutting destruction system.[4] Investigations about basic
procedure of accelerated life test or the type of stress has been done since 1980.
Recently, studies about the material properties and analysis technique of accelerated life test result are conducted. Mettas and Vassiliou (2004) studied analyzing method by dividing the stress factors.[5] Mohammadian and Ait-Kadi(2010) investigated three kinds of approach to analyze the results.[6] Bunea and Mazzuchi(2006) proposed a model that can analyze the data from very small amount of sample[7] while Rajkumar et al.(2011) proposed and confirmed that there are specific accelerated life test models according to material properties. [8] Lee et al.(2012) designed accelerated test condition to understand the friction characteristic of FKM elastomer and predicted the life from the test.[9] Chao Zhang et al.(2013) has proposed analysis model to predict the life of solid lubricated bearings which is very important component in aerospace field. Also an experiment is carried out to prove the analysis model. [10]
However in order to carry out the accelerated life test, completed sample is required. Yet it will take some time to get whole product that is completely manufactured. Also products that are manufactured these days have complex system which complicates to predict the life through accelerated life test. In addition, life predicted by accelerated life test has limitations since the test is performed in harsh condition and not actual use condition.
Therefore in this study, accelerated life test coupled with computation is proposed which can predict the life quantitatively with only few actual tests. Along with proposal, confirmation is made on the possibility of predicting life with various conditions. Then accelerated life test coupled with computation can be utilized to ensure the reliability of product life from the design stage. This can maximize the efficiency of design period.
2. THEORETICAL BACKGROUND
Wear occurs when there is a friction force between two contacted objects repeatedly. Wear can remove material and this leads to operation error. Therefore it is important to understand the variables that generate wear and predict the wear phenomenon. There have been many researches to embody wear behavior and recently this has been applied to numerical method such as finite element method. [11]
The fracture caused by material damage is divided into ductile and brittle fracture according to accompanied strain. In this paper, the process of ductile fracture is considered as the material damage mechanism. One of the characteristics of ductile fracture is that the material goes through significant amount of plastic deformation before fracture. When the fractured plane of ductile material is observed under a microscope, fiber with infinitesimal pool as if tiny tensile test is performed can be seen. Fracture starts with tiny void initiation. These voids are generated around the inclusions or pre-exists. Voids grow and unite each other to generate crack and this lead to fracture. Simply put, the process of cavity nucleation, growth and coalescence reaches to fracture.
In this chapter, two models are investigated. Archard wear model reflecting the hardness and the stress condition and Gurson-Tvergaard-Needleman (GTN) ductile fracture model which represents the plastic deformation and damage.
2.1 Wear model
Wear is influenced by many factors such as property of material, structures, environment and operating condition. Archard insisted that there is a need of some kind of theory which relates the wear ratio and load given. Also Archard explained that the theory have to represent the effective structure of wear and came up with Archard equation as Eq. (1). [12] N
F
s
V
k
H
(1)V is the volume of the wear. s, FN and H is sliding
distance, normal load and hardness of wear surface respectively. k represents the non-dimensional ratio of the wear. Generally, the wear is predicted using Archard equation. In this equation, amount of wear is proportional to sliding distance and the load and inverse proportional to the hardness of the wear surface. Archard wear loss is associated with only the hardness, and wear loss observed and measured in the experiment is constant. Therefore the material hardness is an important variable to determine contact wear of material.[13] However as many researches are done, modified Archard equations that fits to the material characteristics are used. Rabinowicz classified the wear type into severe (galling) wear, moderate wear and burnishing wear according to the k value from Archard equation. Then a equation that represents the state from moderate wear to burnishing wear is proposed.[14] Greenwood and Williansom considered the
[15] In this research, modified Archard model shown in Eq. (2) is used. This equation had increased the degree of freedom for each variable which is applicable according to material characteristics.
a b c
P v
W
k
dt
H
(2)W is the amount of wear. For v, P, H and k is feed rate, normal pressure, hardness of wear surface and non-dimensional wear ratio respectively. Constants a, b and c are the degree of freedom of each variables. In this study, general values are used: as a=1, b=1 and c=2.
2.2 Damage model
Recently, modified Gurson model is used to obtain the result which agree with experiments and include the effect of void nucleation and coalescence. Tvergaard (1981) added three tuning parameters q1, q2 and q3 to predict the strain at fracture accurately and proposed modified yield condition as shown in Eq. (3). Tvergaard had revised the equation through experiment data and found that when q1 = 1.5, q2= 1 and q3 = 2.25, reasonable fracture can be predicted.
2 * 1 2 3 2 cosh 2 e m y y
q f q
*2 31 q f 0
(3)
Also, Tvergaard and Needleman (1984) considered the modified volume fraction f*=f*(f) according to void volume fraction f to explain the void coalescence as shown in Eq. (4).
*
( )
c
F c
c c c f
f c
F f
f if f f
f f
f f f f if f f f
f f
f if f f
(4)
fc and ff is critical value of void volume fraction and fracture void volume fracture respectively. These are material constants of fracture model. As shown in Eq. (4), when the void volume fraction is below the critical value, void volume fraction is applied as effective void volume fraction as it is. However it is over the critical value, the effect of hydrostatic stress is increased and the value increases rapidly. In this case, plasticity instability is promoted. The relation of void nucleation and the growth can be described as Eq. (5).
1
pl plgrowth nucleation kk e
f
f
f
f
A
(5)2
1
2
2
pl
n e n
Eq. (5) distinguishes the void nucleation and the growth while Eq. (6) represents the probability distribution of void nucleation. The lower case letter n is the average while sn stands for standard deviation of standard normal distribution of A/fn .
3. ACCELERATED LIFE TEST COUPLED WITH COMPUTATION
3.1 Mechanism
First step is to understand the cause of the failure. In order to find the cause of the failure, mechanism of the component must be understood. Then specific factors that affect the failure of the component can be determined such as temperature, humidity, and load.
In case of refrigerator door, the life is predicted according to the deflection of the door. As shown in Fig.1, when the door is opened or closed, the door is rotating around the axis of the rotation. Then the weight of the door and the stuff inside the door apply the load. If the load is applied, the hinge fixed in rotation axis and the hinge fixed on cabinet contacts and rotates. Then the wear and damage occurs on the hinges which result in door deflection.Therefore the cause of the failure is the wear and damage on the hinge. Hinge looks as shown in Fig.2. There are four set of hinge at each corner of the refrigerator. Therefore as the door opening is repeated, hinge wears out which result in deflecting the door.
The main factors that assumed to increase the wear and damage on the hinge are the load. Therefore the effective stress factors are the load and rpm.
Fig. 1 Failure mechanism of hinge
Fig. 2. Hinge in refrigerator door
3.2 Accelerating test condition
After selecting the effective stress factors, accelerating test condition must be determined. It is to find the influence of each stress factors and define acceleration factor (AF) which is the amount of acceleration. If there are multiple factors, influence of each factor should be tested independently. Then relation between factors to the failure must be defined.
In case of door hinge, acceleration factor is the load. Therefore AF can be represented as shown in Eq.(7)
1
AF
R N
F
(7)1
Total revolution
R
N
(8)N1 represents the number of cycle at measurement. As
shown in Eq.(8), R is the value dividing total cycle to N1.
3.3 Test response prediction fucntion
Test response prediction function is tendency of response to number of cycle at specific accelerated condition. For failure of the component, most of the response will be the wear or wear related values. Therefore, response according to cycle must be determined.
For example, when load of 2.8kg is applied on the hinge, reduction in height according to the cycle is shown in Fig.3
3.4 Life prediction function
At specific stress condition, test response prediction function can be determined. If the test response predictions for other stress conditions are obtained, test response function according to AF can be determined. Then by applying the reference value of the failure, life prediction function can be obtained.
Fig. 3. Height reduction according to number of cycle
4. COMPUTATION TECHNIQUES
Advantage of accelerated life test coupled with computation is that the life of a component can be predicted with few actual tests. In order to ensure the result, reliability of the computation must be validated.
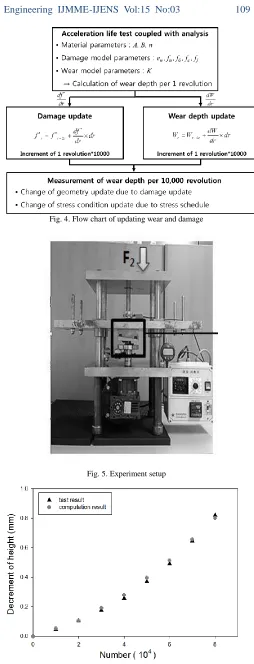
Usually, accelerated life test is done for more than thousand cycles. So it is impossible to simulate every cycle. Therefore updating algorithm is needed. As shown in Fig.4, wear and damage can be updated.
First, material properties and damage model parameters can be obtained from the basic material evaluation test such as tensile test. For wear model parameter k, it can be determined by constant stress condition experiment and step stress condition experiment by reverse engineering. For step stress condition, stress is increased by certain number of cycle. Then for every measured cycle, the amount of wear and damage can be updated as shown in Fig.4.
In case of hinge, the experiment setup is prepared as shown in Fig.5. This machine repeatedly contacts the hinge and rotates. In order to control the load, weight is applied at the top of the machine. As a result the computed decrement of height and the experiment shows good agreement as shown in Fig.6. The difference is within 5%. Therefore the life of the refrigerator door can be estimated to be 17 years, when door is assumed to be opened 30 times a day.
Fig. 4. Flow chart of updating wear and damage
Fig. 6. Comparison between computation and test
5. VALIDATION
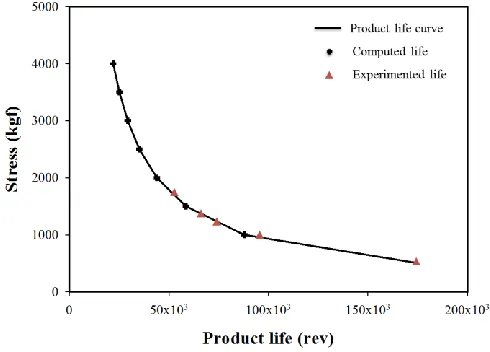
In order to ensure that proposed accelerated life test coupled with computation can be applied to other components as well, ball bearing is selected.
When ball bearing is used, the dimension must be precise. Otherwise the rotation of the axis has run out. Therefore, it is important for bearings to maintain the precision. However, when bearing is used for long time, wear and spalling occurs on the roller and the race which affects the precision. In this chapter, life of bearing according to decrement of height is predicted.
The cause of the bearing reduction in height is the load. Therefore, effective stress condition is due to the load. In order to find the proper k value of the wear model, test machine is built as shown in Fig.7 (a). There are load cells to measure the load given by the oil pump. (Fig.7 (b)) As a result, when k is selected as shown in Table.1, the difference between experiment and simulation was less than 2%.
Then according to applied load, the life of the bearing according to reference value of 0.5 mm reduction in height is obtained. As shown in Fig.8 few experiments are done and rest of the conditions are predicted using computation. To ensure the predicted life curve, a condition that is close to actual use condition is experimented. As a result, it showed good agreement.
(a) (b)
Fig. 7. Bearing wear test machine (a) Full machine (b) Loadcell
Table I
Difference between experiment and simulation result for wear depth
Fig. 8. Bearing life curve
6. CONCLUSION
By applying analytical techniques to the conventional accelerated life test, acceleration life test coupled with analysis is established. It can evaluate the reliability of the product in short time. In order to validate the acceleration life test coupled with analysis, wear experiment is performed and its result and the analysis result is compared to verify the validity. Acceleration life test coupled with analysis predicts the life of the product from the product development stage which can validate the reliability beforehand and reduce the development time. When there is no method to quantify the cause of failure in general accelerated life test, acceleration life test coupled with analysis can predict the life quantitatively by using analytical technique. Therefore by selecting the failure criterion and representing the mechanism with finite element method, even the life of the product with complicated system can be predicted and shorten the developing time.
ACKNOWLEDGEMENT
This work was supported by Sogang University (Grant no. 201210031).
REFERENCES
[1] Jung, Joo, and Jeong (2012) Investigation into the Worst Stress Condition for an Accelerated Life Test of a Compressor in Refrigerators - Acceleration Factor and the Reducible Test Time under High Temperature. Journal of the Korean Society for Power
System Engineering, Vol. 16, No.3, pp. 44-50.
[2] Nelson, W. (1980) Accelerated Life Testing - Step-Stress Models and Data Analyses Reliability. IEEE Transactions, Vol. R-29, No.2, pp. 103-108.
[3] Shaked, M. and N.D. Singpurwalla (1983) Inference for step-stress accelerated life tests. Journal of Statistical Planning and Inference, Vol. 7, No.4, pp. 295-306.
Parameter Decrement of height
(per 10,000 revolution)
Test result 0.0548 [mm]
Simulation result 0.0533 [mm]
[4] Srivastava, P.W. and N. Jain (2011) Optimum ramp-stress accelerated life test for m identical repairable systems. Applied Mathematical
Modelling, Vol. 35, No.12, pp. 5786-5793.
[5] Mettas, A. and P. Vassiliou (2004) Application of quantitative accelerated life models on load sharing redundancy in Reliability and Maintainability. 2004 Annual Symposium - RAMS. 2004.
[6] Mohammadian, S.H. and D. Aït-Kadi (2010) Design stage confirmation of lifetime improvement for newly modified products through accelerated life testing. Reliability Engineering & System
Safety, Vol. 95, No.8, pp. 897-905.
[7] Bunea, C. and T.A. Mazzuchi (2006) Competing failure modes in accelerated life testing. Journal of Statistical Planning and Inference, Vol. 136, No.5, pp. 1608-1620,
[8] Rajkumar, K., K. Kundu, S. Aravindan, and M.S. Kulkarni (2011) Accelerated wear testing for evaluating the life characteristics of copper–graphite tribological composite. Materials & Design. Vol. 32, No.5, pp. 3029-3035.
[9] Lee, S.H., S.S. Yoo, D.E. Kim, B.S. Kang, and H.E. Kim (2012) Accelerated wear test of FKM elastomer for life prediction of seals.
Polymer Testing, Vol. 31, No.8, pp. 993-1000.
[10] Zhang, C., S. Wang, and G. Bai (2014) An accelerated life test model for solid lubricated bearings based on dependence analysis and proportional hazard effect. Acta Astronautica, Vol. 95, No.0, pp. 30-36.
[11] Shen, X., Y. Liu, L. Cao, and X. Chen, (2012) Numerical Simulation of Sliding Wear for Self-lubricating Spherical Plain Bearings. Journal
of Materials Research and Technology. Vol. 1, No.1, pp. 8-12.
[12] da Silva Jr, C.R.Á. and G. Pintaude, (2008) Uncertainty analysis on the wear coefficient of Archard model. Tribology International, Vol. 41, No.6, pp. 473-481.
[13] Liu, R. and D.Y. Li (2001) Modification of Archard’s equation by taking account of elastic/pseudoelastic properties of materials. Wear. Vol. 251, No.1–12, pp. 956-964.
[14] Challen, J.M., P.L.B. Oxley, and B.S. Hockenhull (1986) Prediction of Archard's wear coefficient for metallic sliding friction assuming a low cycle fatigue wear mechanism. Wear, Vol. 111, No.3, pp. 275-288.
[15] Greenwood, J.A. and J.B.P. Williamson (1966) Contact of Nominally Flat Surfaces. Proceedings of the Royal Society of London. Series A.
Mathematical and Physical Sciences, Vol. 295, No.1442, pp. 300-319.